


fig6
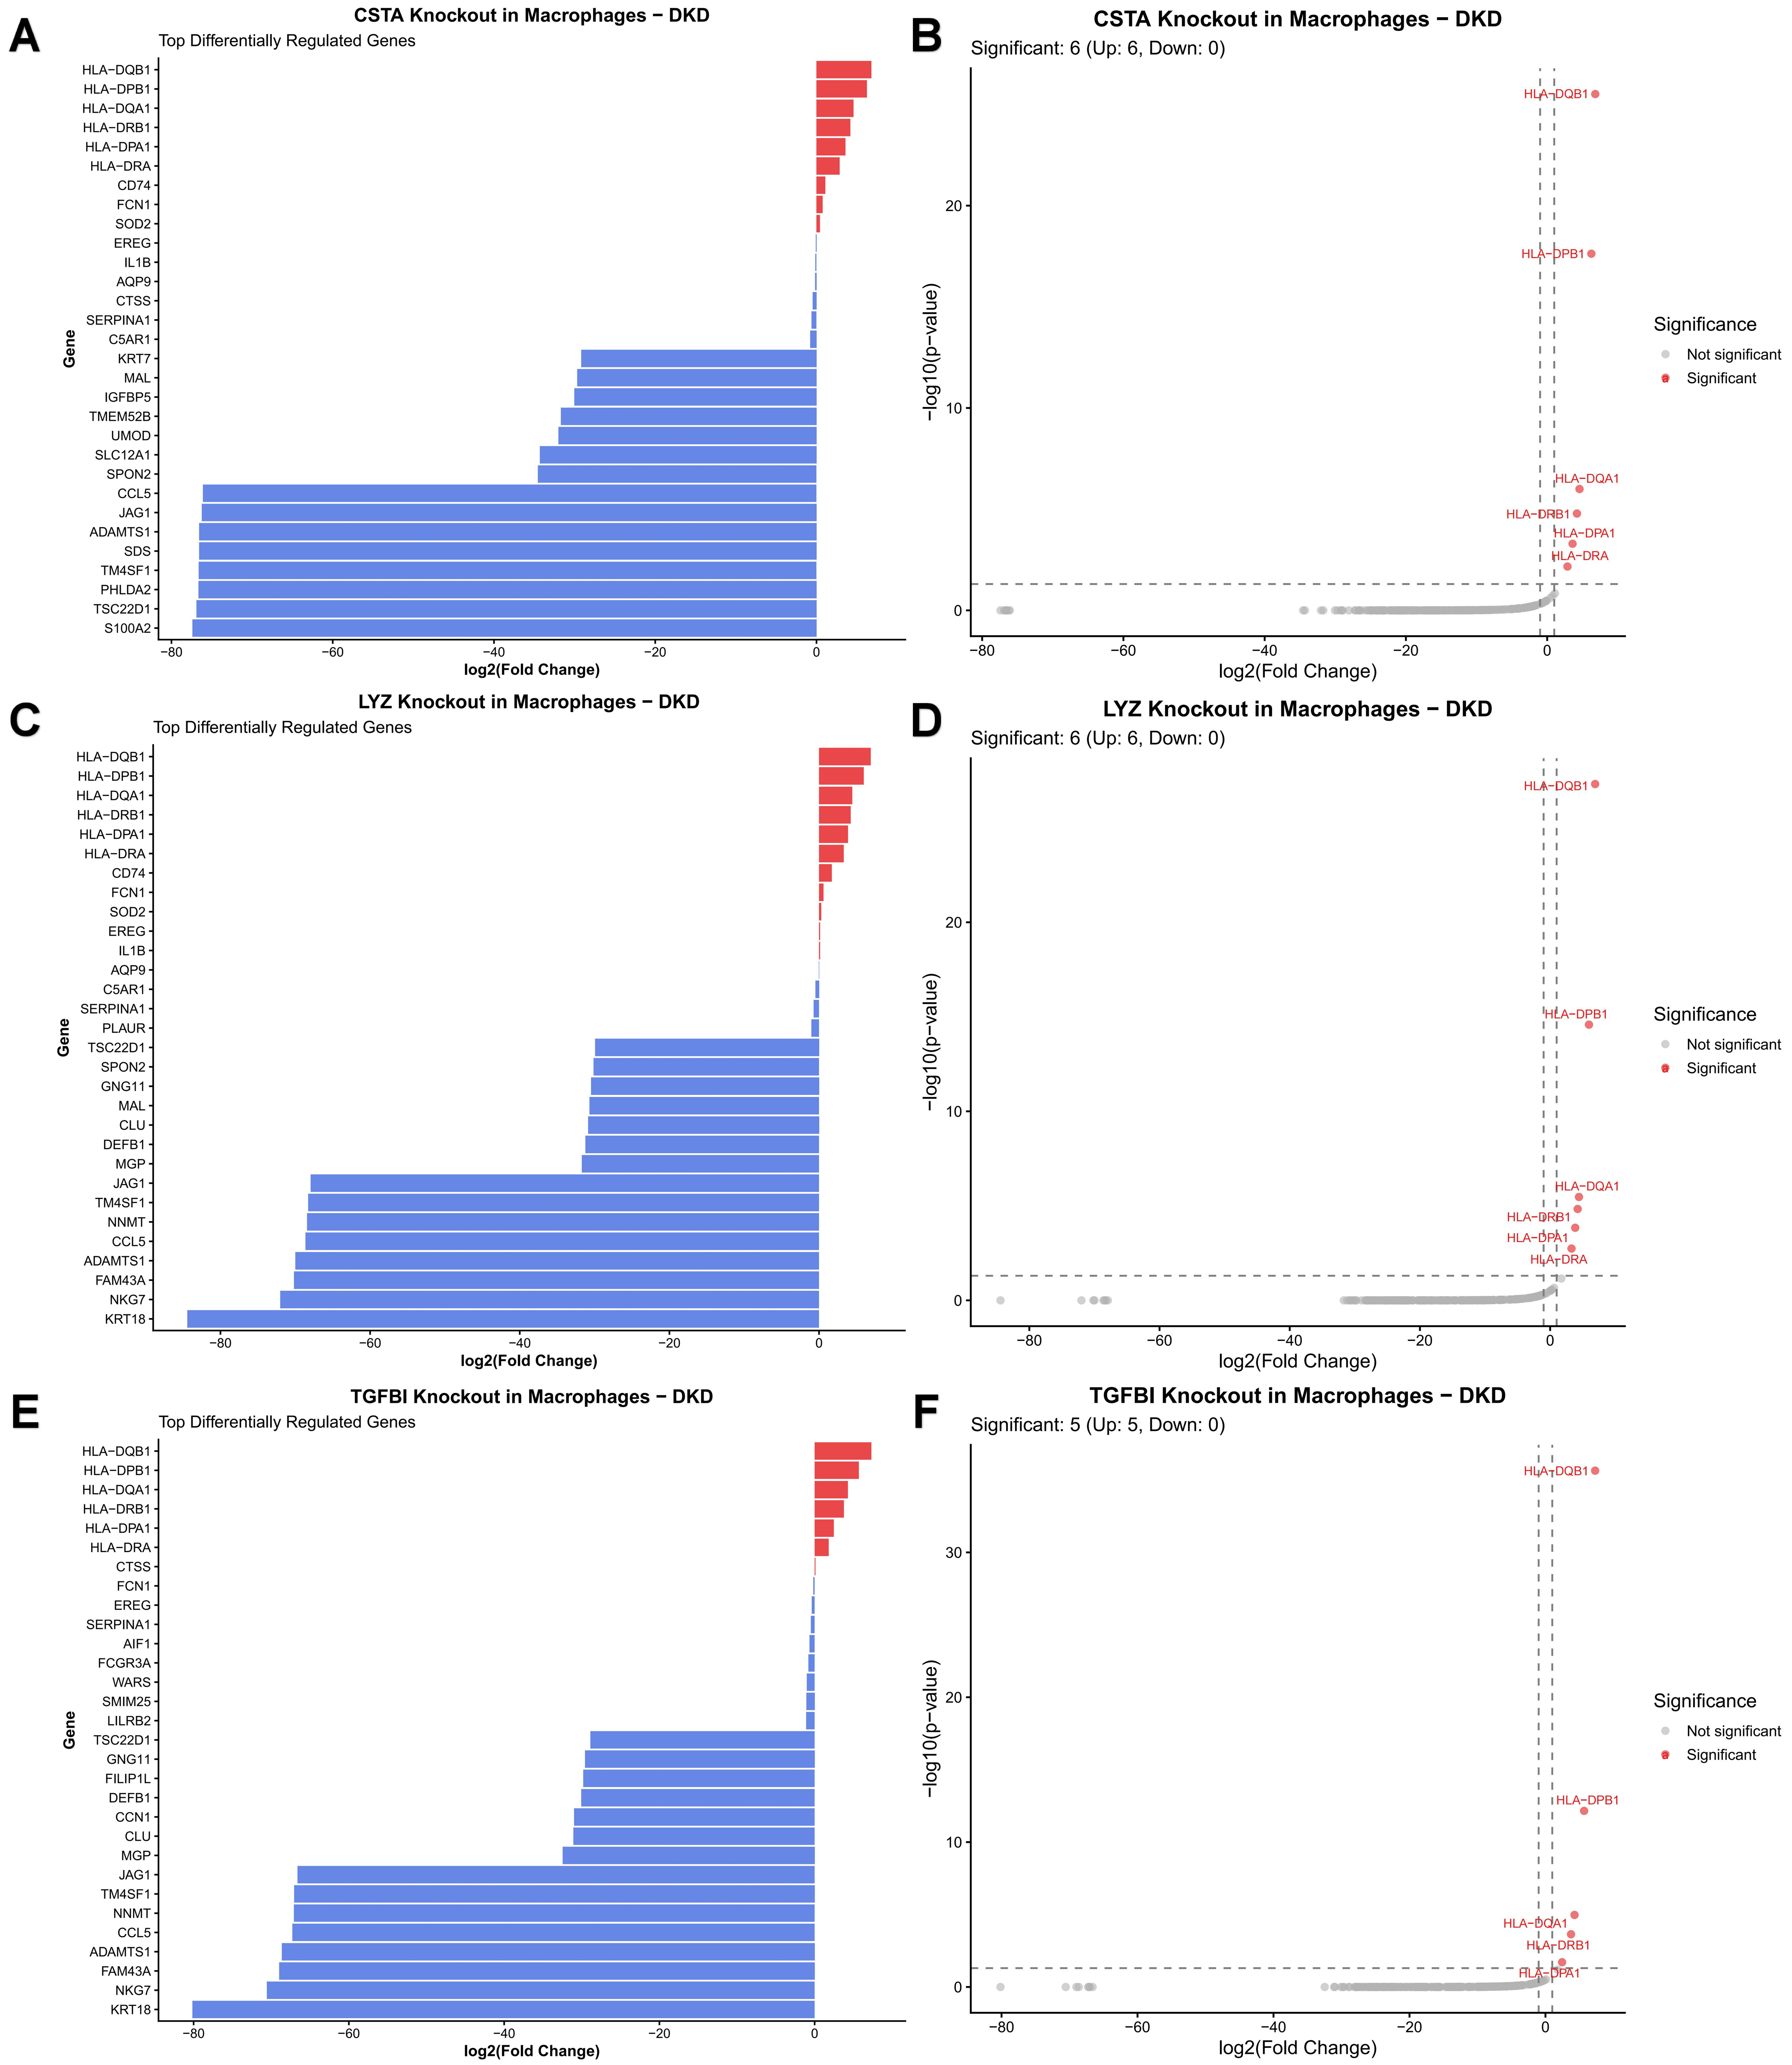
Figure 6. Transcriptional changes following simulated knockout of candidate genes in macrophages. (A and B) Simulated knockout of CSTA in macrophages of DKD patients, showing top DEGs ranked by fold change (A) and the corresponding volcano plot highlighting significant DEGs (B); (C and D) Simulated knockout of LYZ in macrophages of DKD patients, DEGs up- and down-regulation (C) and volcano plot (D); (E and F) Simulated knockout of TGFBI in macrophages of DKD patients, DEGs up- and down-regulation (E) and volcano plot (F). In the bar plots, red bars indicate upregulation and blue bars indicate downregulation. In the volcano plots, red dots represent statistically significant genes. Significance was determined using the scTenifoldKnk algorithm based on one-sided Chi-square tests (P < 0.05 and |log2FC| > 1). CSTA: Cystatin A; DKD: diabetic kidney disease; DEGs: differentially expressed genes; LYZ: lysozyme; TGFBI: transforming growth factor beta induced.


