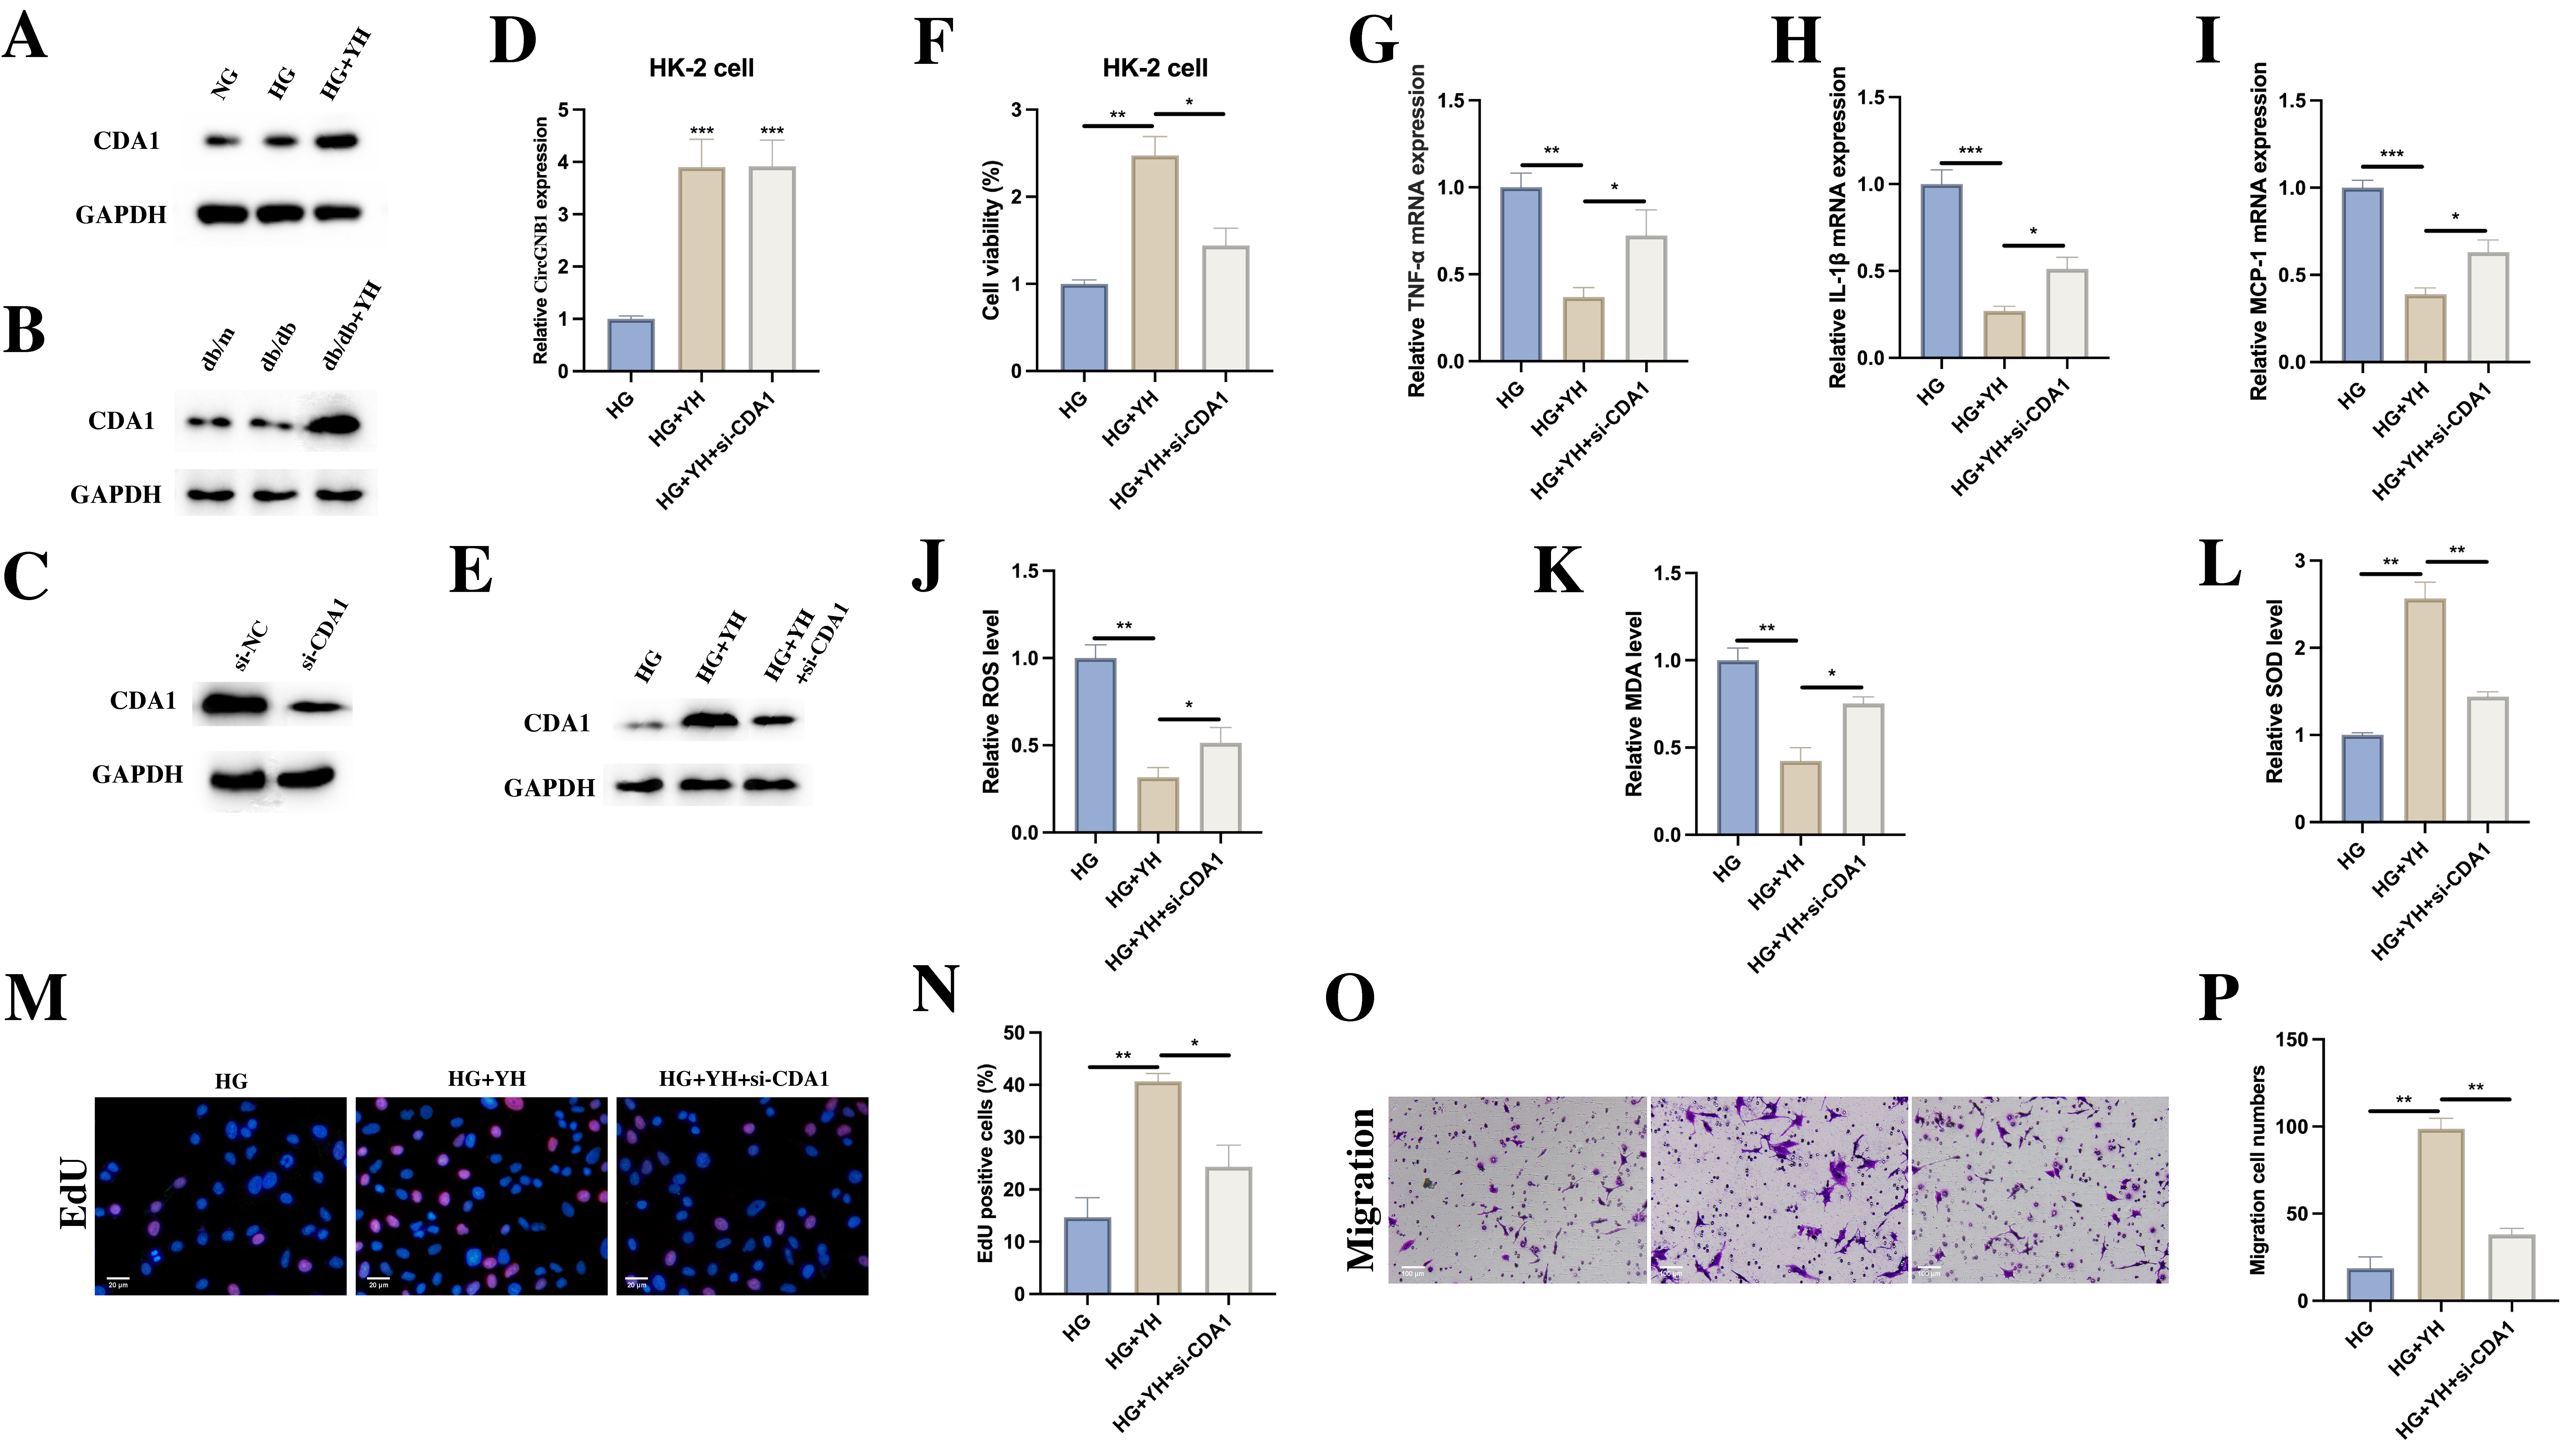
fig6
Figure 6. CDA1’s role in YH’s therapeutic effects on diabetic nephropathy. (A-C) Western blot analysis of CDA1 expression in cells and tissues; (D and E) CircGNB1 and CDA1 expression measured by qRT-PCR and western blot in various experimental conditions; (F) MTT assay results after CDA1 knockdown; (G-I) Inflammatory marker levels following CDA1 silencing in YH-treated HG-induced cells; (J-L) Oxidative stress parameter changes with CDA1 depletion; (M-P) Cell proliferation (Scale bar = 20 μm) and migration capabilities assessment (Scale bar = 100 μm) after CDA1 knockdown. *P < 0.05; **P < 0.01; ***P < 0.001. CDA1: Cell division autoantigen 1; GAPDH: glyceraldehyde-3-phosphate dehydrogenase; qRT-PCR: quantitative real-time polymerase chain reaction; MTT: 3-(4,5-dimethylthiazol-2-yl)-2,5-diphenyltetrazolium bromide; YH: yohimbine; HG: high glucose; si-NC: small interfering negative control; si-CDA1: small interfering CDA1; TNF-α: tumor necrosis factor alpha; IL-1β: interleukin-1 beta; MCP-1: monocyte chemoattractant protein 1; ROS: reactive oxygen species; MDA: malondialdehyde; SOD: superoxide dismutase; EdU: 5-ethynyl-2’-deoxyuridine.


