fig5
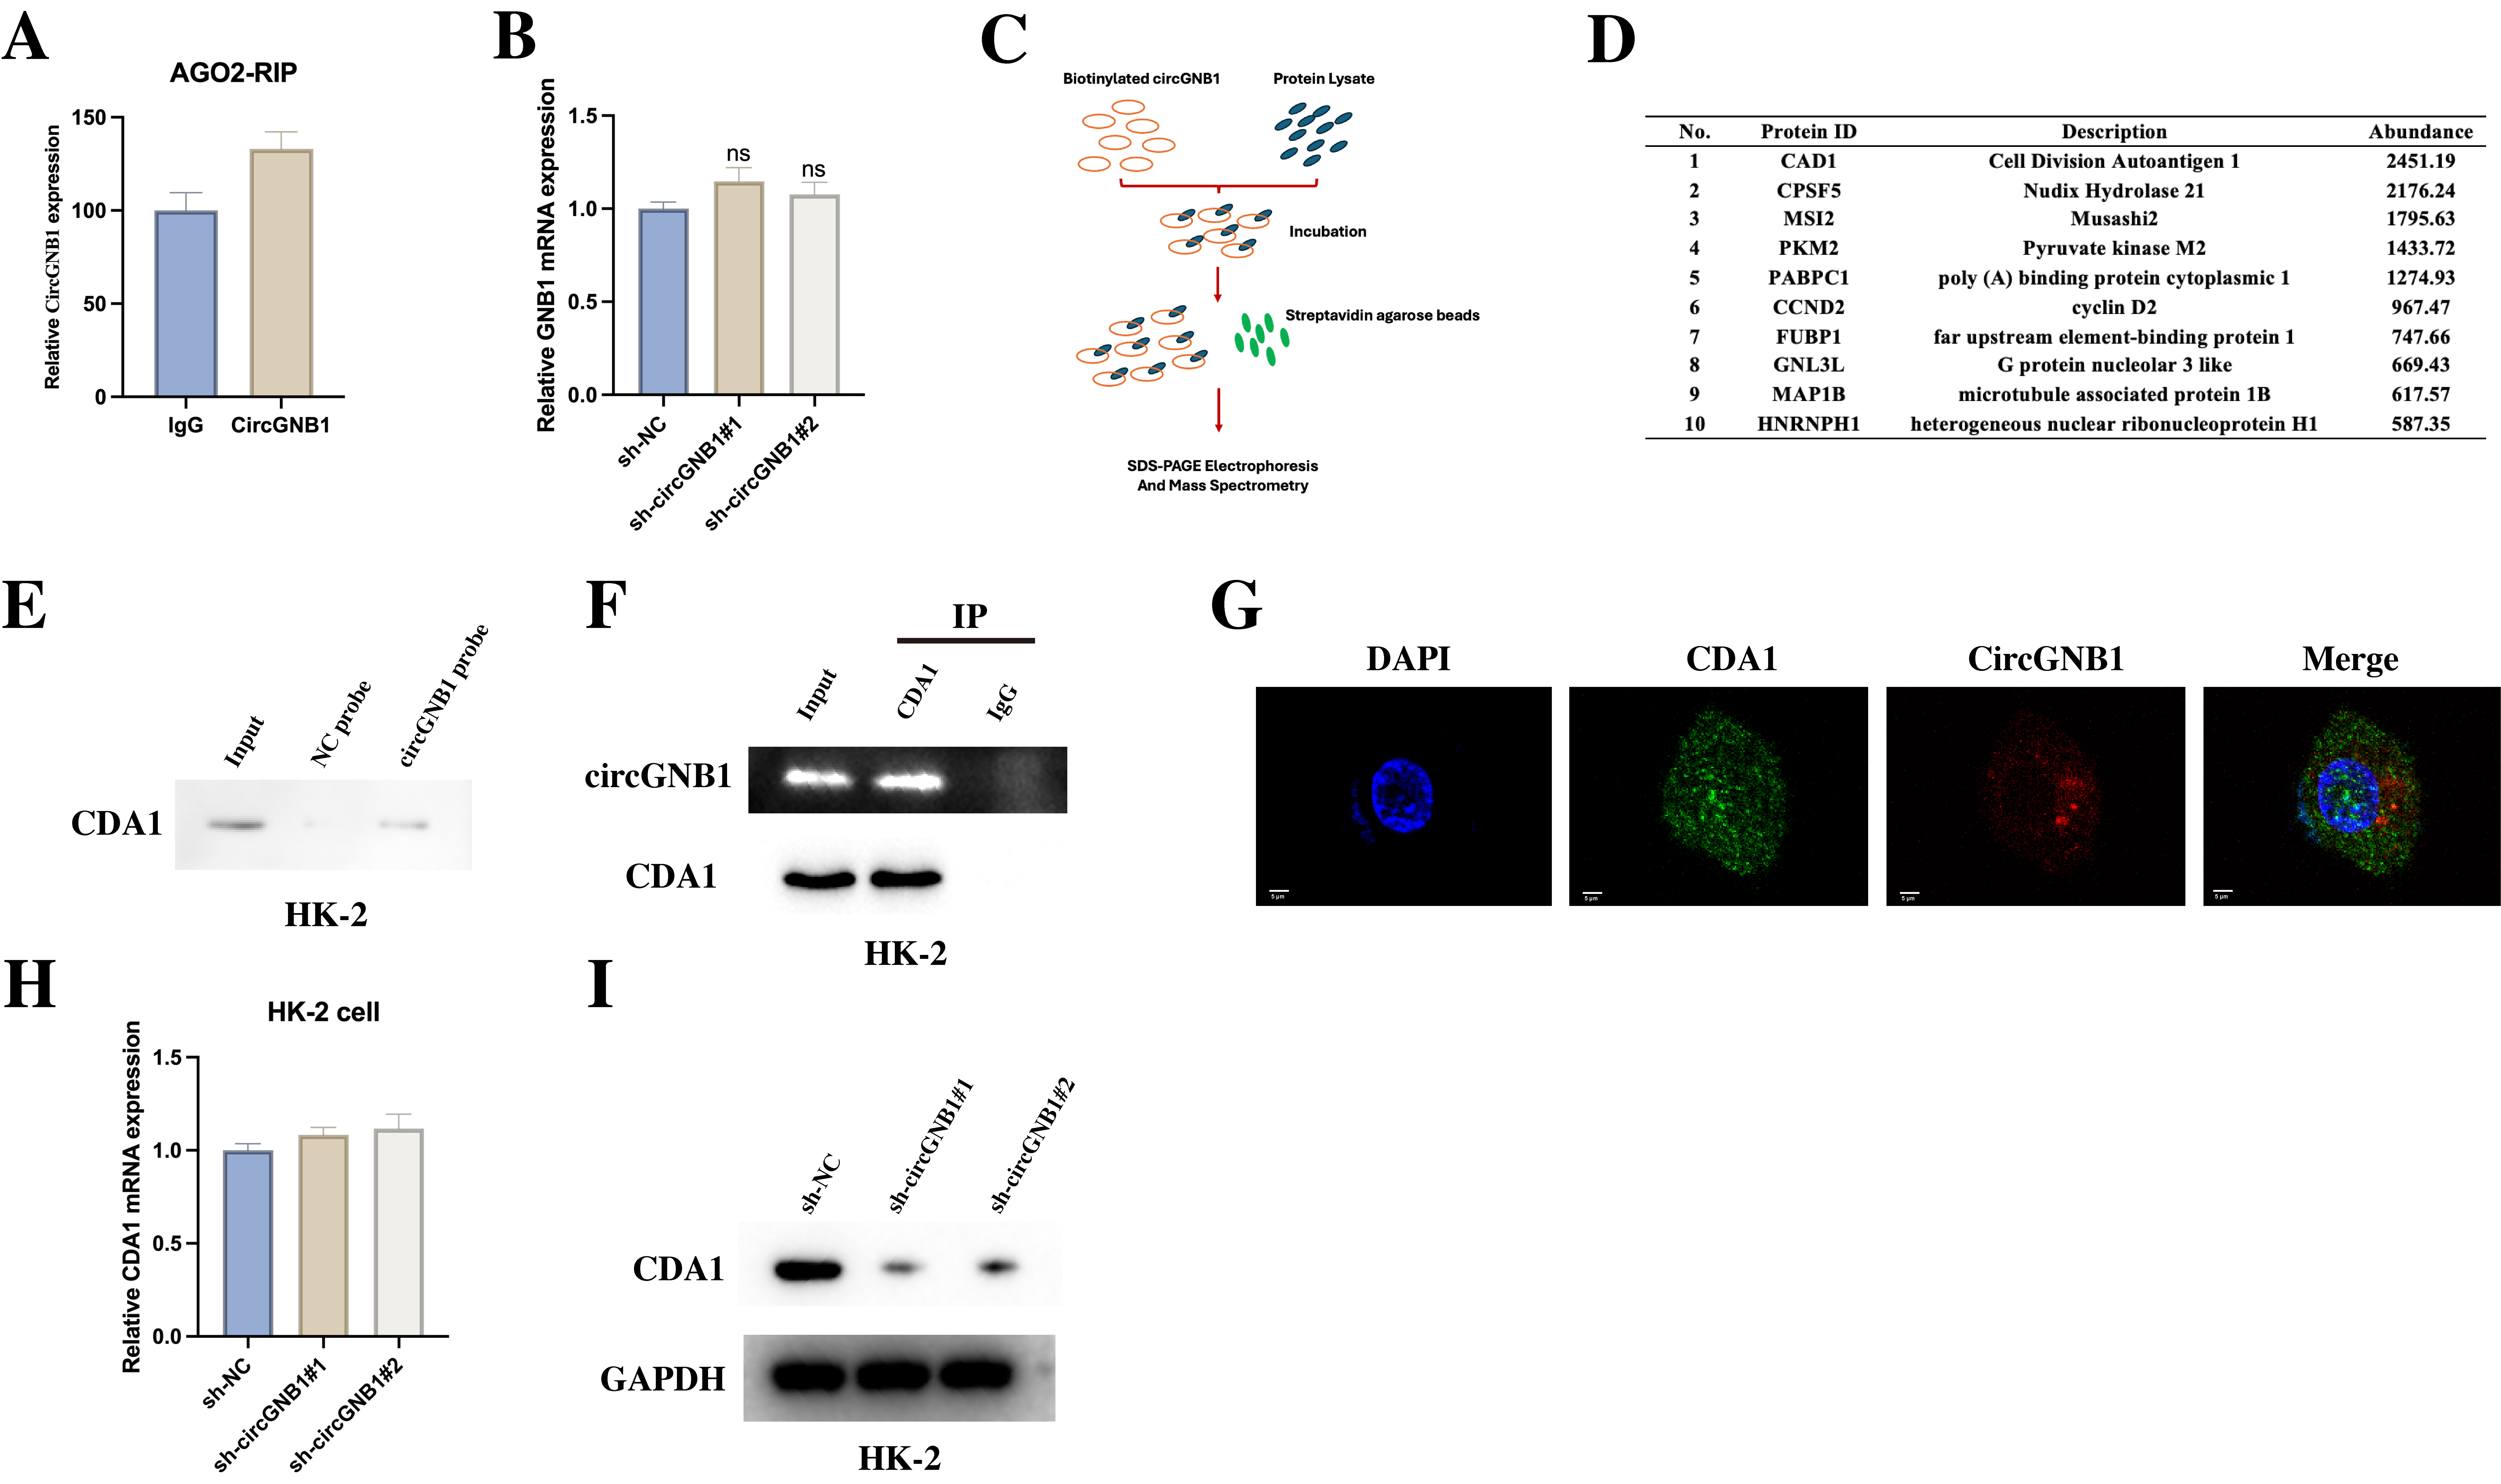
Figure 5. CircGNB1 interaction with CDA1. (A) AGO2 RIP assay results; (B) Expression analysis of linear GNB1 in cells with circGNB1 knockdown; (C) RNA pull-down and LC-MS/MS analysis workflow; (D) Identified proteins enriched with biotinylated probes; (E and F) Validation of interaction between CDA1 and circGNB1 by RNA pull-down and RIP assays; (G) Colocalization visualized by FISH and immunofluorescence (Scale bar = 5 μm); (H and I) qRT-PCR and western blot analyses of CDA1 expression in circGNB1-depleted cells.


