


fig2
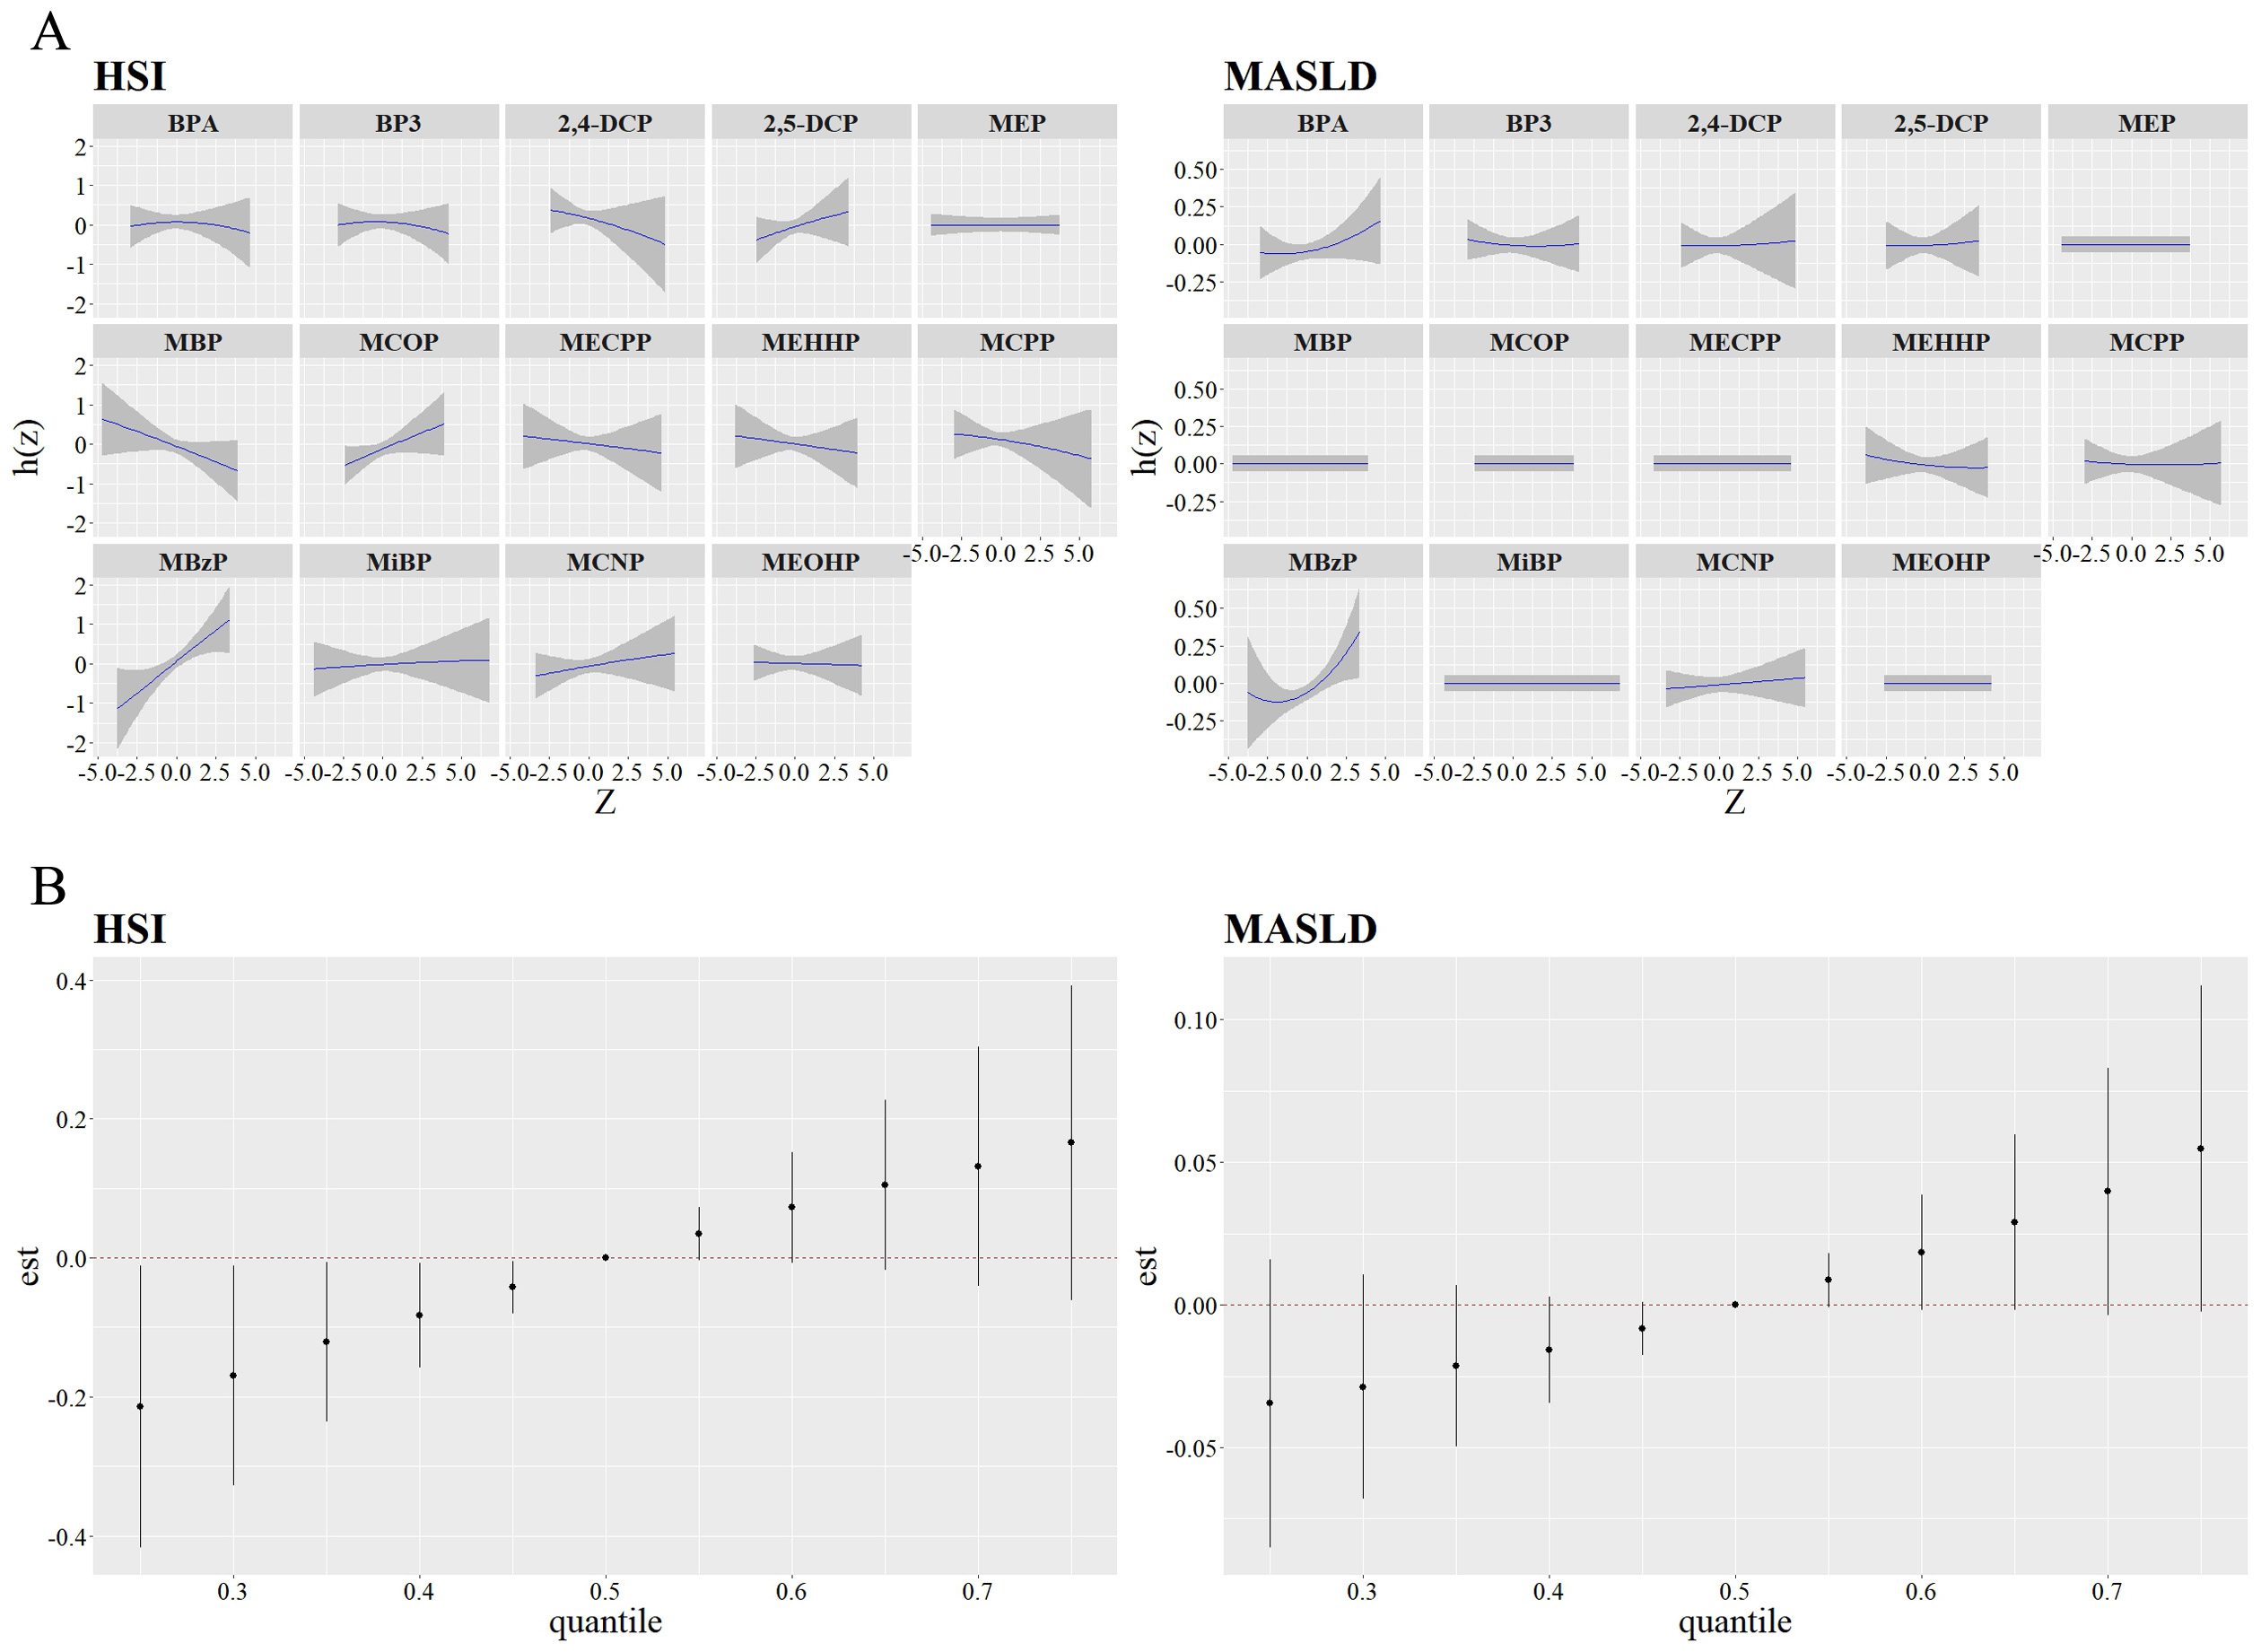
Figure 2. Univariate exposure-response function between the chemicals with HSI and MASLD (A), and Overall effect of the mixture on HSI and MASLD estimated using BKMR (B). Models adjusted for age, gender, race/ethnicity, BMI, PIR, total calories intake, diabetes and ln-transformed serum cotinine, ALT, ALP, and GGT levels.


