


fig1
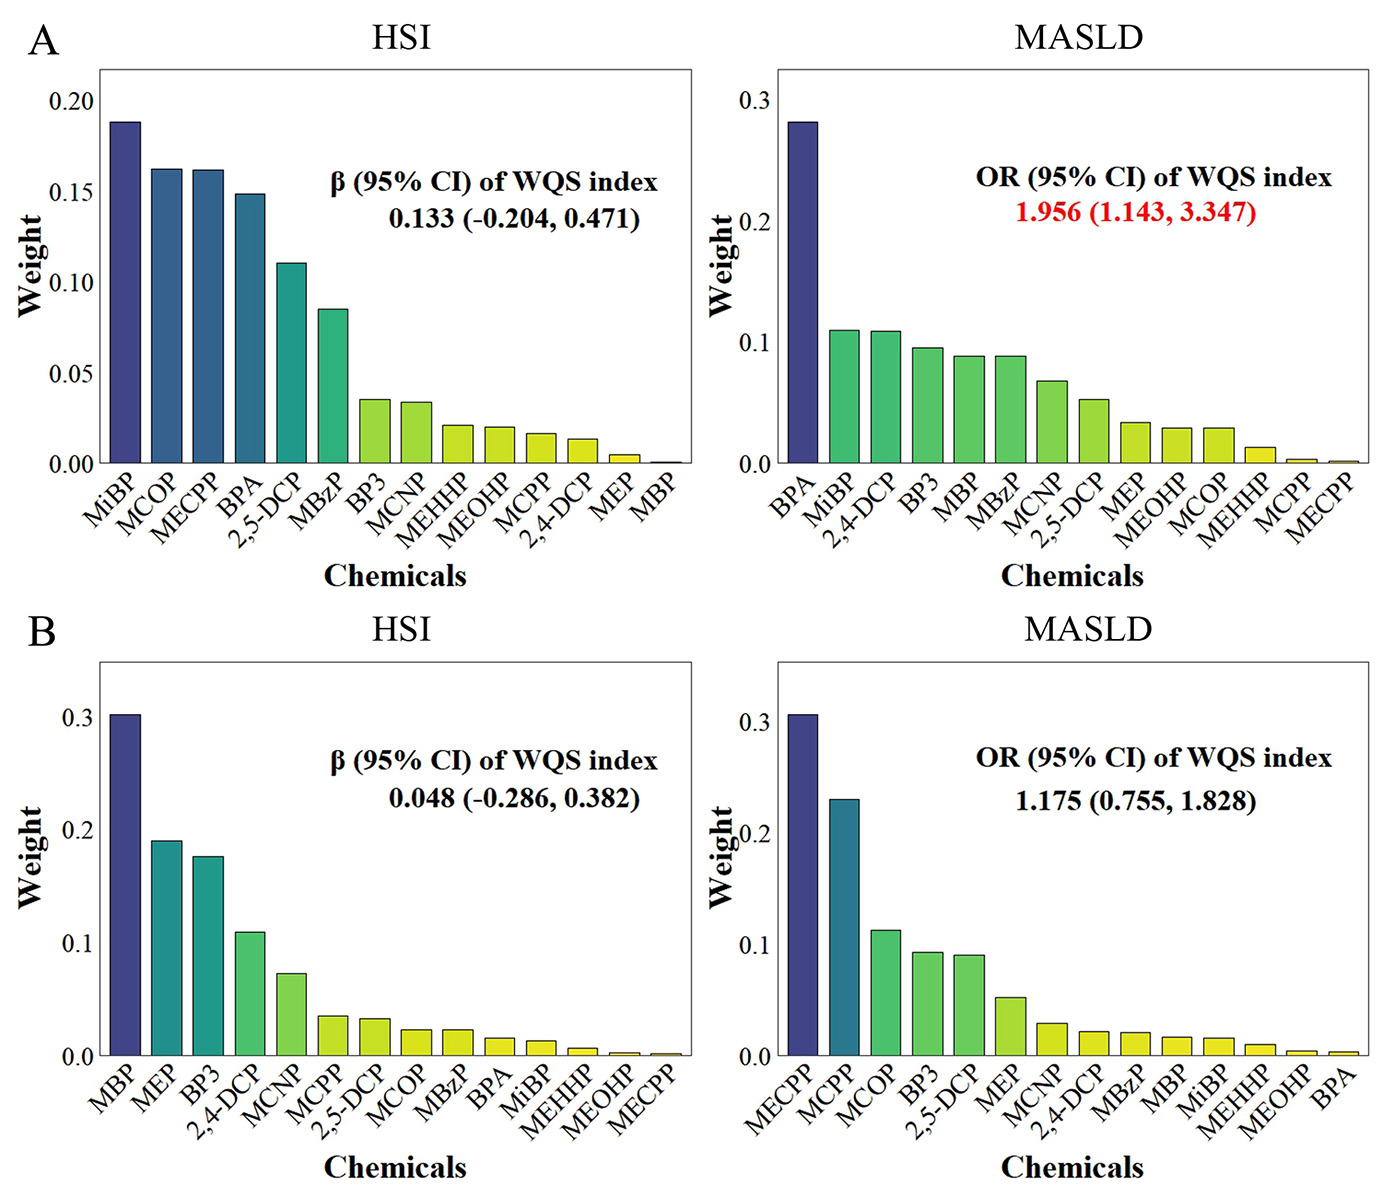
Figure 1. Associations and component weights of WQS index with HSI and MASLD based on the positive (A) and negative (B) WQS models. Models adjusted for age, gender, race/ethnicity, BMI, PIR, total calories intake, diabetes and ln-transformed serum cotinine, ALT, ALP, and GGT levels.


