


Microstructure-informed analytical modeling of composite cathode for solid-state batteries
 0
0 Abstract
All-solid-state batteries (ASSBs) promise high energy density and enhanced safety for electrochemical energy storage. The performance of dense composite cathodes relies on optimizing the phase fractions of cathode active material (CAM) and solid electrolyte (SE) to ensure effective electronic and ionic conduction, as well as sufficient interfacial contact. However, unavoidable porosity introduced during synthesis can compromise mass transport and interfacial kinetics, making it critical to predict optimal phase fractions in the presence of pores. Here, we present a computational framework for constructing an analytical surrogate model that captures complex microstructural effects, informed by numerical simulations of effective transport properties using over 250 virtual 3D microstructures. We systematically investigate the impact of phase fractions and porosity on effective diffusivity and the CAM-SE interfacial area. We report trends due to the differences in the diffusivities of widely studied CAM and SE materials. Our results indicate a tradeoff between achieving high effective ion diffusivity and maximizing specific interfacial area. The percolation threshold for lithium transport in the solid phase depends on the ratio of the diffusivity of the CAM phase to that of the SE phase. These simulation results are accurately described by analytical expressions derived from a nested generalized effective medium theory, offering a robust and practical predictive tool for optimizing composite cathode design in ASSBs.
Keywords
INTRODUCTION
The development of high-performance all-solid-state batteries (ASSB) is critical to addressing the growing demand for safer and more efficient energy storage solutions[1-3]. A key component of these batteries is the composite cathode, where solid electrolyte (SE) and cathode active material (CAM) particles are intermixed, resulting in complex microstructures. To achieve high overall electrochemical performance, optimizing the phase compositions and microstructural configurations during their fabrication is crucial[4]. The primary objective of composite cathode design and optimization is to facilitate ionic transport in the SE and electronic conduction in the CAM, while maximizing their interfacial area for efficient charge transfer[4-6]. It is also desirable to maximize CAM loading within the constraints of maintaining continuous transport pathways and sufficient interfacial contact, ensuring higher energy density. The processing method can have a significant impact on the resulting microstructure and electrochemical performance. While conventional wet slurry mixing and tape casting can be used to produce the composite cathode[7,8], dry processing has recently emerged as a promising solvent-free roll-to-roll approach that can improve homogeneity, reduce manufacturing costs by removing costly drying steps, and eliminate side reactions between the electrode materials and solvent[9-12]. This method typically involves dry mixing the CAM and SE powders together with a binder and conductive additive using techniques such as planetary mixing, ball milling, or twin screw extrusion, and then using a roller to press this mixture into a completed film on a current collector. Despite these advances, composite cathode fabrication is still a new research area, and some SE materials may require additional processing steps (such as sintering) after film formation, making it practically challenging to achieve optimized composite structures, as the fabrication process can lead to incomplete densification that results in residual porosity and interfacial defects such as cracks[13,14]. Experimental studies have shown that microstructural features, including phase fractions, particle size distributions, and porosity, significantly influence ionic and electronic transport, as well as overall electrochemical performance[15-18]. These factors are often interdependent, making it challenging to control them individually through experiments alone, while also complicating the optimization of phase fractions and microstructures of the composite cathode for ideal cell-level performance.
Microstructure-resolved computational modeling has emerged as a powerful alternative for virtual prototyping and design optimization[4]. For instance, Bielefeld et al. investigated the effects of phase composition, porosity, particle size, and electrode thickness on ionic and electronic conductivities in
Finsterbusch et al. performed electrochemical simulations based on 3D microstructures of garnet-type
In large part, these prior studies on composite cathodes for ASSBs have focused primarily on the effects of particle size. By contrast, only a few have explored the impact of porosity or phase compositions[19,28]. Furthermore, prior studies have been constrained by the limited number of representative digital microstructures, primarily due to the high cost associated with the Focused Ion Beam - Scanning Electron Microscope (FIB-SEM) technique and the computational efficiency of microstructure-resolved electrochemical simulations. Efficiently generating a large number of virtual microstructures with controlled phase compositions and porosity, coupled with physics-based simulations to evaluate the effective properties, is essential for comprehensively exploring the high-dimensional design space of phase fractions and microstructure configurations.
In this work, we present a computational framework that integrates microstructure-aware simulations with analytical modeling to enable efficient and accurate evaluation of effective transport properties in complex three-dimensional microstructures of composite cathodes. Using a stochastic method, we systematically generated 250 three-dimensional virtual microstructures by varying the phase fractions of SE and CAM while maintaining controlled porosity levels. Parametrized by the microstructure-aware model using representative lithium-ion diffusivities from literature, we performed flux-based simulations to compute the effective lithium-ion diffusivity and tortuosity factor of these microstructures using a Fickian diffusion model, leveraging a highly efficient fast Fourier transform (FFT)-based solver developed in our previous studies[29,30]. Our results reveal a tradeoff between achieving high ionic diffusivity and maximizing the specific interfacial area. We also found that the percolation threshold for lithium transport in the solid phase is governed by the diffusivity ratio between the CAM and SE. Moreover, the simulated effective diffusivities can be accurately captured by a modified generalized effective medium theory (GEMT), enabling rapid prediction of effective properties and rational determination of percolation thresholds. Note that the percolation threshold found through our analytical model describes a change in the diffusion pathways and behavior of the effective diffusivity versus cathode composition, rather than our suggested volume fraction of solid electrolyte or density. This study establishes a robust framework for optimizing composite cathode microstructures, offering critical guidance for improving the transport performance and overall efficiency of solid-state lithium batteries.
In the following sections, we describe the methods used to generate virtual microstructures with controlled phase fractions and porosities, measure the corresponding specific interfacial area, compute the effective transport property, and apply the modified GEMT. We then present a series of representative 3D microstructures of CAM-SE and compare them with our experimental observation of an LCO-LLZO microstructure. While our microstructural model was validated with LCO/LLZO images, the results are more applicable to a range of cathode/solid-state electrolyte composites. Simulated results for the effective diffusivity, tortuosity factor, and active interface area are represented as a function of the phase compositions and porosity in ternary diagrams. Additionally, the simulation data are fitted using analytical models based on GEMT, from which the percolation thresholds are determined. We also discuss the influences of assumptions made in the physical model and the parameterization of input diffusivities. Finally, we conclude by summarizing the key findings and offering perspectives on the potential applications and extensions of this computational framework.
MATERIALS AND METHODS
Experimental LCO-LLZTO composite preparation & imaging
LiCoO2 (MTI Corporation) and Li6.4La3Zr1.4Ta0.6O12 (NEI Corporation) powders were ball-milled together in a ratio of 75 wt%/25 wt% using a SPEX 8000D Mixer/Mill. The powder mixture was then pressed into a pellet at 3000 psi for 2 min using a 1/2” die (MTI Corporation) and a hydraulic press (YLJ-15, MTI Corporation). A small amount of acetone (40 μL) was added to the powder mixture inside the die before pressing to help with pellet release. The pellet was then sintered in a zirconia tray in a box furnace (MTI Corporation) at 1,050 °C in air for 2 h (with a heating and cooling ramp rate of 5 °C/min). It was then broken with tweezers, and the cross-section was analyzed by scanning electron microscopy (SEM) (Thermo Fisher Scientific Apreo).
Simulation workflow
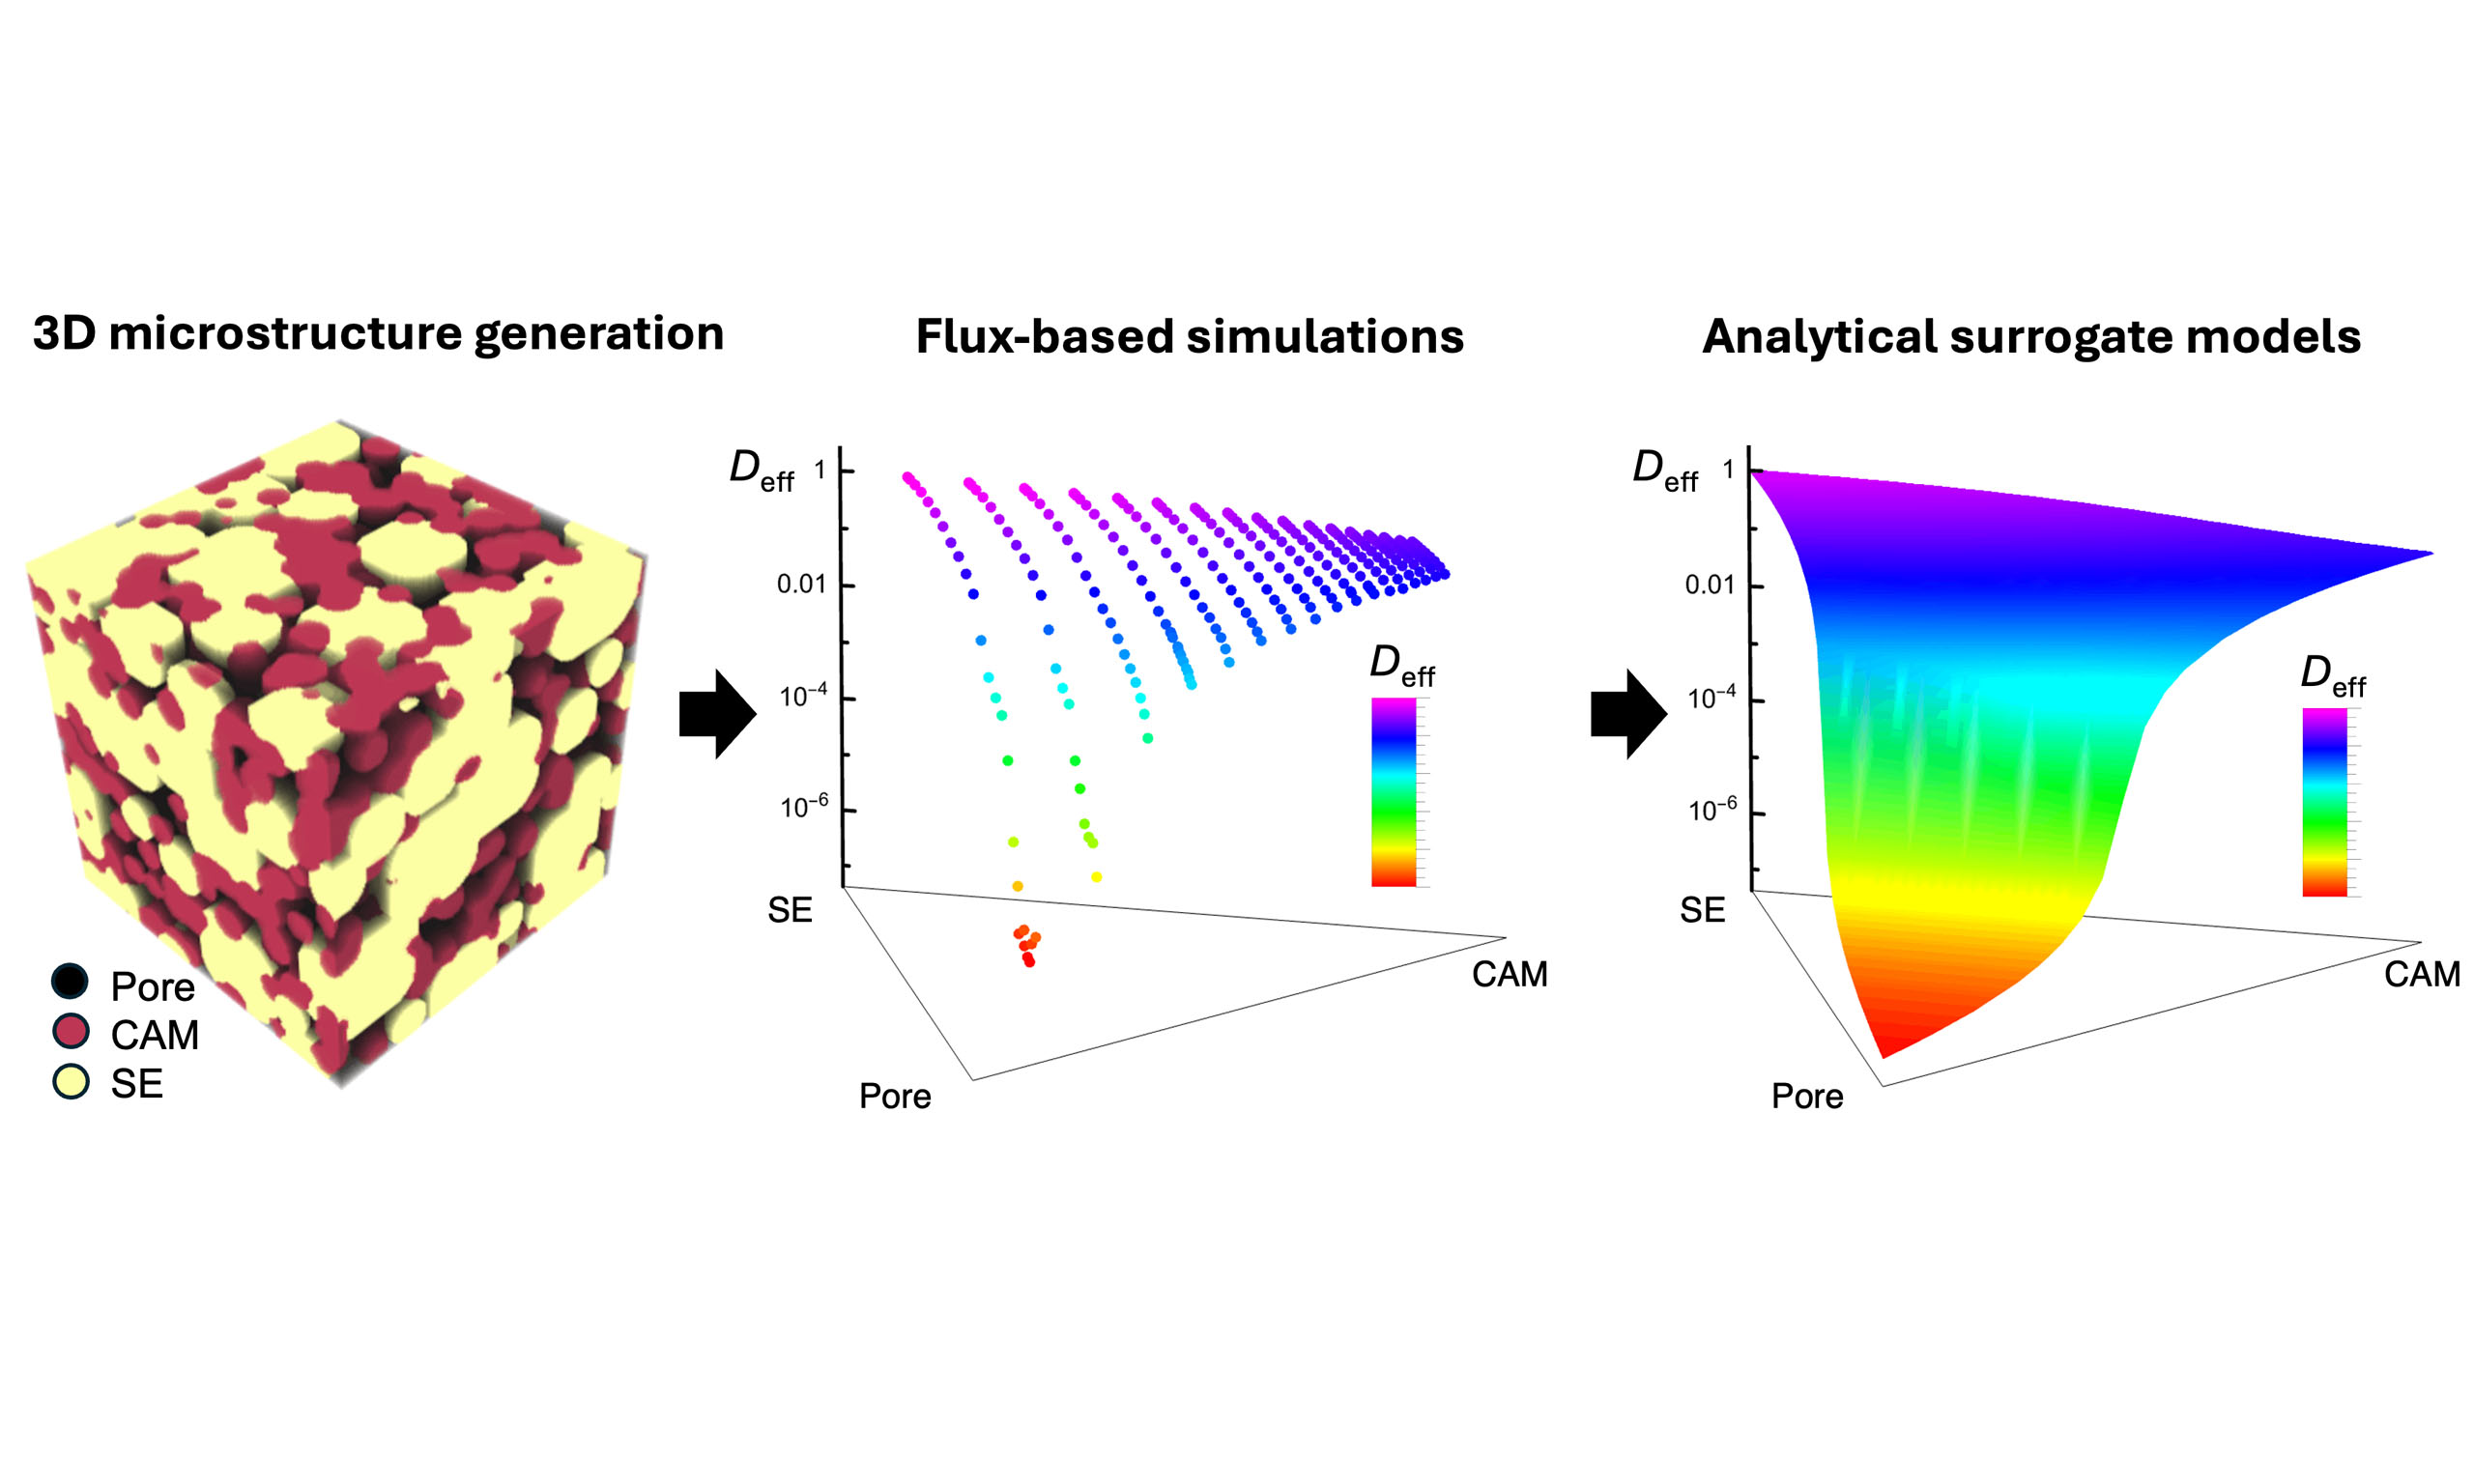
The simulation workflow consists of four steps, as illustrated in Figure 1. First, three-dimensional virtual microstructures were generated using a custom-built code, StructGen, which efficiently constructs multiphase porous microstructures with controlled phase population, particle sizes, and porosities by stochastically populating spherical particles within a simulation domain with periodic boundaries. Overlapping between particles of the same phase or between different phases can be made permissible or impermissible. In the present study, we generated two-phase porous microstructures consisting of two solid phases (Phases 1 and 2). Second, geometric measurements were performed on the generated virtual microstructures to estimate the average domain size of each solid phase (
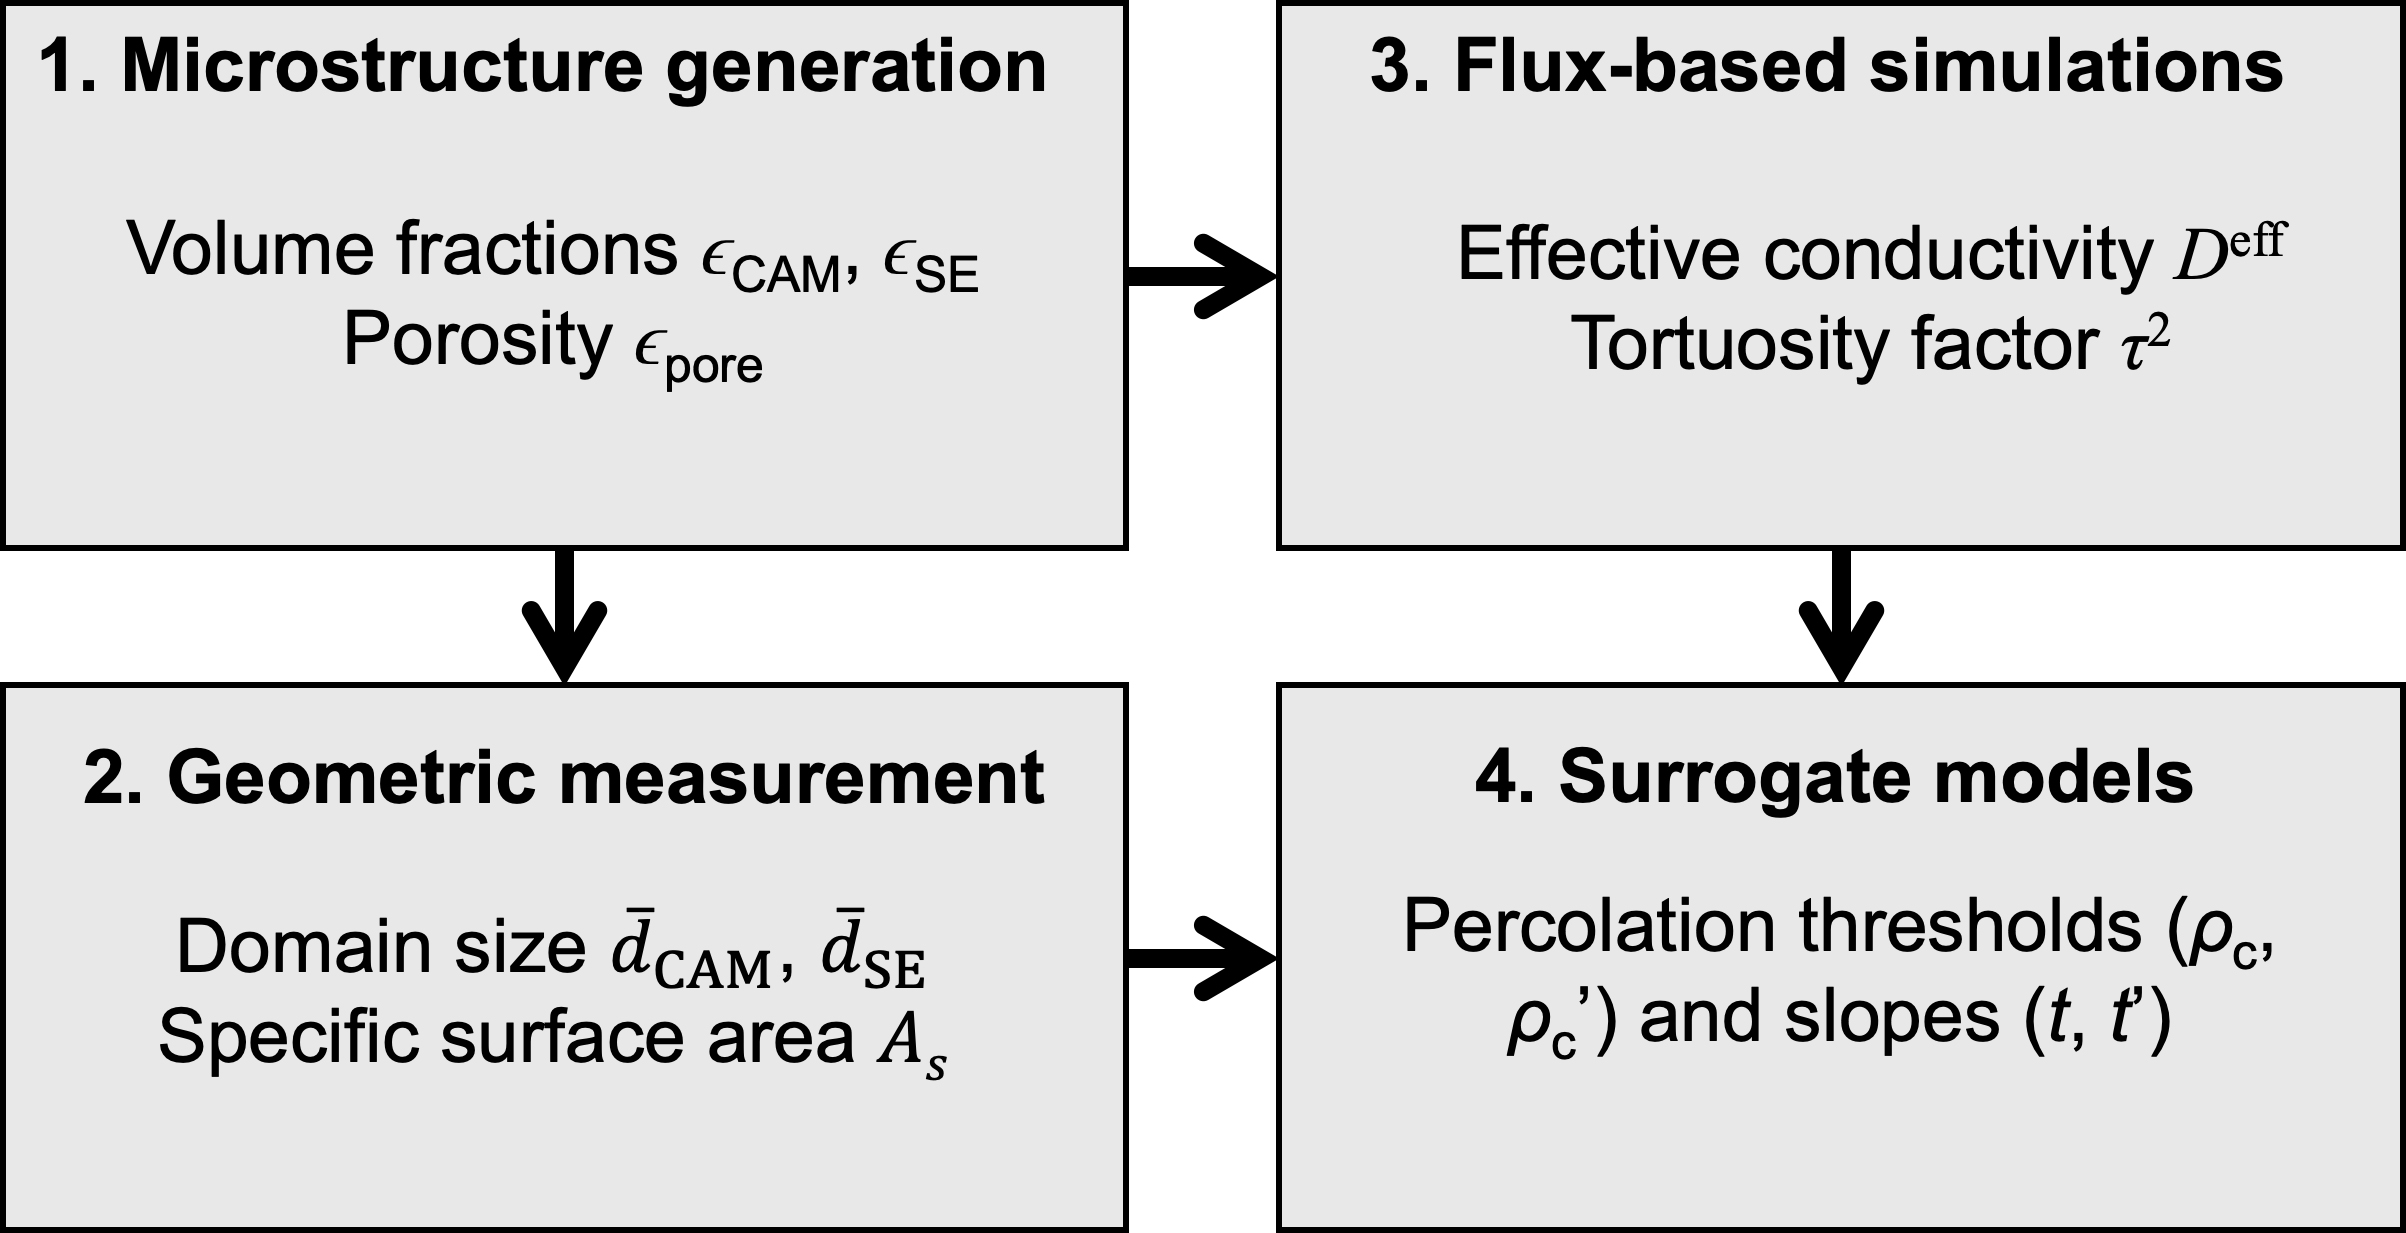
Figure 1. Overview of the workflow for developing surrogate models to evaluate the effects of phase composition on lithium-ion transport in composite cathodes through microstructure-aware modeling. SE: Solid electrolyte; CAM: cathode active material.
Microstructure generation
The simulation box was discretized into a voxel-based grid of size 200 × 200 × 200, corresponding to a physical size of 20 μm × 20 μm × 20 μm, with each voxel representing a 100 nm cube. The virtual microstructures were created in three steps, as illustrated in Figure 2. For visualization clarity, only 2D cross sections of the 3D microstructure were shown.
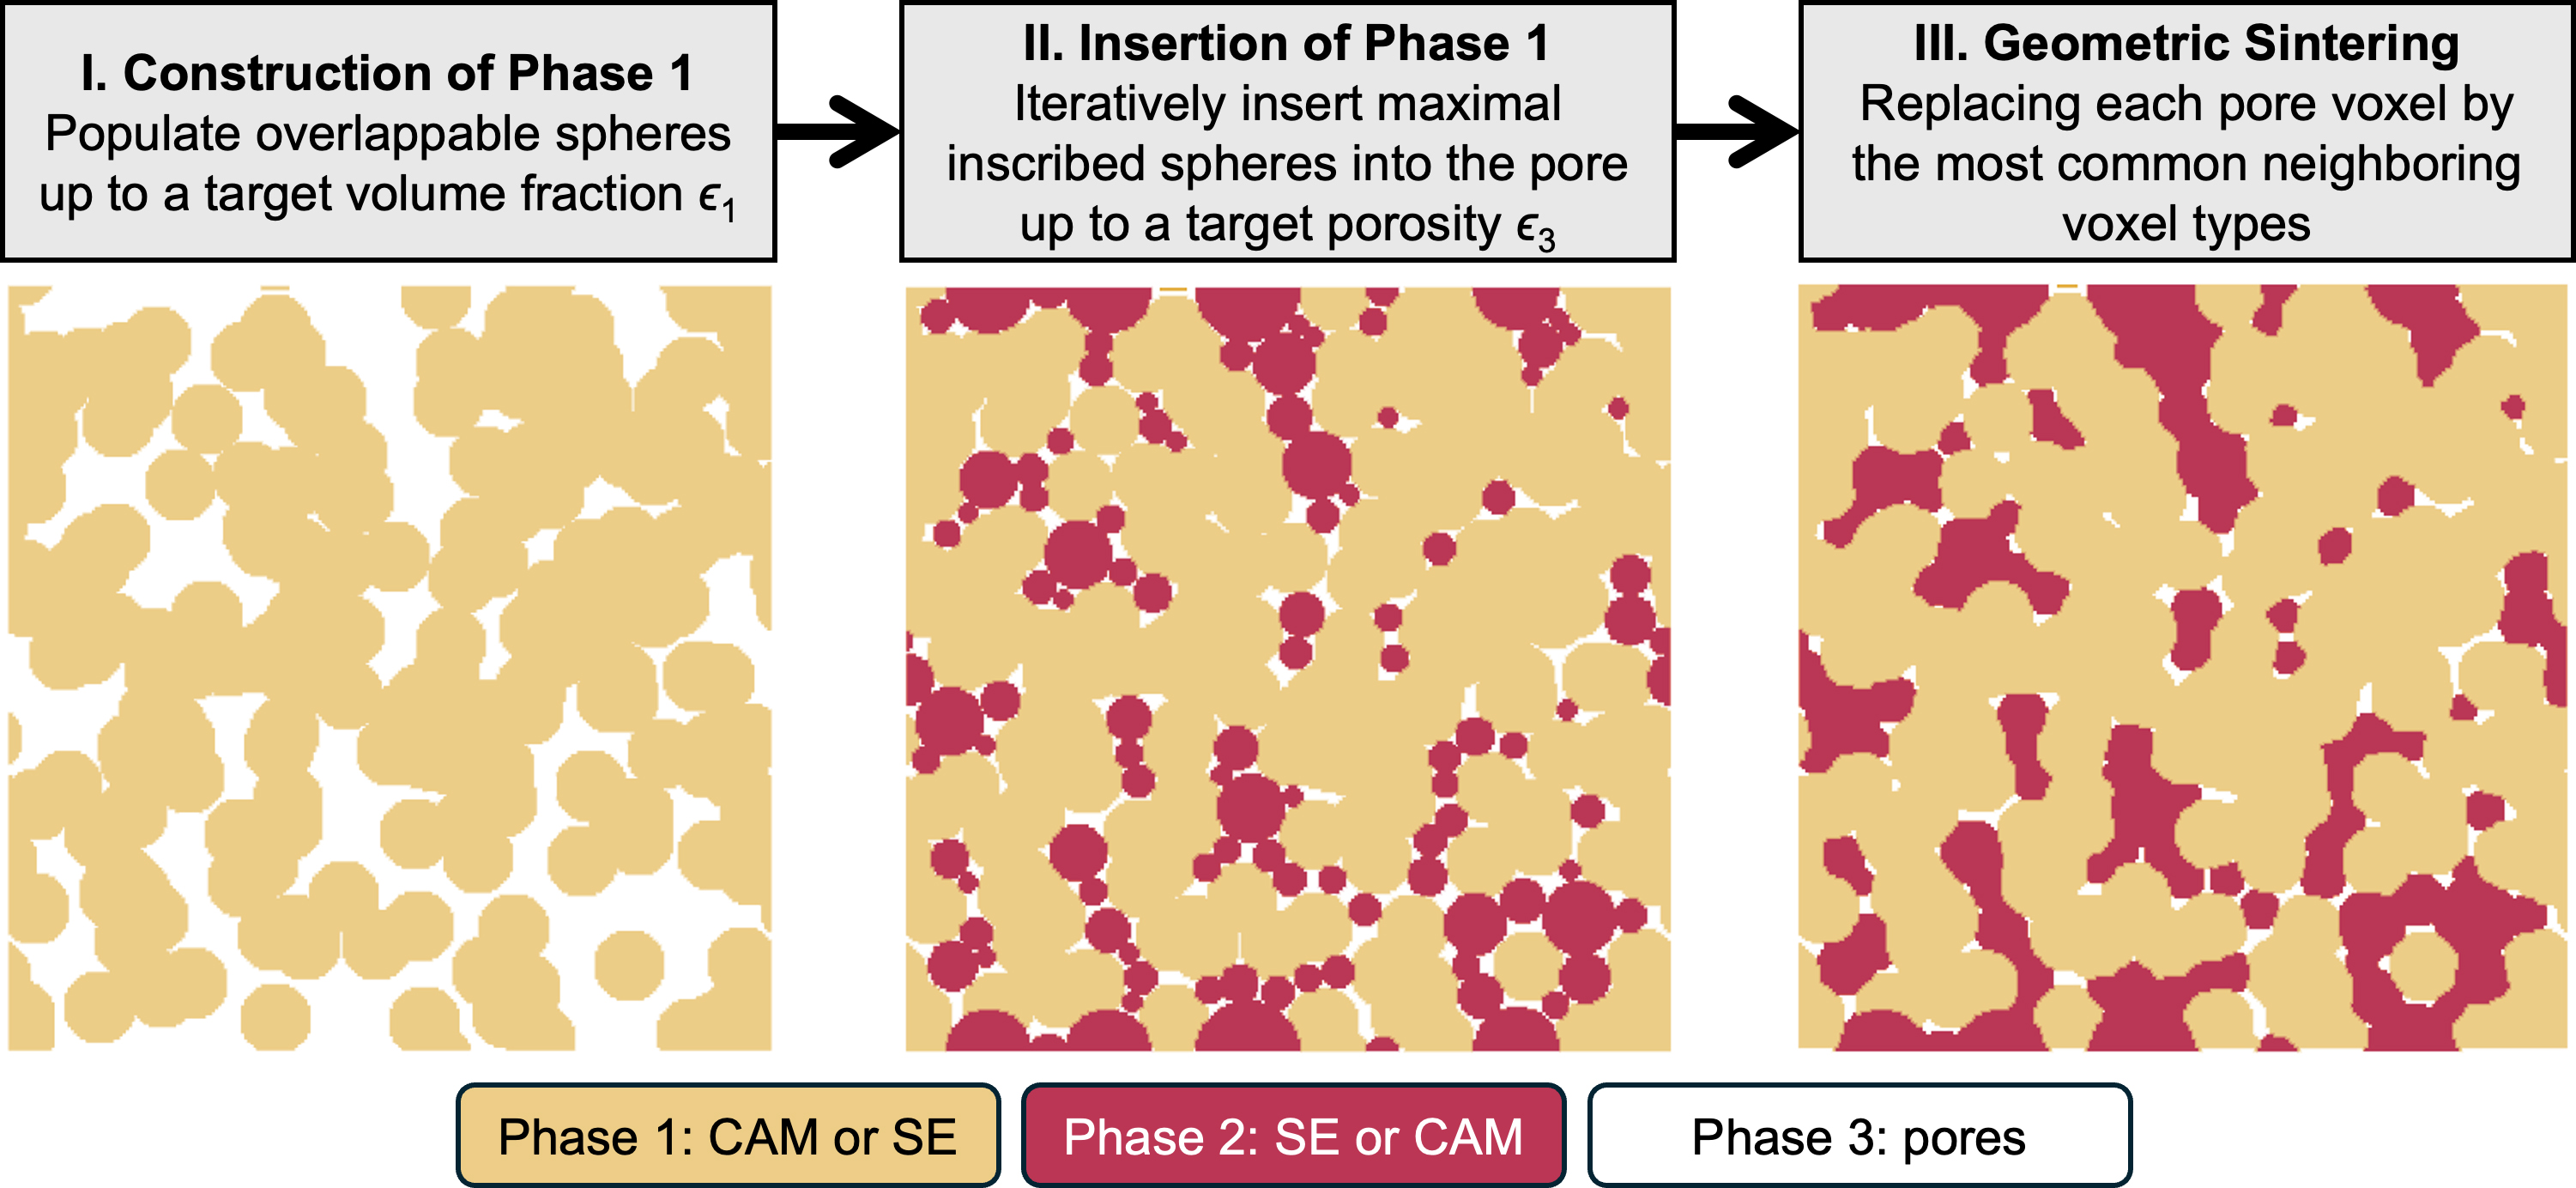
Figure 2. Workflow for generating virtual microstructures. A 2D cross-section of the 3D microstructure is displayed for enhanced visualization clarity. SE: Solid electrolyte; CAM: cathode active material.
First, a porous structure of Phase 1 was constructed by randomly populating spherical particles within the simulation box until a targeted phase fraction ϵ1 was achieved. The particles were modeled as spheres with diameters sampled from a Gaussian distribution (mean: 30 voxels or 3 μm, standard deviation: 5 voxels or 0.5 μm). Overlapping between Phase 1 particles was permitted to ensure efficient packing. Second, the pore regions were filled by inserting Phase 2 particles, also modeled as spheres. Instead of randomly populating Phase 2 particles all at once, an iterative algorithm was proposed to more efficiently achieve the targeted porosity ϵ3. Specifically, a new Phase 2 particle was inserted during each iteration at the location within the pore phase where the largest distance from the Phase 1 surface was identified based on Euclidean distance search. The maximal distance was used as the radius of the newly inserted Phase 2 particle, ensuring interfacial contact between Phase 1 and Phase 2. This approach essentially requires that each Phase 2 particle corresponds to the maximal inscribed sphere of the pore phase at each iteration. Using this method, the targeted porosity ϵ3 was quickly achieved within a few iterations, while overlaps between Phase 1 and Phase 2 particles were strictly prohibited. The resulting volume fraction of Phase 2 is determined to be
Following this procedure, a total number of 258 distinct 3D microstructures of the two-phase porous composite were generated, with varying phase fractions and porosities. The resulting ranges of phase volume fractions were as follows: 10%-85% for CAM, 1%-89% for SE, and 0.3%-87% for pores. The statistical distributions of the total phase fractions (ϵCAM, ϵSE), phase fractions with respect to the solid phase
Geometric measurement
As overlapping between Phase 1 particles was permitted during the microstructure generation, direct segmentation to determine the particle size distributions is not feasible. Instead, the domain size of the CAM and SE phases (
The specific interface area between the two solid phases was calculated as the difference between the interface areas of each solid phase with respect to the pore phase, expressed as:
Effective property calculation
The effective property calculation has been widely used to characterize transport properties and evaluate the tortuosity factor of complex microstructures in battery components, such as porous separators and electrodes of lithium-ion batteries[31,32], polycrystalline[30], or porous solid electrolytes[33], and composite cathodes for ASSB[20,28]. This approach is commonly referred to as the flux-based simulation, the Fickian diffusion model, or the direct numerical simulations[20,31]. It numerically solves the Poisson equation with a spatially varied transport coefficient under an applied gradient of a scalar field variable along each spatial direction. The effective transport coefficient is derived from the resulting average flux density over the applied gradient. In terms of the Fickian diffusion model, the governing equation can be written as
where c(x) is the concentration of the transport species, D(x) is the spatially dependent diffusivity tensor, and x is the position vector in 3D space, i.e., x = (x1, x2, x3). An applied boundary condition imposes a fixed concentration gradient ∇c along one of the spatial directions. The effective diffusivity tensor, Deff, is then determined as
where <•> stands for spatial average over the simulation box, and the flux density J(x) is calculated as
While the local diffusivities of CAM and SE phases are anisotropic in general, we adopted an isotropic approximation for simplicity. The resulting effective diffusivity Deff is also a second-rank tensor, and we averaged the diagonal components to calculate Deff, i.e.,
This approximation is justified in that the virtual microstructures were generated using a stochastic approach, and there is no strong directional preference for the conductive networks. The tortuosity factor,
where DSE is the diffusivity of the conductive SE phase, Deff is the effective diffusivity of the composite, and
The governing Equation (1), along with the boundary conditions, is numerically solved using the
Parameterization of diffusivities
To calculate the effective diffusivity of the composite, the diffusivities of SE and CAM phases were parameterized based on values reported in the literature. In this study, we considered the diffusivities of composite cathode active materials LCO, NMC111, NMC622, NMC811, and lithium iron phosphate (LFP) and SE materials with diffusivities similar to LLZO, such as the thiophosphate family. Each of these materials is significant in all-solid-state battery research, and their transport properties have been reported in prior studies. We emphasize that the modeling framework is general and can be easily applied to other combinations of SE and CAM materials, as the results depend only on the ratio of diffusivities in the CAM and SE phases.
In general, the SE has a higher lithium-ion diffusivity than the CAM. The literature, based on theoretical calculations and experimental measurements, indicates a wide range of diffusivities for the active materials[38] and even within a single SE, such as LLZO. The diffusivity within a single CAM depends on lithiation states; for example, LCO’s diffusivity can range over four orders of magnitude depending on lithiation[39-41]. The wide range of diffusivities in LLZO depends on differences in processing conditions and physicochemical factors such as local atomic configurations[42], dopants[43], interfaces[30,44], and lithium concentrations[45]. The diffusivity of the SE was set to 10-8 cm2/s, based on the atomic simulation-informed study that accounted for the microstructural impacts of polycrystalline LLZO[30,42]. Many families of solid electrolytes, such as thiophosphates and perovskites, exhibit diffusivities between 10-11 and 10-8 cm2/s and approach diffusivities of 10-7 m2/s for the most optimized materials[39-41]. For this study, the diffusivity of the CAM ranged from 10-12-10-9 cm2/s, which covers the diffusivity of widely researched NMC111, NMC622, NMC811, LCO and even LFP[38,40,46,47]. The highest diffusivity of 10-9 cm2/s is based on a three-dimensional phase-field study that accounts for lithium intercalation-induced stress effect in polycrystalline LCO[48]. The diffusivity of the pore phase was set to zero. Since only the relative ratio of diffusivities between the two materials was required, the diffusivity of the SE was normalized to unity. The maximum effective diffusivity corresponds to the limit of a fully dense SE. To account for the variations of CAM diffusivity, sensitivity tests were performed using ratios of DCAM/DSE = 0.1, DCAM/DSE = 0.01 and DCAM/DSE = 0.001. Considering that our effective diffusivity model assumes linear diffusion laws, these ratios represent various combinations of specific CAMs and SEs. Only the largest ratio is presented in many of the main document figures, while ternary diagrams for the two smaller ratios are given in Supplementary Figure 2 and will be analyzed in the Discussion section. We discuss how the percolation threshold depends on this ratio.
Generalized effective medium theory
The effective medium theory (EMT) is a widely used model for predicting the transport properties of heterogeneous materials, particularly for two-phase composites. It provides an analytical approximation for the effective transport properties of a two-phase composite by accounting for the local properties and volume fractions of the individual phases. This approach has been extended to multiphase systems[33,49], known as GEMT.
We proposed a GEMT model for the ternary system of porous CAM-SE by combining two EMT models of two binary subsystems. The first EMT model describes the interaction between Phase 1 and Phase 2, forming a lumped solid composite phase. The second EMT model then accounts for the mixing between the pore phase and the lumped solid phase. This nested approach enables the calculation of the overall effective diffusivity, Deff, through the formula
where ρc is the percolation threshold of the three-phase composite in terms of the solid phase fraction (i.e., density), and t is the effective percolation slope[33,49,50]. The lumped solid phase has a diffusivity, Dsolid, which is calculated based on the diffusivities and volume fractions of the individual SE and CAM phases, i.e.,
where ρc’ is the percolation threshold between SE and CAM, and t’ is the corresponding effective percolation slope. By solving Equations (6) and (7), one can obtain an analytical expression of Deff in terms of ρ and the solid volume fraction ϵs,SE, i.e., Deff(ρ, ϵs,SE), with four fitting parameters t, t’, ρc, and ρc’. To be consistent with our numerical simulation, normalized values of DSE and DCAM are used and set to be 1.0 and 0.1, respectively, unless otherwise stated. A negligibly small value (10-7~10-4) is assumed for the normalized Dpore to aid in data fitting, depending on the choice of DCAM/DSE.
RESULTS AND DISCUSSION
In this section, we first present a few selected representative 3D microstructures with different phase fractions and porosities and compare them with the cross-sectional views of the microstructures from experimental characterizations to demonstrate that our stochastic model captures key morphological features. Using the generated virtual 3D microstructures, we systematically investigate how phase compositions and porosity influence the effective diffusivity (Deff), tortuosity factor (τ2), and specific interface area (As) by flux-based simulations and geometric measurements. We parametrize analytical models for Deff, τ2, and As based on the simulation results. The As is accurately captured using a symmetric Dirichlet distribution.
Representative microstructures
We fabricated a simple LiCoO2-Li6.4La3Zr1.4Ta0.6O12 (LCO-LLZTO) composite by ball milling 25 wt% LLZTO and 75 wt% LCO powders together for 60 min, pressing the mixture into a pellet, and co-sintering it at
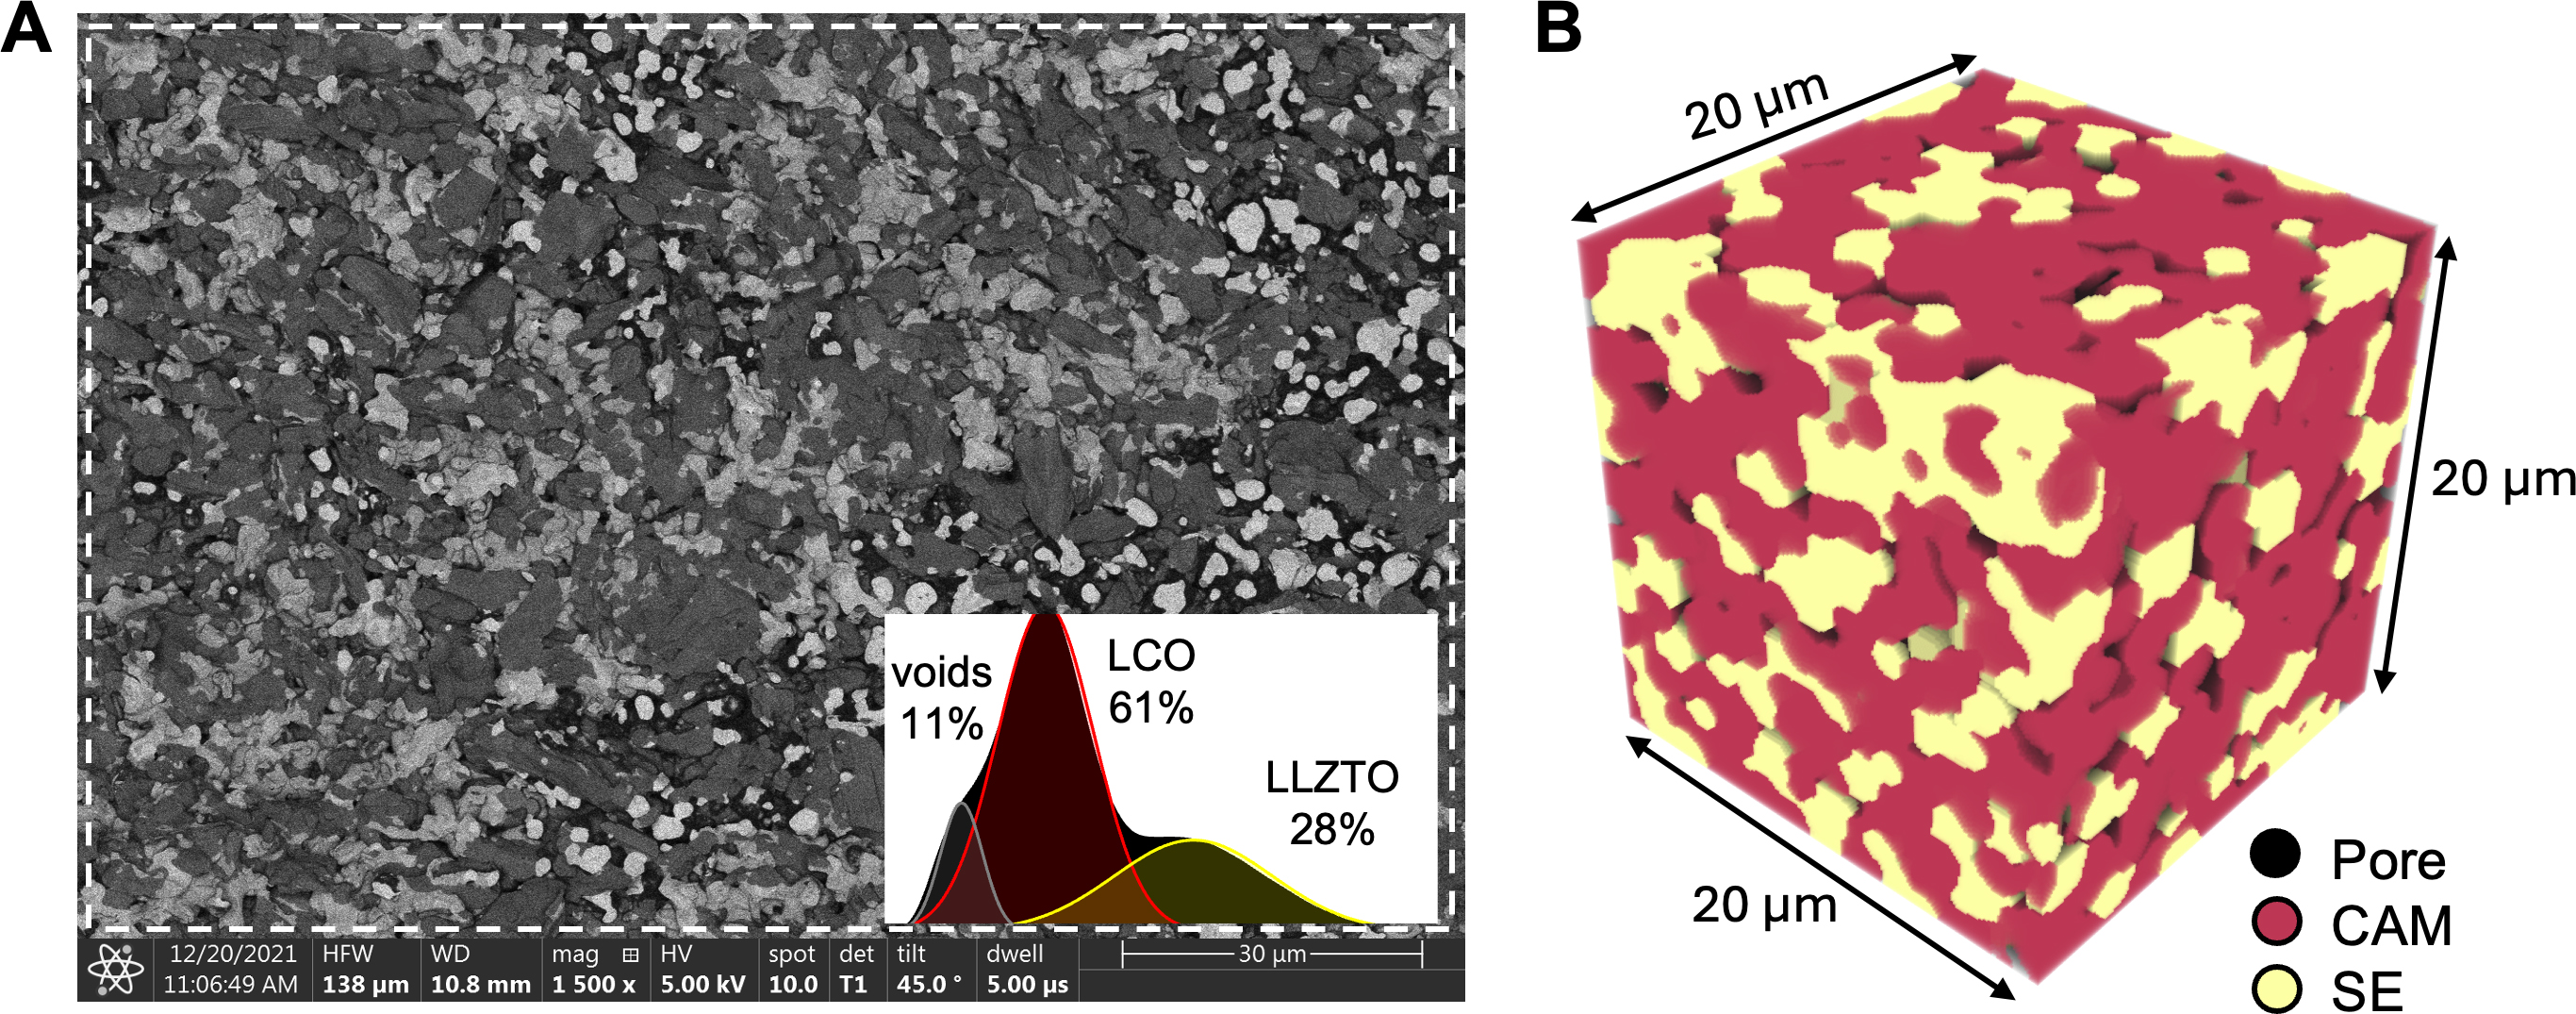
Figure 3. (A) Backscattered SEM cross-section of a co-sintered 75 wt%/25 wt% LCO-LLZTO composite. Inset: the phase fraction is estimated to be around 61% LCO, 28% LLZTO, and 11% porosity based on the grayscale histogram of the selected rectangular region outlined in dashed white. The black, dark gray, and light gray regions correspond to voids, LCO and LLZTO, respectively; (B) A representative example of microstructure generated stochastically from spherical particles. The transparent, red, and yellow domains correspond to pores, CAM, and SE phases, respectively. SEM: Scanning electron microscopy; LCO-LLZTO: LiCoO2-Li6.4La3Zr1.4Ta0.6O12; CAM: cathode active material; SE: solid electrolyte.
Inspired by the experimental microstructure, we constructed 3D virtual microstructures to qualitatively represent and capture the composite cathode microstructure using the stochastic approach described in Figure 2. An example microstructure is shown in Figure 3B wherein the CAM phase is colored in red, the SE phase in yellow, and the pores are left transparent. Pores near the SE-CAM interface and CAM grain boundaries are observed, consistent with the experimental observation. The volume fractions of the three phases (64.3% CAM, 23.1% SE, and 12.5% porosity) compare well with the experimental measurements. However, the pores in the 3D microstructure appear more dispersed compared to the localized voids seen in the SEM cross-sections. In general, the virtual microstructure successfully captures the particulate morphology of the composite microstructure observed in the SEM image.
Instead of a direct, one-to-one comparison between the experimental and simulated microstructures, our focus is on exploring how variations in phase fractions and porosity influence the geometric and physical properties of the 3D microstructures. Therefore, a few representative microstructures with different phase fractions and porosities are shown in Figure 4. Figure 4A represents a highly porous microstructure with comparable fractions of CAM and SE phases. The particle size of the SE phase is also set to be larger than that of the CAM phase, resulting in a dispersed distribution of CAM particles, which may restrict the electronic conduction. Figure 4B shows a more ideal dense structure with a dominant CAM phase and comparable particle sizes. The resulting Deff and As are expected to be higher than the structure in Figure 4A. With a slight increase in targeted porosity compared to Figure 4B, Figure 4C illustrates a more realistic structure with a moderate amount of pore phase while maintaining an approximate 3:1 ratio between CAM and SE phases. It is expected that the Deff and As in Figure 4C should fall between those in Figure 4A and B.
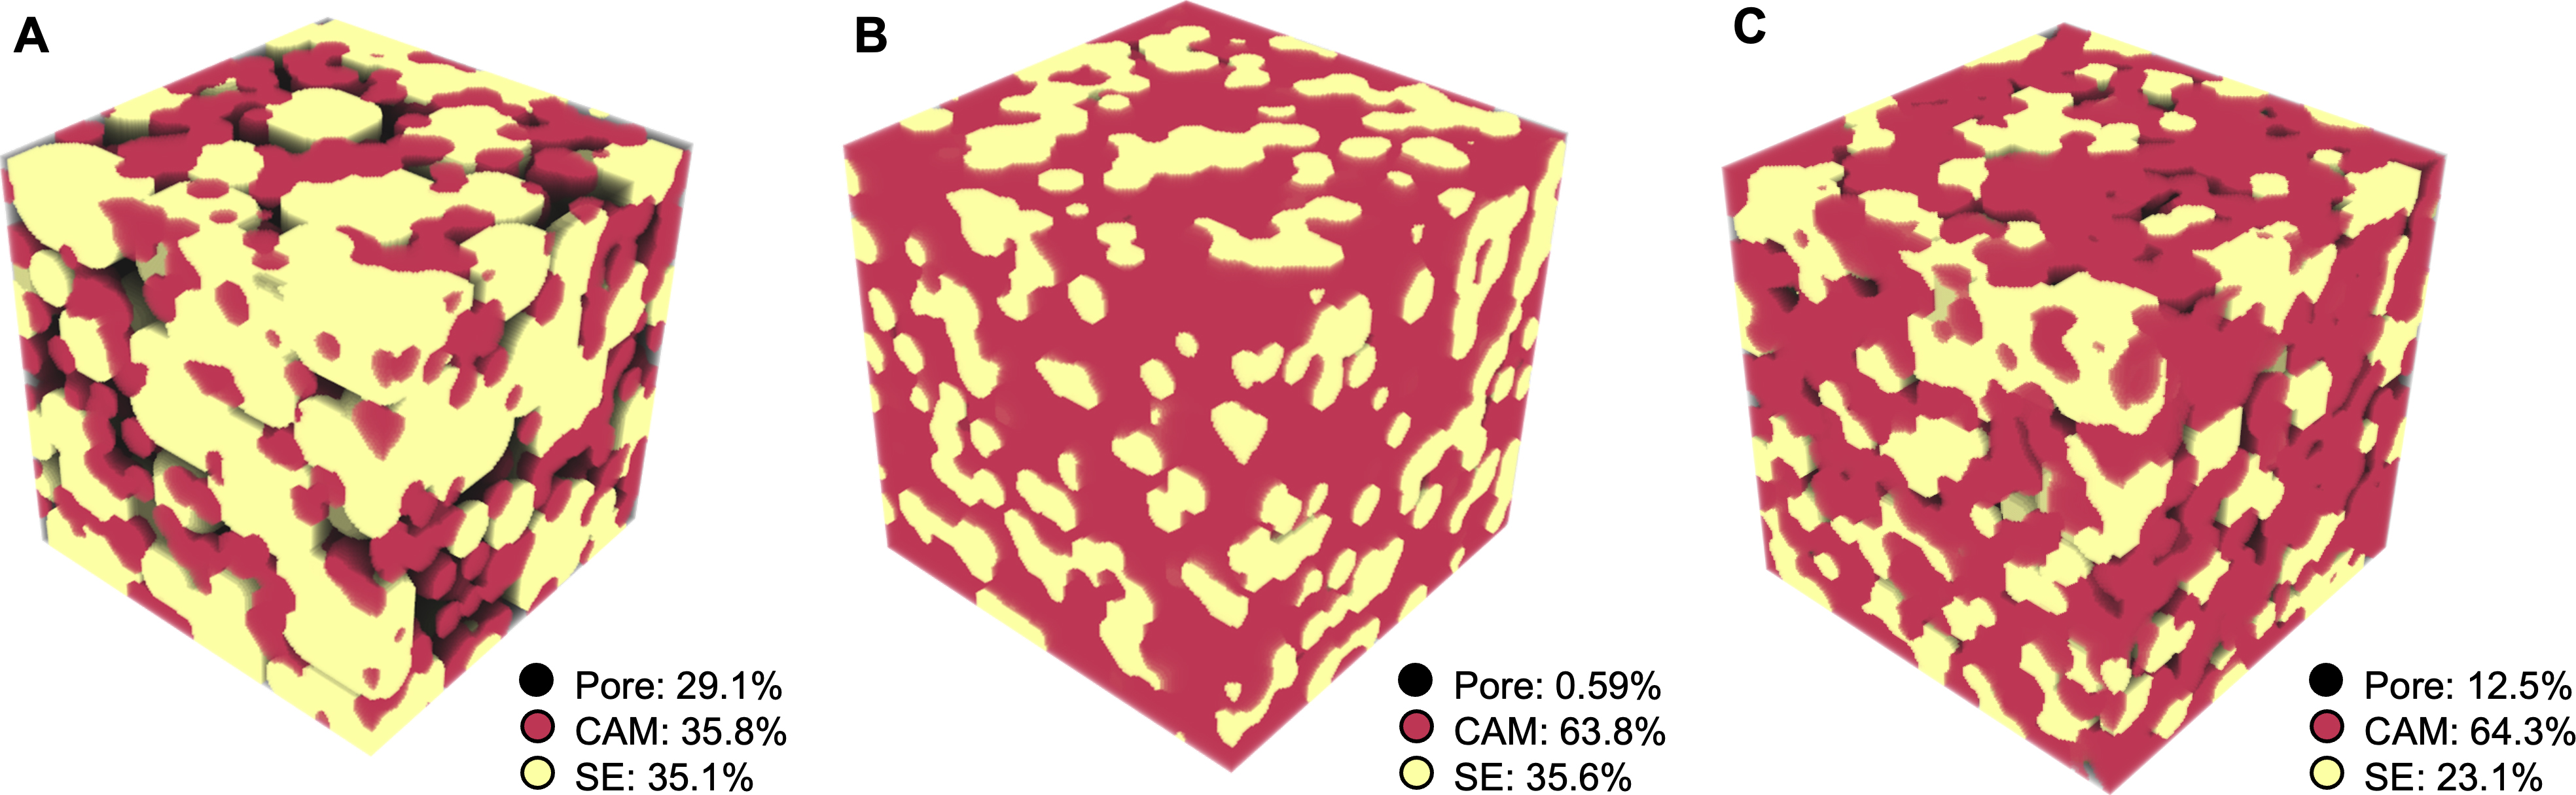
Figure 4. Representative 3D microstructures within the 250 dataset with phase fractions labeled. (A) A nonideal microstructure where the SE phase fraction is too low and the particles of both phases are isolated; (B) An ideal highly dense microstructure close to the predicted SE percolation threshold; (C) A microstructure with phase fractions and porosity closest to the experiments. SE: Solid electrolyte; CAM: cathode active material.
Numerical simulation
To understand the impact of phase fractions on the geometric and physical properties of the composite microstructures, we present the results of effective diffusivity (Deff), reciprocal of the tortuosity factors (1/τ2), and specific interface area (As) as functions of the phase fractions of CAM, SE, and pores, represented by ternary diagrams in Figure 5. The original data are plotted as dots without interpolation. Each data point is colored according to its hue value, as indicated by the associated color scheme. In total, 258 data points are shown for each plot.
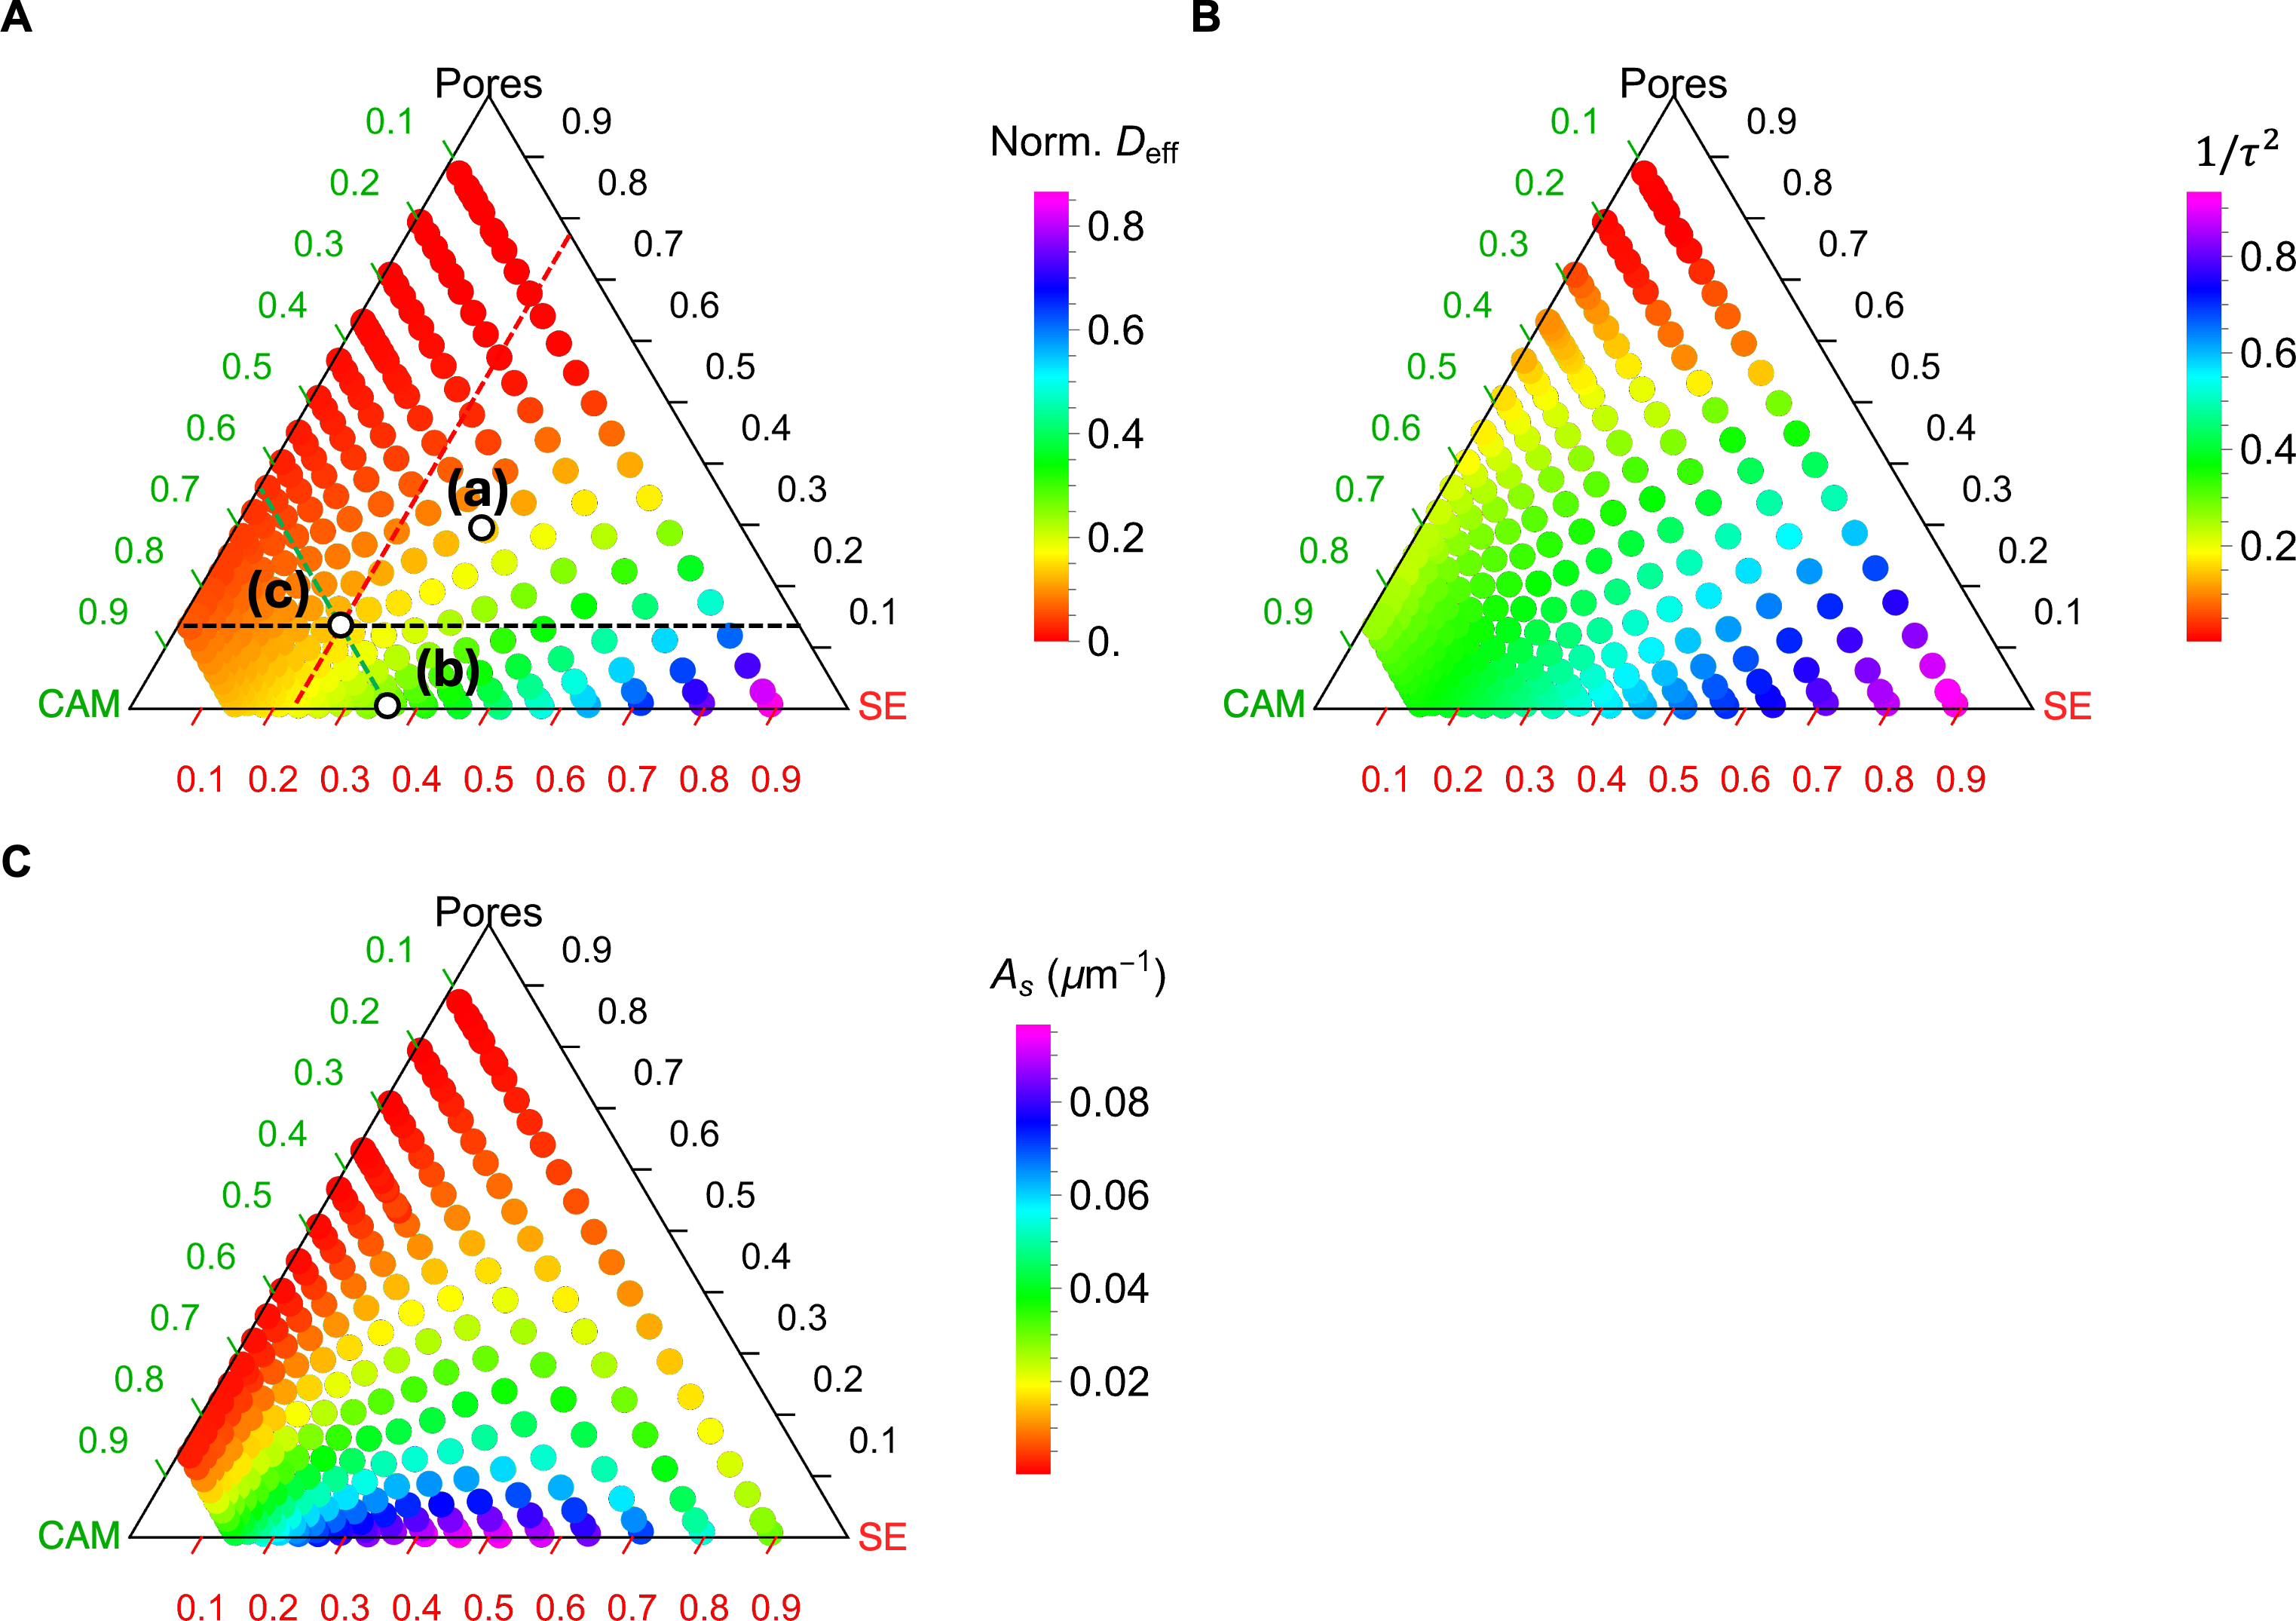
Figure 5. Ternary diagrams of (A) effective diffusivity (Deff), (B) reciprocal of tortuosity factor (1/τ2), and (C) specific interface area
Figure 5A shows that Deff is highest near the SE apex due to the higher diffusivity of the SE versus the CAM. Reducing the SE fraction or increasing the porosity leads to a decrease in Deff, with porosity having a more significant influence. For instance, at 50% porosity, Deff drops almost to zero, whereas a finite Deff remains even near the CAM end. For 1/τ2, which is derived from Deff and density (see Equation 5), its trend generally aligns with that of Deff, albeit with slight differences toward the CAM apex. Specifically, while Deff drops below 0.2 near the CAM apex, the reciprocal of the τ2 decreases more gradually, reaching only half its value at the CAM apex.
In contrast, As exhibits a distinct trend in the ternary diagram compared to the other two quantities [Figure 5C]. First, the diagram is almost symmetric with respect to the phase fractions between SE and CAM because As is a geometric factor independent of the relative magnitude of diffusivities. Second, the maximum As is observed at a 50%:50% intermixing of SE and CAM with zero porosity. If porosity increases slightly, As drops sharply. This finding is consistent with previous studies on two-phase mixtures with similar particle sizes[13].
Comparison of Figure 5A-C reveals clear differences and correlations in how composition affects Deff, τ2, and As. Geometric factors of the 3D microstructure (τ2 and As) provide valuable insights into structural arrangement but cannot fully capture the physics-derived effective property (Deff). For instance, while Deff approaches negligibly small values near the CAM apex, the tortuosity factor (τ2) remains at an intermediate value. This behavior is understandable because the CAM is assumed to be a Li-ion conductor in our study. As a result, the CAM phase contributes geometrically to tortuosity, even though its diffusivity is limited. This distinction underscores the need for flux-based simulations rather than relying solely on geometric descriptors such as τ2 and As, as these simulations directly incorporate the interplay between physical ion transport and the microstructural connectivity.
Moreover, Figure 5 highlights a tradeoff in optimizing the phase compositions of composite cathodes to balance ion transport and interfacial reaction kinetics. While increasing SE volume fraction leads to enhanced mass transport, intermixing of SE and CAM with a similar phase fraction is essential for sufficient interfacial reactions. Therefore, it is of critical importance to integrate both geometric and transport-based considerations in the design process of composite cathodes. In reality, increasing the SE often improves both the mass transport and intermixing, since the phase fraction of SE is almost never above 50% because the fraction of active material is important for energy density.
Analytical models
To construct a surrogate analytical model of Deff, we employed a modified GEMT tailored for three-phase composites with percolation effects between each two components. This formulation combines two EMT models, each representing one of the binary subsystems, as detailed in the Methods section. By solving Equations (6) and (7), we obtain an analytical expression of Deff(ρ, ϵs,SE) as a function of the total density ρ and the solid-state volume fraction of SE ϵs,SE.
The analytical model is governed by four fitting parameters: the two percolation thresholds (ρc and ρ’c) and the percolation slopes (t and t’), corresponding to the respective EMT formulations. These parameters were determined by nonlinear regression using a least-squares objective function to fit the simulated
The regression analysis yields fitting parameters ρc = 0.38 and t = 1.8 and ρc’ = 0.33 and t’ = 0.89. These values define the percolation thresholds between the pore-solid phases and the SE-CAM solid phases, respectively. According to classical percolation theory, the effective conduction coefficient (Deff in our case) scales as
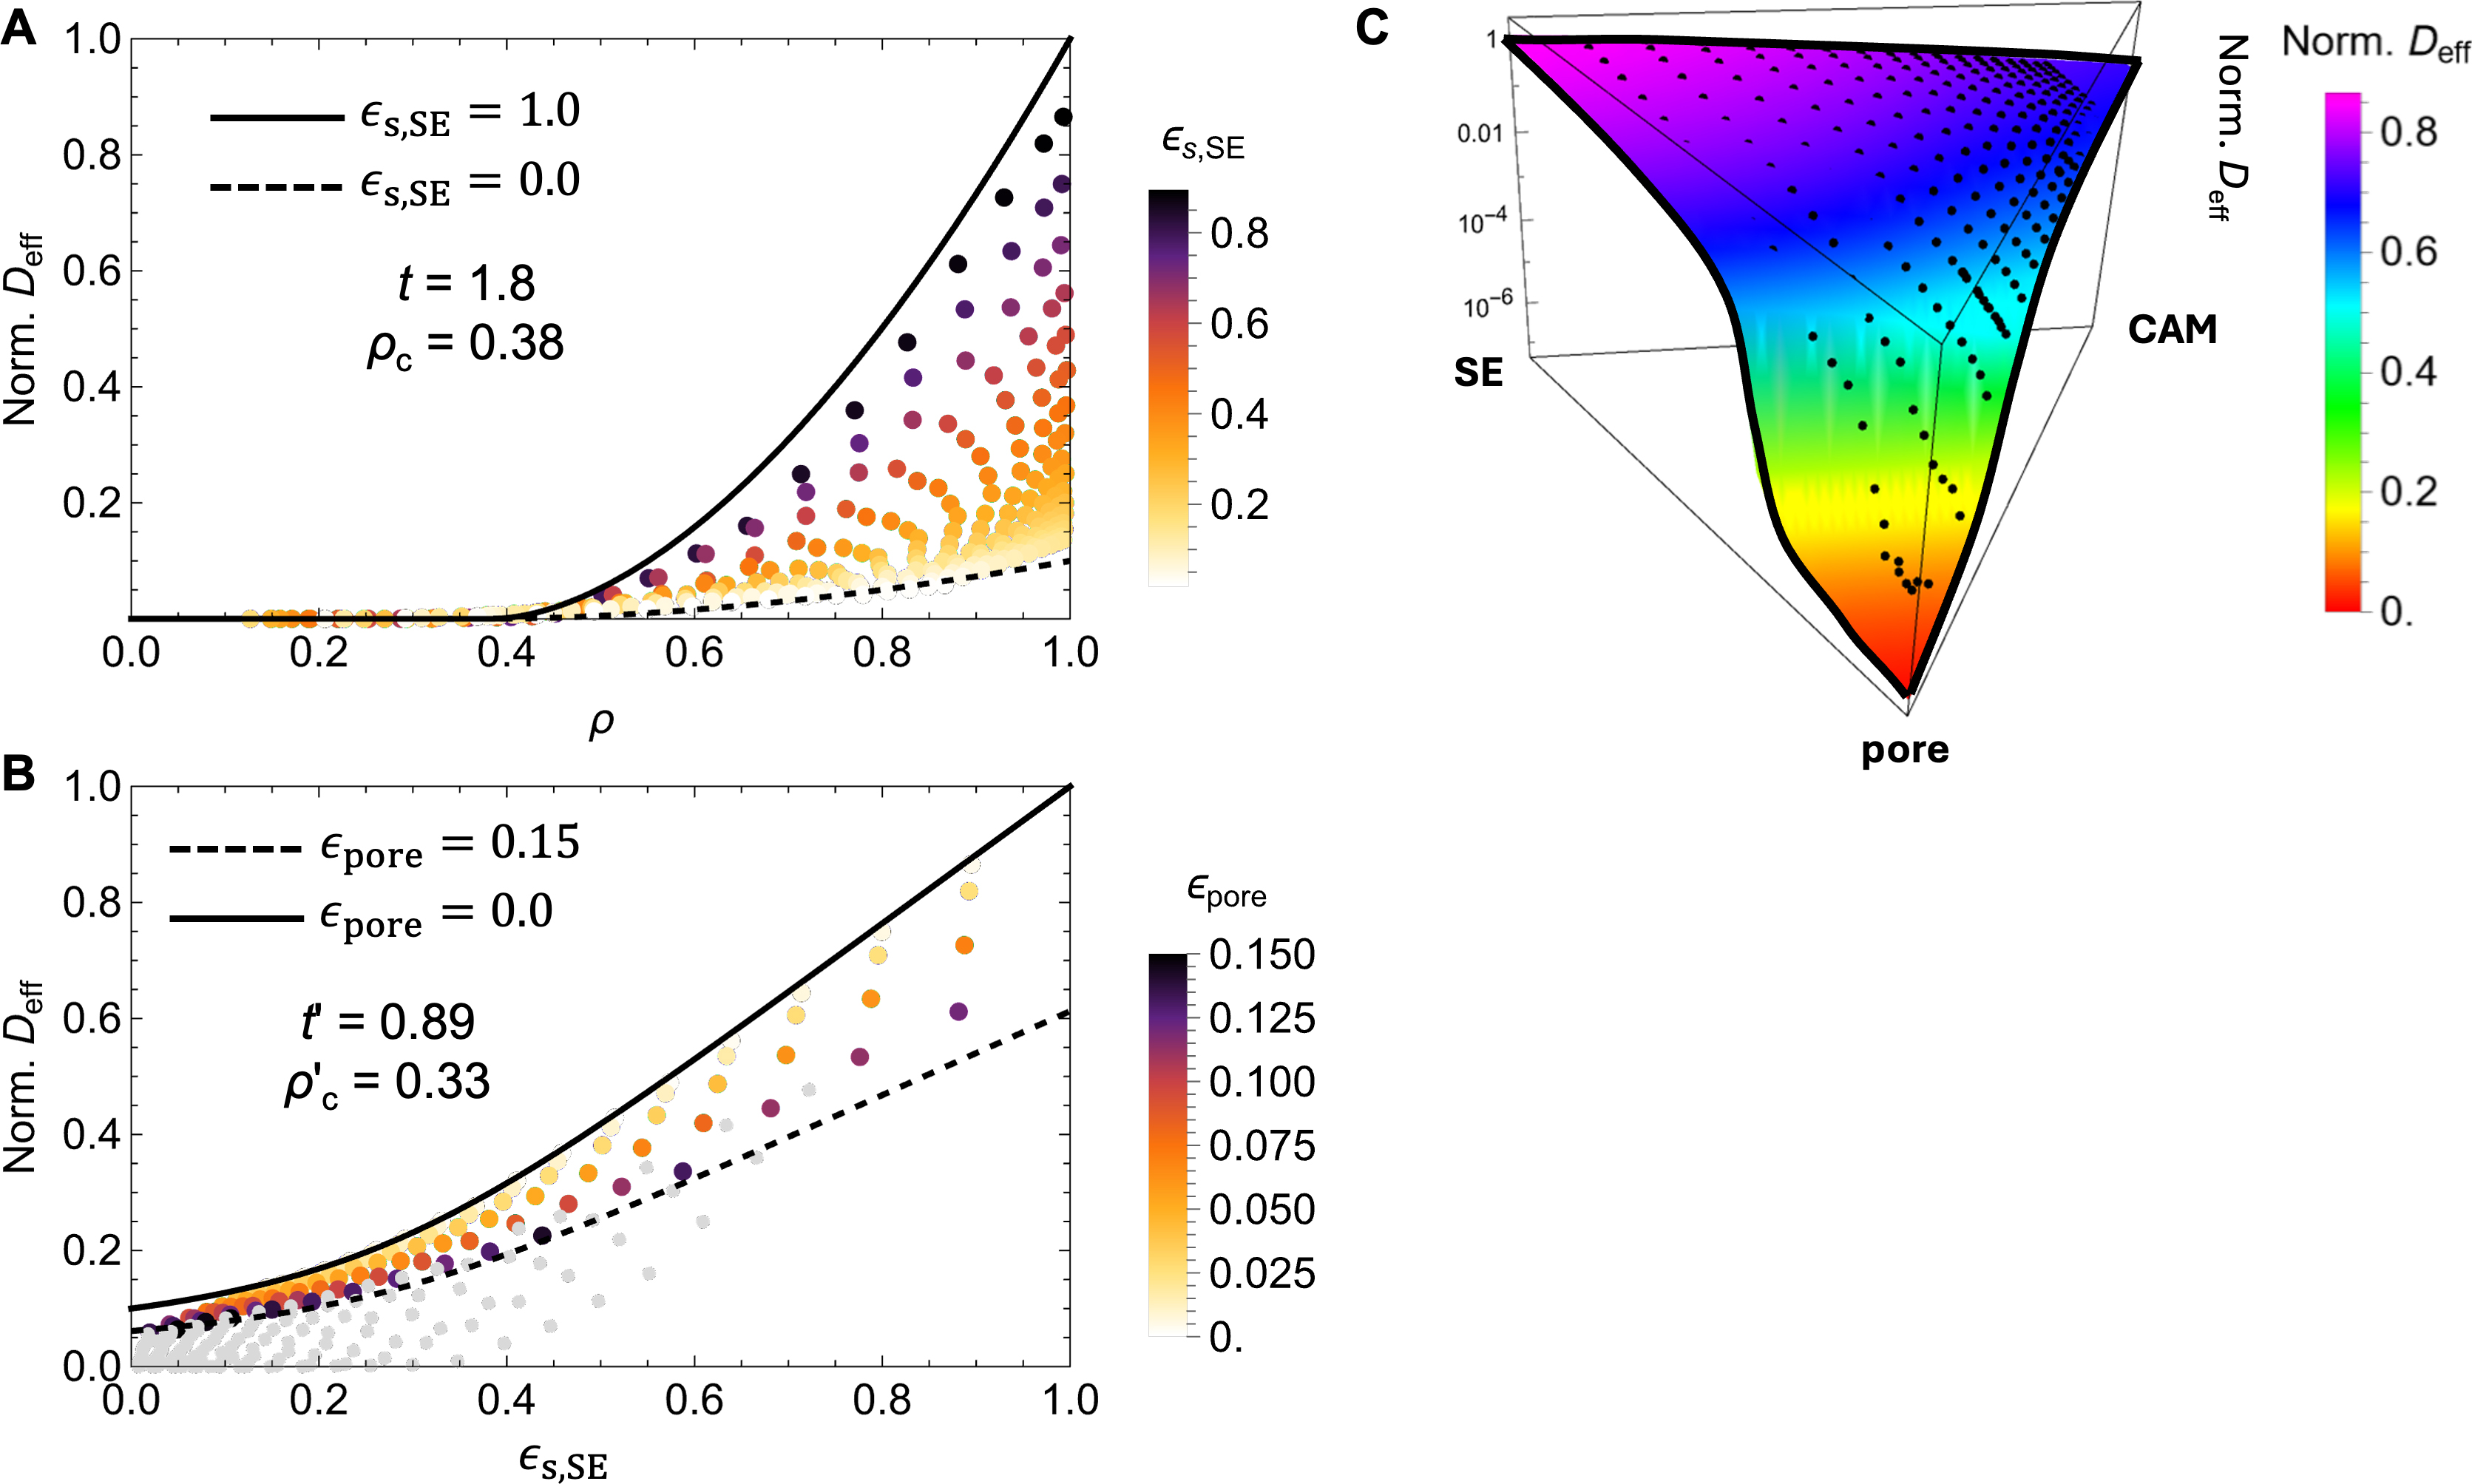
Figure 6. Data fitting using the GEMT model of Deff as a function of (A) the density ρ and (B) the solid phase volume fraction ϵs,SE; (C) A perspective view of the simulation data points and the functional surface by the analytical model over the ternary composition domain. GEMT: Generalized effective medium theory; SE: solid electrolyte.
To visualize the model fit and dissect the contributions of different percolation mechanisms, we projected the simulation results along two axes, as shown in Figure 6A and B. In Figure 6A, Deff is plotted against the total density ρ. The model predictions accurately bound the simulation data between the theoretical upper and lower limits, corresponding to single-phase SE (ϵs,SE = 100%) or CAM (ϵs,CAM = 0%), respectively. A sharp transition point near ρ = 0.4 is seen, in good agreement with the fitted predicted threshold ρc = 0.38. This result suggests that a minimum density of approximately 62% is required for percolation in the solid matrix.
In Figure 6B, the same dataset is reprojected along the ϵs,SE axis to isolate the transport transition between SE and CAM phases. Here, we highlight data corresponding to porosities in the range of 0%-15% and render higher-porosity samples in gray, as such structures are less likely to exhibit continuous transport pathways and are less relevant to dense cathode architectures. In fact, experimental studies on composite cathodes (e.g., LCO-Li6PS5Cl) report porosities of 20%-30% in uncalendered form, which can be reduced to 13% through mechanical pressing, and further down to 6%-8% via cold pressing[14]. The analytical model accurately captures the variation of Deff within the low porosity regime, including a crossover from
Comparison with theoretical limits from 3D continuum percolation theory suggests that our estimated thresholds are slightly elevated, while the exponents are being underestimated, with classical theory predicting ρc = 0.29 and t = 2 for for conductivity[52,53]. The deviations are attributed to factors such as the finite diffusivity of the CAM phase, permissible particle overlap, finite-size effects of the particle packing models, and numerical artifacts in the calculation of Deff. Nevertheless, the fitted model effectively captures the essential percolation behavior observed in simulations and provides a robust analytical framework for rapid evaluation of transport properties. Moreover, we found that the fitting parameters vary systematically with the assumed diffusivity ratio between SE and CAM, with the percolation threshold ranging from 0.25 to 0.33 as the contrast varies from 0.001 to 0.1. This sensitivity and its implications will be further discussed in the next section.
The active interfacial area As between the CAM and SE is a critical microstructural descriptor that governs the efficiency of lithium-ion intercalation. Maximizing this interfacial area is essential for enhancing reaction kinetics and ensuring uniform current distribution. To model the dependence of As on the phase composition, we employed an analytical expression derived from the probability density function of a Dirichlet distribution of order three. The model is expressed as
where Г(·) is the Gamma function, α1, α2, and α3 are shape parameters, and k is a scaling factor. Using nonlinear least-squares regression, we identified the best-fit parameters as α1 = 2.3, α2 = 2.2, α3 = 0.93,
Figure 7A presents the variation of As with respect to the solid-phase volume fraction of SE ϵs,SE. The model accurately reproduces the peak in the interfacial area near an equal-volume mixture of CAM and SE, corresponding to optimal CAM-SE contact. Furthermore, Figure 7B visualizes both the simulation data and analytical predictions in a ternary 3D plot, showing strong agreement across the full compositional space.
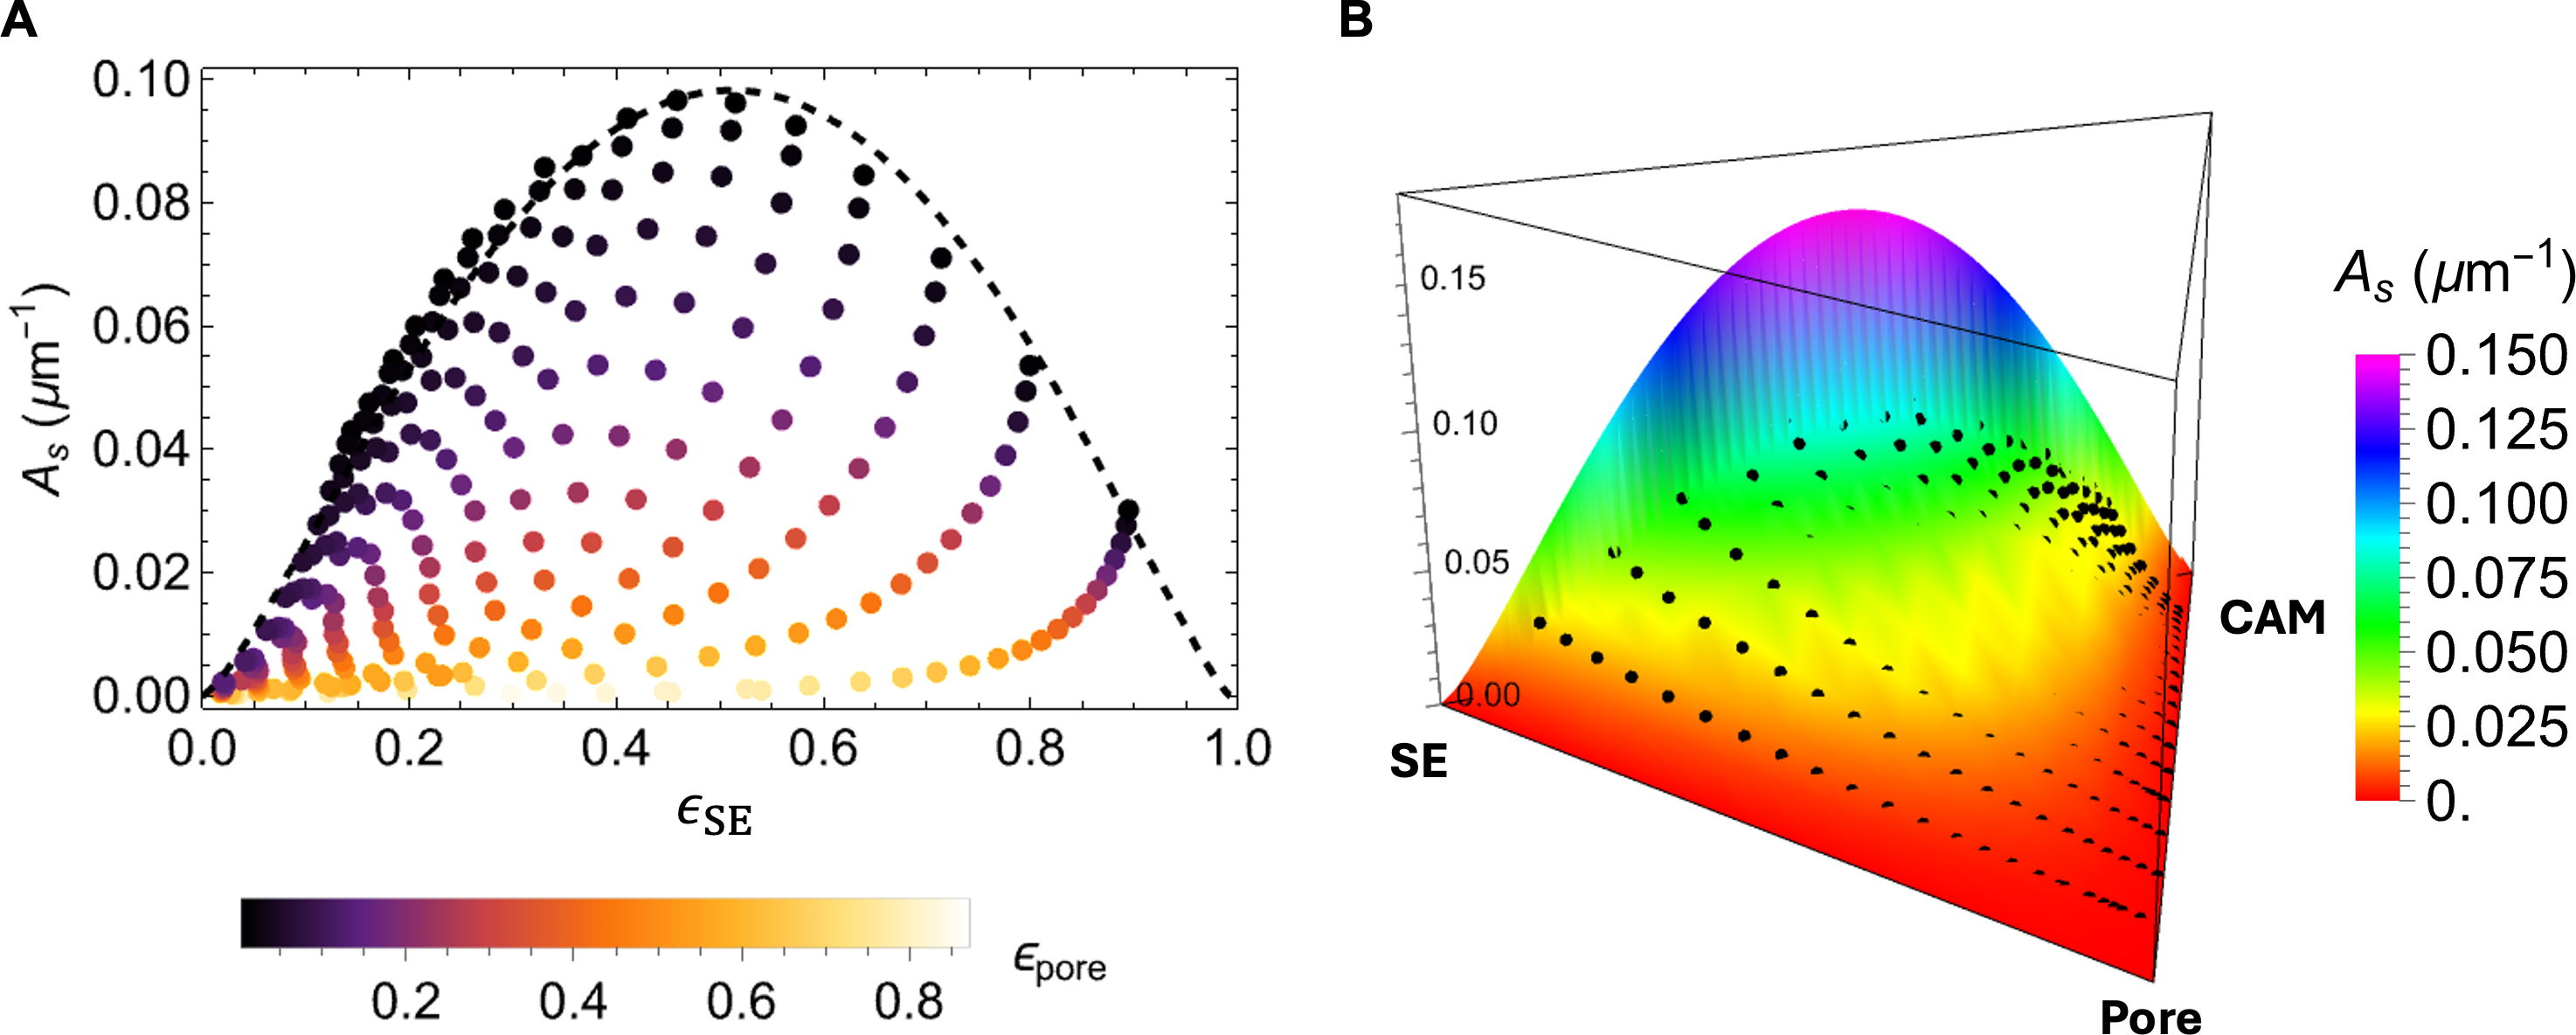
Figure 7. (A) Scatter plot of calculated specific interface area (As) as a function of the solid volume fraction of SE with an upper bound fit using the Dirichlet distribution function (black dashed curve); (B) A perspective view of the simulation data points and the functional surface by the analytical model over the ternary composition domain. SE: Solid electrolyte; CAM: cathode active material.
These findings underscore the critical role of high solid-phase packing density and low porosity in promoting interfacial contact. The presence of voids reduces the effective interfacial area, thereby limiting the number of active reaction sites and compromising electrochemical performance. The Dirichlet-based analytical model developed here provides a computationally efficient and accurate method to estimate As across arbitrary phase compositions, offering a valuable tool for microstructural optimization in solid-state battery electrode design.
Figure 8 presents the calculated Deff, 1/τ2, and As using the three parametrized analytical models in terms of the overall phase fractions and porosity. These ternary diagrams enable quick identification of corresponding values for any given combination of phase fractions and porosity, aiding in the design of composite cathodes to optimize effective diffusivity while preserving sufficient active interfaces. As an example, three points labeled (a), (b), and (c) are highlighted in Figure 8A, corresponding to the three microstructures in Figure 4A-C, respectively.
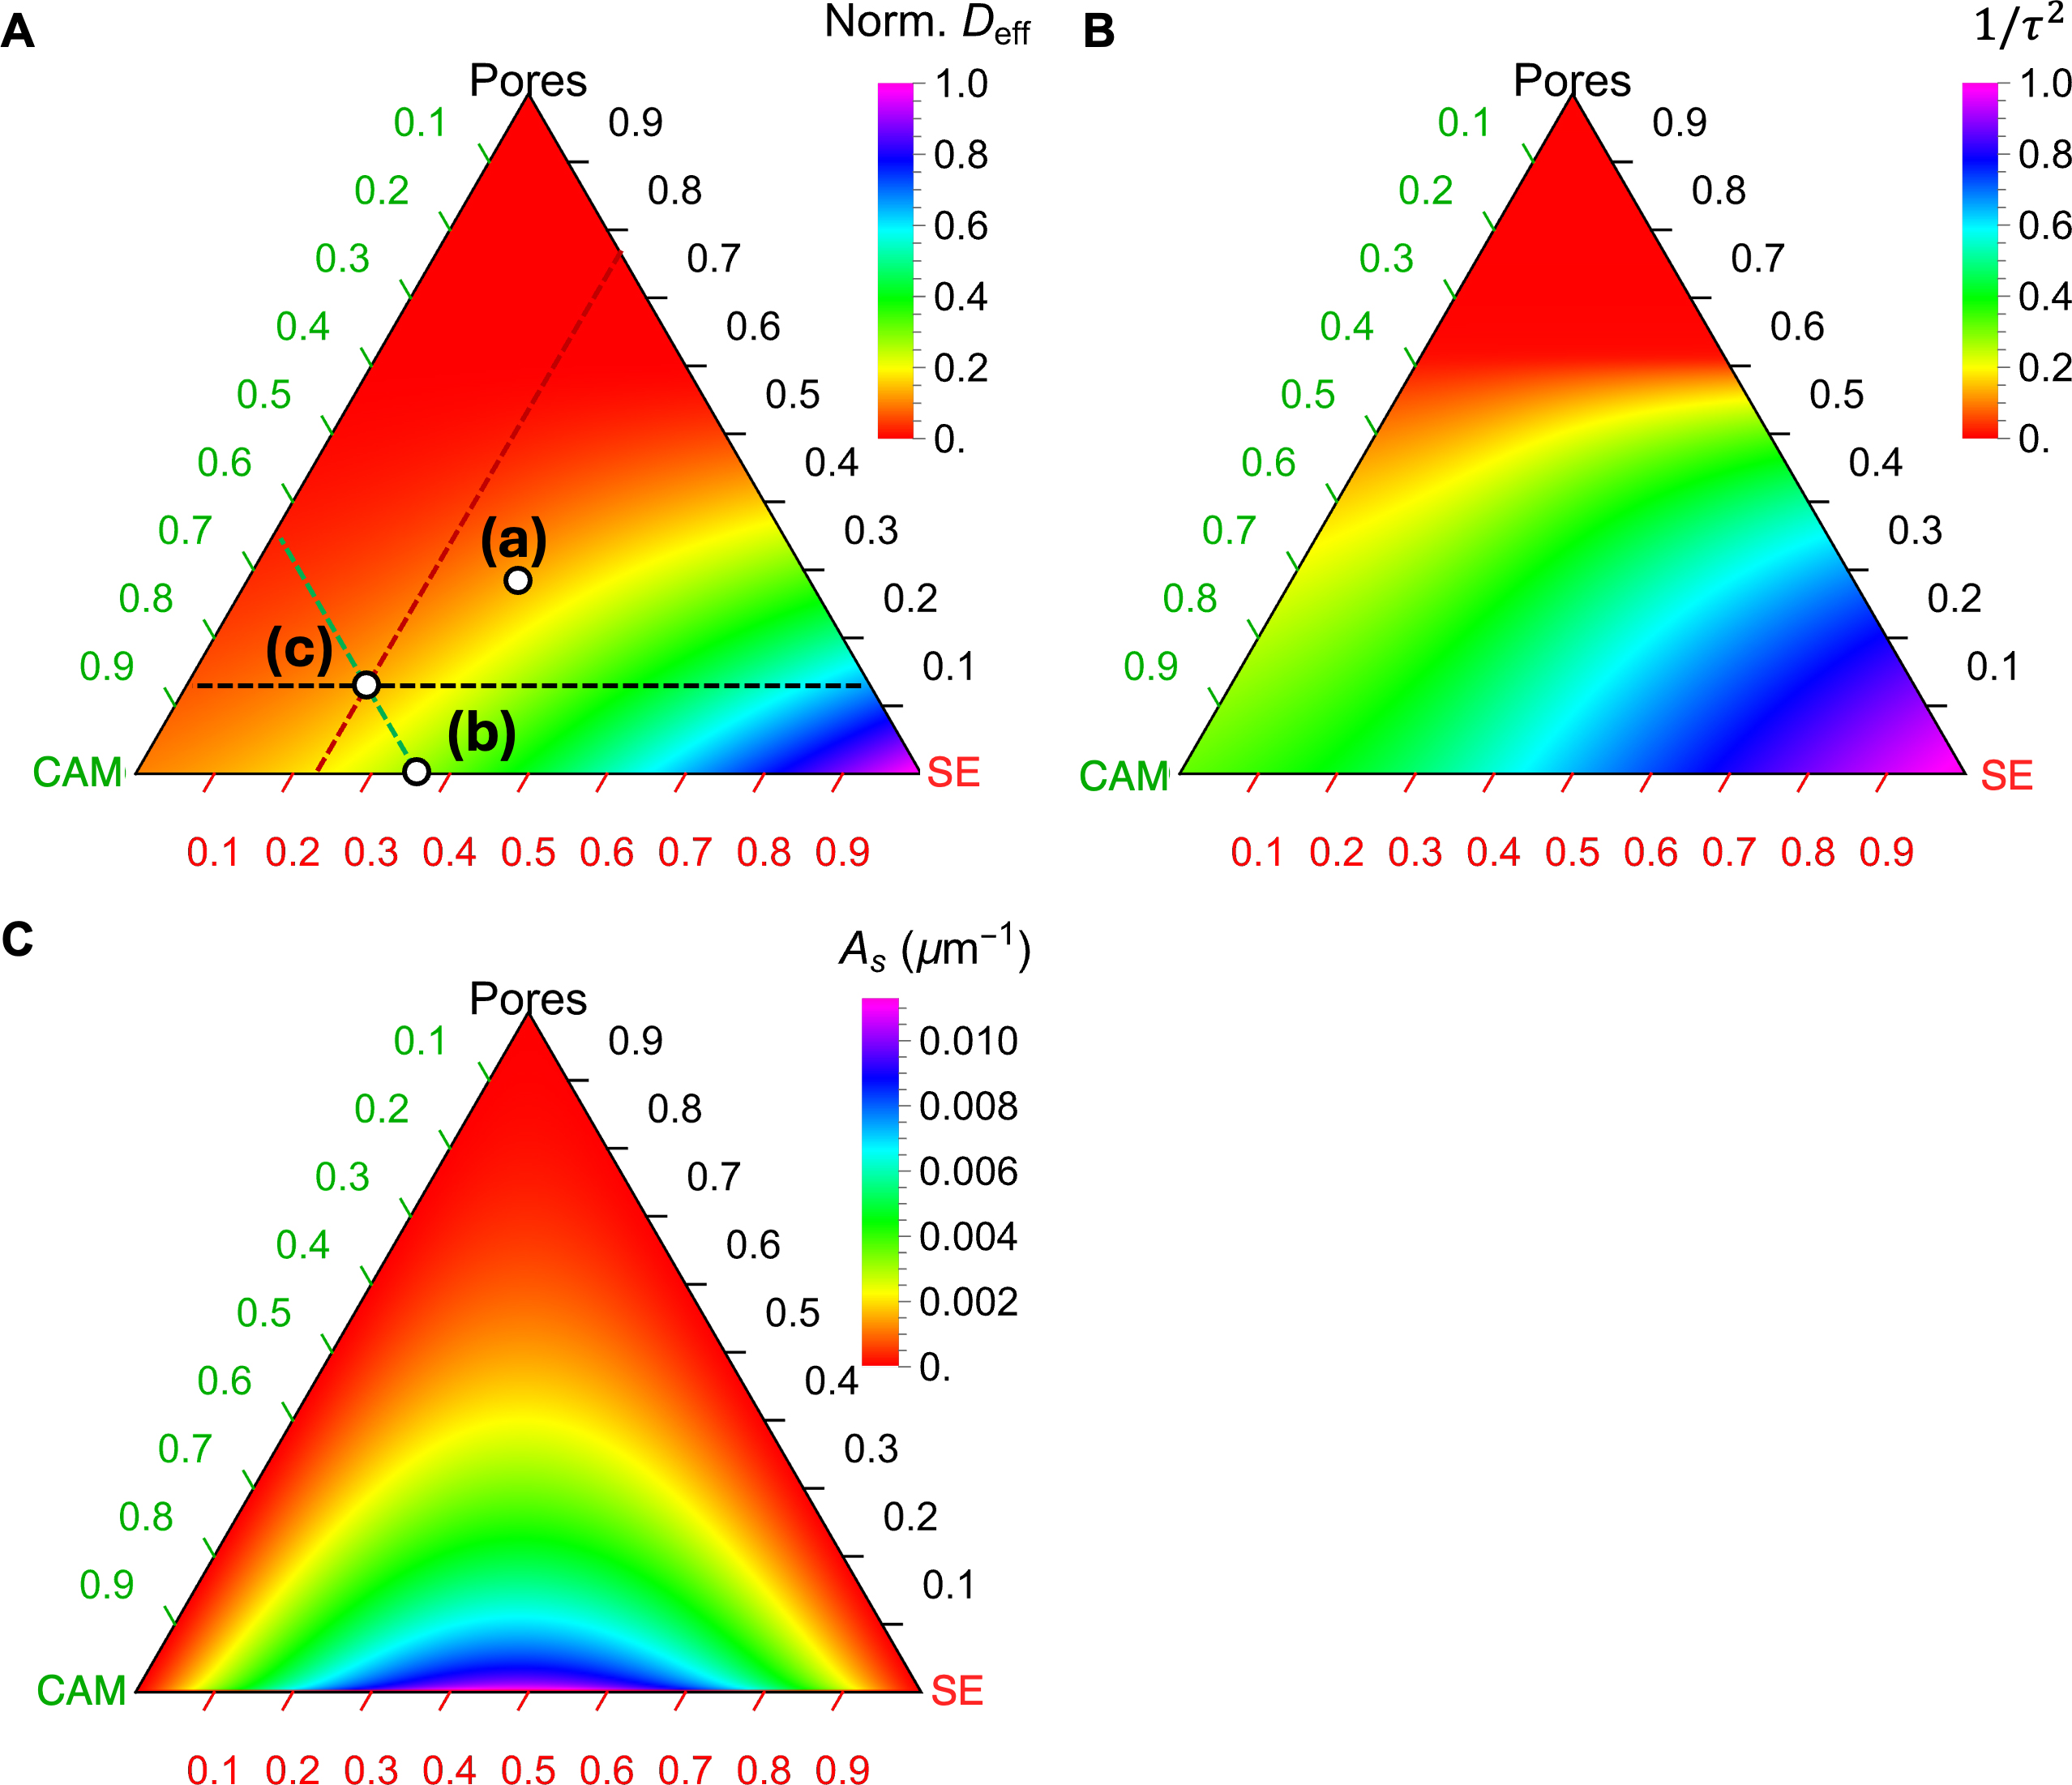
Figure 8. Ternary diagrams of (A) the effective diffusivity Deff, (B) the inverse of tortuosity factor (1/τ2), and (C) the specific interface area (As) using corresponding analytical surrogate models. The parameters for the GEMT are t’ = 0.89, t = 1.75, ρc = 0.39, ρc’ = 0.33 and the parameters for the third-order Dirichlet distribution is α1 = 2.3, α2 = 2.2, and α3 = 0.93. The labels (a), (b), and (c) in (A) correspond to the microstructures in Figure 4A-C, respectively. There are three auxiliary lines to aid in reading the phase fractions of Point (c) in (A), where the dashed green line indicates 23% CAM, the dashed black line indicates 13% porosity, and the dashed red line indicates 64% SE. SE: Solid electrolyte; CAM: cathode active material.
To determine the phase fraction for a specific point on the ternary diagram, auxiliary lines parallel to the three axes can be drawn through the point, and the values can be read directly from the respective axes. For instance, Point (c) in Figure 8A corresponds to 23.1% SE, 64.3% CAM, and 12.5% porosity. A horizontal dashed black line is drawn parallel to the axis ticks of the pore phase, yielding a value of 0.13 from the axis. Similarly, a dashed green line parallel to the CAM axis ticks gives a value of 0.23, while a dashed red line parallel to the SE axis ticks gives a value of 0.64. The corresponding Deff value can be read off from the color scheme. A similar analysis can be performed for the other points. By comparing the color schemes of the three points, it is evident that Deff follows the trend Point (b) > Point (c) ≈ Point (a), which aligns with the visual intuition from their microstructures in Figure 4. This consistency confirms the rationality of the analytical modeling results.
Similar analyses can be conducted to evaluate τ2 and As for a given phase fraction and porosity or to select optimal phase fractions that balance overall diffusivity and interfacial area at a fixed porosity. Comprehensive use of Figure 8A-C provides an efficient and effective tool for designing composite cathodes, enabling consideration of the tradeoff between bulk transport and interfacial reaction kinetics.
Factors influencing the simulation results
In the following, we discuss the differences between our results and those of prior studies regarding assumptions about ionic transport in the composite cathode, the definition of the tortuosity factor, and the general applicability of our results due to the flexibility of our model and sensitivity tests that vary the Li-ion diffusivities in the CAM.
First, in most prior studies, the CAM was typically treated as an electronic conductor and ionic insulator, while the SE was considered an ionic conductor and electronic insulator[5,6,19,31]. In contrast, our methodology assumes that both CAM and SE are conductive to lithium ions. This assumption is supported by the non-negligible diffusivities of lithium ions in many CAMs at room temperature, which facilitates effective mass transport in both the CAM and SE. This fundamental difference in assumptions has implications for the interpretation of transport properties and the estimation of related parameters such as the tortuosity factor τ2.
Second, the estimation of the tortuosity factor (τ2) in our study differs from conventional approaches. In prior work, the tortuosity factor was often calculated with non-percolating dead-end pores removed to enhance numerical stability and computational efficiency. In contrast, our approach does not exclude these components and therefore implicitly accounts for their contributions to Deff. This approach is partially justified by the suggestion to use the electrode tortuosity factor (τe2) instead of the conventional tortuosity factor (τ2) for more accurate measurement of the transport properties of porous electrodes, as dead-end pores have been shown to play a critical role[54]. Moreover, tortuosity is inherently anisotropic[32], and in our study, the tortuosity factor can be derived from the anisotropic effective diffusivity tensor Deff. However, due to the random nature of microstructure generation in our simulations, there is no strong directional preference for ionic conduction, resulting in nearly isotropic tortuosity factors. It is important to note that while tortuosity factors have been extensively studied in the context of porous electrodes and separators in lithium-ion batteries, their definition and significance in composite cathodes for ASSB remain less well understood and deserve further investigation.
Finally, we performed a sensitivity test to investigate how the diffusivity in the CAM, especially compared to the SE, affects the effective diffusivity and percolation thresholds of the overall density and fraction of SE. In our study, we set DLCO/DLLZO = 0.1 for data presented in the main text, but also performed sensitivity tests using DLCO/DLLZO = 0.01 and 0.001. For each set of data, we refit a corresponding GEMT model, as shown in Supplementary Figure 3, and extract the best-fit parameters, as listed in Table 1.
Fitted percolation thresholds and slopes from simulation data with different diffusivity ratios (DCAM/DSE)
| D CAM/DSE | D pore/DSE | t’ | t | ρ c’ | ρ c |
| 0.1 | 10-7 | 0.89 | 1.75 | 0.33 | 0.39 |
| 0.01 | 10-5 | 1.08 | 1.64 | 0.27 | 0.46 |
| 0.001 | 10-4 | 1.17 | 1.49 | 0.25 | 0.50 |
The fitting parameters show a trend: as DCAM decreases relative to DSE, the density needed to reach the percolation threshold increases, as expected. Conversely, the fraction of SE needed to reach the percolation threshold decreases from 33% to 25%, suggesting that a smaller SE fraction is sufficient to shift the diffusion behavior toward SE pathways. This observation is consistent with the underlying physics: when the CAM diffusivity is much lower than that of the SE, ions preferentially use SE percolative pathways once they form. In contrast, if the CAM diffusivity is much closer to that of the SE, the ions will use the larger volume fraction CAM pathways before switching over to the SE percolative pathways as that volume fraction increases. Plotting the data with respect to the solid-phase volume fraction of SE ϵs,SE [Supplementary Figure 4] shows that Deff exhibits different slopes before reaching the percolation threshold ρc’, depending on the CAM diffusivity. When DCAM is much lower than DSE (DCAM/DSE = 0.001), Deff rises sharply once a percolation pathway is achieved at the SE fraction above 25%. In contrast, when DCAM is only one order of magnitude lower than DSE, lithium ions can diffuse through both materials, as indicated by the non-zero slope before reaching ρc’ = 33% in the DCAM/DSE = 0.1 case. As a result, there is a non-negligible Deff before the 33% threshold. For instance, Deff = 0.25 when the SE fraction is 30%. We hypothesize that above the percolation threshold, the diffusion occurs primarily through the solid electrolyte rather than CAM. We emphasize that the percolation threshold for the SE volume fraction indicates a change in the diffusion behavior, rather than an optimal SE volume fraction for cathode design.
It should be noted that numerical artifacts based on the Fourier-spectral iterative perturbation solver appear when the contrast of material coefficients is large, as indicated in Supplementary Figure 4, where there are fluctuating data below the percolation threshold in the range of Deff < 10-4. This issue has been discussed in an analogous study of effective thermal conductivity[55]. A detailed exploration of these numerical issues is beyond the scope of the present work.
The framework of our microstructure-aware models and the GEMT is general, allowing it to be applied to specific CAM-SE systems, such as NMC-LLZO[56], as well as sulfide and halide solid electrolytes[57]. Furthermore, there is growing interest in the development of composite cathodes with gradient phase compositions[58], and we claim that the ternary diagrams and the analytical model presented in this work can serve as practical tools to accelerate the design and optimization of such systems. With the analytical models, one can quickly generate ternary diagrams with varied percolation thresholds and slopes, enabling the exploration of different transport scenarios. For instance, Supplementary Figure 5 demonstrates examples where the percolation thresholds ρc or ρc’ are doubled or halved, illustrating how changes in these parameters influence effective transport behavior. These variations, achieved through a unified analytical framework, provide a versatile tool for interpreting transport phenomena across a wide range of three-phase electrochemically active systems, such as solid-state electrolytes with pores and grain boundaries, porous electrodes and separators, and multiphase catalysts. This adaptability makes the analytical models valuable for guiding material design in diverse fields such as energy storage, chemical processing, and environmental remediation. In addition, the flexibility of our model allows us to study a variety of solid electrolytes and active materials. It can also be used to examine effective electronic conductivity based on microstructure with carbon binders/additives.
Beyond transport properties, mechanical considerations also play a critical role in ensuring the stability of composite cathodes[59]. Our microstructure-resolved approach has the potential to predict effective elastic properties and distribution of stress hotspots, which are key factors in determining the mechanical behavior for solid-state batteries. A similar approach can be applied to solid-state battery materials to address mechanical challenges in cathode design. Specifically, the mesoscale modeling framework can be extended by assigning appropriate elastic constants to each phase and solving the equilibrium equations under applied load. This enables the extraction of effective moduli using homogenization techniques, as well as the identification of local stress concentrations at CAM-SE interfaces and within CAM particles. Such a framework enables high-throughput evaluation of how microstructural features-such as phase fraction, particle shape, and pore morphology-influence both bulk stiffness and the likelihood of mechanical failure, thereby providing design guidelines for mechanically robust solid-state cathodes. This capability has been demonstrated in analogous systems such as metal hydrides encapsulated in host materials[60].
CONCLUSIONS
In this study, we established a computational framework to evaluate the effective transport properties and geometric descriptors of composite cathodes for all-solid-state batteries. By generating and analyzing over 250 distinct 3D microstructures using a stochastic method, we systematically explored the influence of phase composition and porosity on the effective diffusivity, tortuosity factor, and active interfacial area. We found the effective diffusivity and inverse of the tortuosity factor increase as the SE phase fraction increases, whereas the specific interfacial area peaks at a nearly 50%:50% phase fraction between the CAM
A major innovation of this work lies in the application of a modified GEMT to describe three-phase transport behavior in solid-state cathodes. By introducing two independent percolation thresholds and scaling exponents, the proposed GEMT framework captures complex transport transitions between porous, CAM-rich, and SE-rich domains. Additionally, we also presented a surrogate model for the specific interface area based on the third-order Dirichlet distribution, enabling rapid and accurate estimation of interfacial area across ternary compositions. The surrogate models, once trained, serve as powerful tools to instantly evaluate effective properties, thus enabling multiscale integration and accelerating inverse design workflows. In practice, these surrogate models can be embedded into continuum-scale cell simulations as replacements for simplified homogenization rules such as the Bruggeman relation[61,62]. By supplying effective transport coefficients that explicitly account for phase diffusivities, percolation thresholds, and microstructure-dependent interface areas, the surrogate models can provide a more accurate link between particle-scale features and cell-level performance, thereby enhancing predictive capability in multiscale battery modeling [Supplementary Figure 6].
In addition, the use of ternary diagrams for both visualization and modeling has proven instrumental in mapping the multidimensional relationships between microstructure and performance. These visual tools not only aid in identifying optimal compositional regimes but also support intuitive interpretation and validation of surrogate models.
Beyond the immediate context of common composite cathode materials, the computational strategies developed here are broadly applicable to other cathode chemistries with a greater discrepancy between the diffusivity in the CAM versus SE and three-phase composite systems. The framework is adaptable for quantifying and modeling properties relevant to thermal conductivity, electrical conductivity, and fluid permeability in systems such as porous ceramics, composite electrodes, and mixed-conducting membranes.
In conclusion, our work advances fundamental understanding and practical modeling of solid-state battery microstructures and expands the utility of GEMT beyond its conventional scope. By bridging high-fidelity simulations with efficient analytical modeling, we provide a scalable pathway for microstructure-informed materials design and optimization in both battery technology and broader multiphase transport problems.
DECLARATIONS
Authors’ contributions
Made substantial contributions to the conception and design of the study and performed data analysis and interpretation: Wang, B.; Adelstein, N.
Performed data acquisition: Garcia, O. K.
Provided technical and material support: Wood, M.; Heo, T. W.; Ye, J.
Provided administrative support: Wood, B. C.
Availability of data and materials
The datasets of virtual microstructures and corresponding effective diffusivities, as well as the Mathematica notebook to generate the microstructures, are available from the corresponding author upon reasonable request.
Financial support and sponsorship
This work was performed under the auspices of the U.S. Department of Energy by the Lawrence Livermore National Laboratory under Contract No. DE-AC52-07NA27344. This work was partially sponsored by the Office of Energy Efficiency and Renewable Energy, Vehicle Technologies Office, through the Battery Materials Research program, and was partially supported by the U.S. Department of Energy, Office of Science, Office of Workforce Development for Teachers and Scientists (WDTS) under the Visiting Faculty Program (VFP).
Conflicts of interest
All authors declared that there are no conflicts of interest.
Ethical approval and consent to participate
Not applicable.
Consent for publication
Not applicable.
Copyright
© The Author(s) 2026.
Supplementary Materials
REFERENCES
1. Pasta, M.; Armstrong, D.; Brown, Z. L.; et al. 2020 roadmap on solid-state batteries. J. Phys. Energy. 2020, 2, 032008.
2. Janek, J.; Zeier, W. G. A solid future for battery development. Nat. Energy. 2016, 1, BFnenergy2016141.
3. Cheng, E. J.; Duan, H.; Wang, M. J.; et al. Li-stuffed garnet solid electrolytes: current status, challenges, and perspectives for practical Li-metal batteries. Energy. Storage. Mater. 2025, 75, 103970.
4. Ren, Y.; Danner, T.; Moy, A.; et al. Oxide-based solid-state batteries: a perspective on composite cathode architecture. Adv. Energy. Mater. 2023, 13, 2201939.
5. Minnmann, P.; Strauss, F.; Bielefeld, A.; et al. Designing cathodes and cathode active materials for solid-state batteries. Adv. Energy. Mater. 2022, 12, 2201425.
6. Naik, K. G.; Vishnugopi, B. S.; Mukherjee, P. P. Kinetics or transport: whither goes the solid-state battery cathode? ACS. Appl. Mater. Interfaces. 2022, 14, 29754-65.
7. Zhao, H.; Mo, H.; Mao, P.; Ran, R.; Zhou, W.; Liao, K. Tape-casting fabrication techniques for garnet-based membranes in solid-state lithium-metal batteries: a comprehensive review. ACS. Appl. Mater. Interfaces. 2024, 16, 68772-93.
8. Ye, R.; Ihrig, M.; Figgemeier, E.; Fattakhova-rohlfing, D.; Finsterbusch, M. Aqueous Processing of LiCoO2-Li6.6La3Zr1.6Ta0.4O12 composite cathode for high-capacity solid-state lithium batteries. ACS. Sustainable. Chem. Eng. 2023, 11, 5184-94.
9. Cha, J.; Kim, S.; Nakate, U. T.; Kim, D. Highly conductive composite cathode prepared by dry process using Nafion-Li ionomer for sulfide-based all-solid-state lithium batteries. J. Power. Sources. 2024, 613, 234914.
10. Shin, D.; Nam, J. S.; Linh Nguyen, C. T.; et al. Design of densified nickel-rich layered composite cathode via the dry-film process for sulfide-based solid-state batteries. J. Mater. Chem. A. 2022, 10, 23222-31.
11. Mun, J.; Song, T.; Park, M. S.; Kim, J. H. Paving the way for next-generation all-solid-state batteries: dry electrode technology. Adv. Mater. 2025, 2506123.
12. Schumm, B.; Dupuy, A.; Lux, M.; et al. Dry battery electrode technology: from early concepts to industrial applications. Adv. Energy. Mater. 2025, 15, 2406011.
13. Hammons, J. A.; Espitia, J. A.; Ramos, E.; et al. Pore and grain chemistry during sintering of garnet-type Li6.4La3Zr1.4Ta0.6O12 solid-state electrolytes. J. Mater. Chem. A. 2022, 10-90.
14. Wood, M.; Gao, X.; Shi, R.; et al. Exploring the relationship between solvent-assisted ball milling, particle size, and sintering temperature in garnet-type solid electrolytes. J. Power. Sources. 2021, 484, 229252.
15. Zhang, W.; Weber, D. A.; Weigand, H.; et al. Interfacial processes and influence of composite cathode microstructure controlling the performance of all-solid-state lithium batteries. ACS. Appl. Mater. Interfaces. 2017, 9, 17835-45.
16. Strauss, F.; Bartsch, T.; de Biasi, L.; et al. Impact of cathode material particle size on the capacity of bulk-type all-solid-state batteries. ACS. Energy. Lett. 2018, 3, 992-6.
17. Zhou, K.; Lu, S.; Mish, C.; et al. Tailored cathode composite microstructure enables long cycle life at low pressure for all-solid-state batteries. ACS. Energy. Lett. 2025, 10, 966-74.
18. Bielefeld, A.; Weber, D. A.; Rueß, R.; Glavas, V.; Janek, J. Influence of lithium ion kinetics, particle morphology and voids on the electrochemical performance of composite cathodes for all-solid-state batteries. J. Electrochem. Soc. 2022, 169, 020539.
19. Bielefeld, A.; Weber, D. A.; Janek, J. Microstructural modeling of composite cathodes for all-solid-state batteries. J. Phys. Chem. C. 2019, 123, 1626-34.
20. Bielefeld, A.; Weber, D. A.; Janek, J. Modeling effective ionic conductivity and binder influence in composite cathodes for all-solid-state batteries. ACS. Appl. Mater. Interfaces. 2020, 12, 12821-33.
21. Park, J.; Kim, D.; Appiah, W. A.; et al. Electrode design methodology for all-solid-state batteries: 3D structural analysis and performance prediction. Energy. Storage. Mater. 2019, 19, 124-9.
22. Park, J.; Kim, K. T.; Oh, D. Y.; et al. Digital Twin-driven all-solid-state battery: unraveling the physical and electrochemical behaviors. Adv. Energy. Mater. 2020, 10, 2001563.
23. Minnmann, P.; Schubert, J.; Kremer, S.; et al. Editors’ choice-visualizing the impact of the composite cathode microstructure and porosity on solid-state battery performance. J. Electrochem. Soc. 2024, 171, 060514.
24. Minnmann, P.; Quillman, L.; Burkhardt, S.; Richter, F. H.; Janek, J. Editors’ choice-quantifying the impact of charge transport bottlenecks in composite cathodes of all-solid-state batteries. J. Electrochem. Soc. 2021, 168, 040537.
25. Schlautmann, E.; Weiß, A.; Maus, O.; et al. Impact of the solid electrolyte particle size distribution in sulfide-based solid-state battery composites. Adv. Energy. Mater. 2023, 13, 2302309.
26. Shi, T.; Tu, Q.; Tian, Y.; et al. High active material loading in all-solid-state battery electrode via particle size optimization. Adv. Energy. Mater. 2020, 10, 1902881.
27. Finsterbusch, M.; Danner, T.; Tsai, C. L.; Uhlenbruck, S.; Latz, A.; Guillon, O. High capacity garnet-based all-solid-state lithium batteries: fabrication and 3D-microstructure resolved modeling. ACS. Appl. Mater. Interfaces. 2018, 10, 22329-39.
28. Clausnitzer, M.; Mücke, R.; Al-jaljouli, F.; et al. Optimizing the composite cathode microstructure in all-solid-state batteries by structure-resolved simulations. Batteries. Supercaps. 2023, 6, e202300167.
29. Feng, L.; Wang, B.; Kim, K.; Wan, L. F.; Wood, B. C.; Heo, T. W. Machine-learning-assisted deciphering of microstructural effects on ionic transport in composite materials: a case study of Li7La3Zr2O12-LiCoO2. Energy. Storage. Mater. 2024, 73, 103776.
30. Heo, T. W.; Grieder, A.; Wang, B.; et al. Microstructural impacts on ionic conductivity of oxide solid electrolytes from a combined atomistic-mesoscale approach. npj. Comput. Mater. 2021, 7, 214.
31. Lagadec, M. F.; Zahn, R.; Müller, S.; Wood, V. Topological and network analysis of lithium ion battery components: the importance of pore space connectivity for cell operation. Energy. Environ. Sci. 2018, 11, 3194-200.
32. Ebner, M.; Chung, D.; García, R. E.; Wood, V. Tortuosity anisotropy in lithium-ion battery electrodes. Adv. Energy. Mater. 2014, 4, 1301278.
33. Hu, J. M.; Wang, B.; Ji, Y.; et al. Phase-field based multiscale modeling of heterogeneous solid electrolytes: applications to nanoporous Li3PS4. ACS. Appl. Mater. Interfaces. 2017, 9, 33341-50.
34. Ebner, M.; Wood, V. Tool for tortuosity estimation in lithium ion battery porous electrodes. J. Electrochem. Soc. 2015, 162, A3064-70.
35. Nakashima, Y.; Nakano, T. Steady-state local diffusive fluxes in porous geo-materials obtained by pore-scale simulations. Transp. Porous. Med. 2012, 93, 657-73.
36. Zahn, R.; Lagadec, M. F.; Wood, V. Transport in lithium ion batteries: reconciling impedance and structural analysis. ACS. Energy. Lett. 2017, 2, 2452-3.
37. Zhu, J.; Chen, L.; Shen, J.; Tikare, V. Computing the effective diffusivity using a spectral method. Mater. Sci. Eng. A. 2001, 311, 135-41.
38. Ashton, T. E.; Baker, P. J.; Sotelo-vazquez, C.; et al. Stoichiometrically driven disorder and local diffusion in NMC cathodes. J. Mater. Chem. A. 2021, 9, 10477-86.
39. Weiss, M.; Ruess, R.; Kasnatscheew, J.; et al. Fast charging of lithium-ion batteries: a review of materials aspects. Adv. Energy. Mater. 2021, 11, 2101126.
40. Yuan, M.; Liu, H.; Ran, F. Fast-charging cathode materials for lithium & sodium ion batteries. Mater. Today. 2023, 63, 360-79.
41. Bachman, J. C.; Muy, S.; Grimaud, A.; et al. Inorganic solid-state electrolytes for lithium batteries: mechanisms and properties governing ion conduction. Chem. Rev. 2016, 116, 140-62.
42. Grieder, A. C.; Kim, K.; Wan, L. F.; Chapman, J.; Wood, B. C.; Adelstein, N. Effects of nonequilibrium atomic structure on ionic diffusivity in LLZO: a classical and machine learning molecular dynamics study. J. Phys. Chem. C. 2024, 128, 8560-70.
43. Dive, A.; Kim, K.; Kang, S.; Wan, L. F.; Wood, B. C. First-principles evaluation of dopant impact on structural deformability and processability of Li7La3Zr2O12. Phys. Chem. Chem. Phys. 2024, 26, 13762-72.
44. Kim, K.; Adelstein, N.; Dive, A.; et al. Probing degradation at solid-state battery interfaces using machine-learning interatomic potential. Energy. Storage. Mater. 2024, 73, 103842.
45. Kozinsky, B.; Akhade, S. A.; Hirel, P.; et al. Effects of sublattice symmetry and frustration on ionic transport in garnet solid electrolytes. Phys. Rev. Lett. 2016, 116, 055901.
46. Abbas, I.; Tran, H. T.; Tran, T. T. N.; et al. GITT Limitations and EIS Insights into Kinetics of NMC622. Batteries 2025, 11, 234.
47. Jaberi, A.; Trudeau, M. L.; Song, J.; Gauvin, R. Study of lithium transport in NMC Layered oxide cathode material using multiscale computational approach. ACS. Appl. Energy. Mater. 2024, 7, 7724-36.
48. Wu, L.; Zhang, Y.; Jung, Y.; Zhang, J. Three-dimensional phase field based finite element study on Li intercalation-induced stress in polycrystalline LiCoO2. J. Power. Sources. 2015, 299, 57-65.
49. Kalnaus, S.; Sabau, A. S.; Tenhaeff, W. E.; Dudney, N. J.; Daniel, C. Design of composite polymer electrolytes for Li ion batteries based on mechanical stability criteria. J. Power. Sources. 2012, 201, 280-7.
50. Nan, C.; Smith, D. M. A.c. electrical properties of composite solid electrolytes. Mater. Sci. Eng. B. 1991, 10, 99-106.
51. Kim, K. J.; Rupp, J. L. M. All ceramic cathode composite design and manufacturing towards low interfacial resistance for garnet-based solid-state lithium batteries. Energy. Environ. Sci. 2020, 13, 4930-45.
52. Chakrabarti, B. K.; Benguigui, L. G. Statistical physics of fracture and breakdown in disordered systems. Oxford University Press, 1997.
53. Balberg, I. I. Universal percolation-threshold limits in the continuum. Phys. Rev. B. Condens. Matter. 1985, 31, 4053-5.
54. Nguyen, T.; Demortière, A.; Fleutot, B.; Delobel, B.; Delacourt, C.; Cooper, S. J. The electrode tortuosity factor: why the conventional tortuosity factor is not well suited for quantifying transport in porous Li-ion battery electrodes and what to use instead. npj. Comput. Mater. 2020, 6, 386.
55. Song, Y.; Heo, T. W. Mesoscale modeling and semi-analytical approach for the microstructure-aware effective thermal conductivity of porous polygranular materials. Comput. Mater. Sci. 2024, 235, 112808.
56. Demuth, T.; Fuchs, T.; Walther, F.; et al. Influence of the sintering temperature on LLZO-NCM cathode composites for solid-state batteries studied by transmission electron microscopy. Matter 2023, 6, 2324-39.
57. Wood, B. C.; Varley, J. B.; Kweon, K. E.; et al. Paradigms of frustration in superionic solid electrolytes. Philos. Trans. A. Math. Phys. Eng. Sci. 2021, 379, 20190467.
58. Kiyek, V.; Schwab, C.; Scheld, W. S.; et al. Direct precursor route for the fabrication of LLZO composite cathodes for solid-state batteries. Adv. Sci. 2024, 11, e2404682.
59. Yu, H.; Taha, D.; Thompson, T.; et al. Deformation and stresses in solid-state composite battery cathodes. J. Power. Sources. 2019, 440, 227116.
60. Heo, T. W.; Kang, S.; Wood, B. C. Mesoscale modeling approach for quantifying microstructure-aware micromechanical responses in metal hydrides. ACS. Appl. Energy. Mater. 2025, 8, 2103-18.
61. Tjaden, B.; Cooper, S. J.; Brett, D. J.; Kramer, D.; Shearing, P. R. On the origin and application of the Bruggeman correlation for analysing transport phenomena in electrochemical systems. Curr. Opin. Chem. Eng. 2016, 12, 44-51.
Cite This Article
How to Cite
Download Citation
Export Citation File:
Type of Import
Tips on Downloading Citation
Citation Manager File Format
Type of Import
Direct Import: When the Direct Import option is selected (the default state), a dialogue box will give you the option to Save or Open the downloaded citation data. Choosing Open will either launch your citation manager or give you a choice of applications with which to use the metadata. The Save option saves the file locally for later use.
Indirect Import: When the Indirect Import option is selected, the metadata is displayed and may be copied and pasted as needed.
About This Article
Copyright

Data & Comments
Data
0


Comments
Comments must be written in English. Spam, offensive content, impersonation, and private information will not be permitted. If any comment is reported and identified as inappropriate content by OAE staff, the comment will be removed without notice. If you have any queries or need any help, please contact us at [email protected].