


fig8
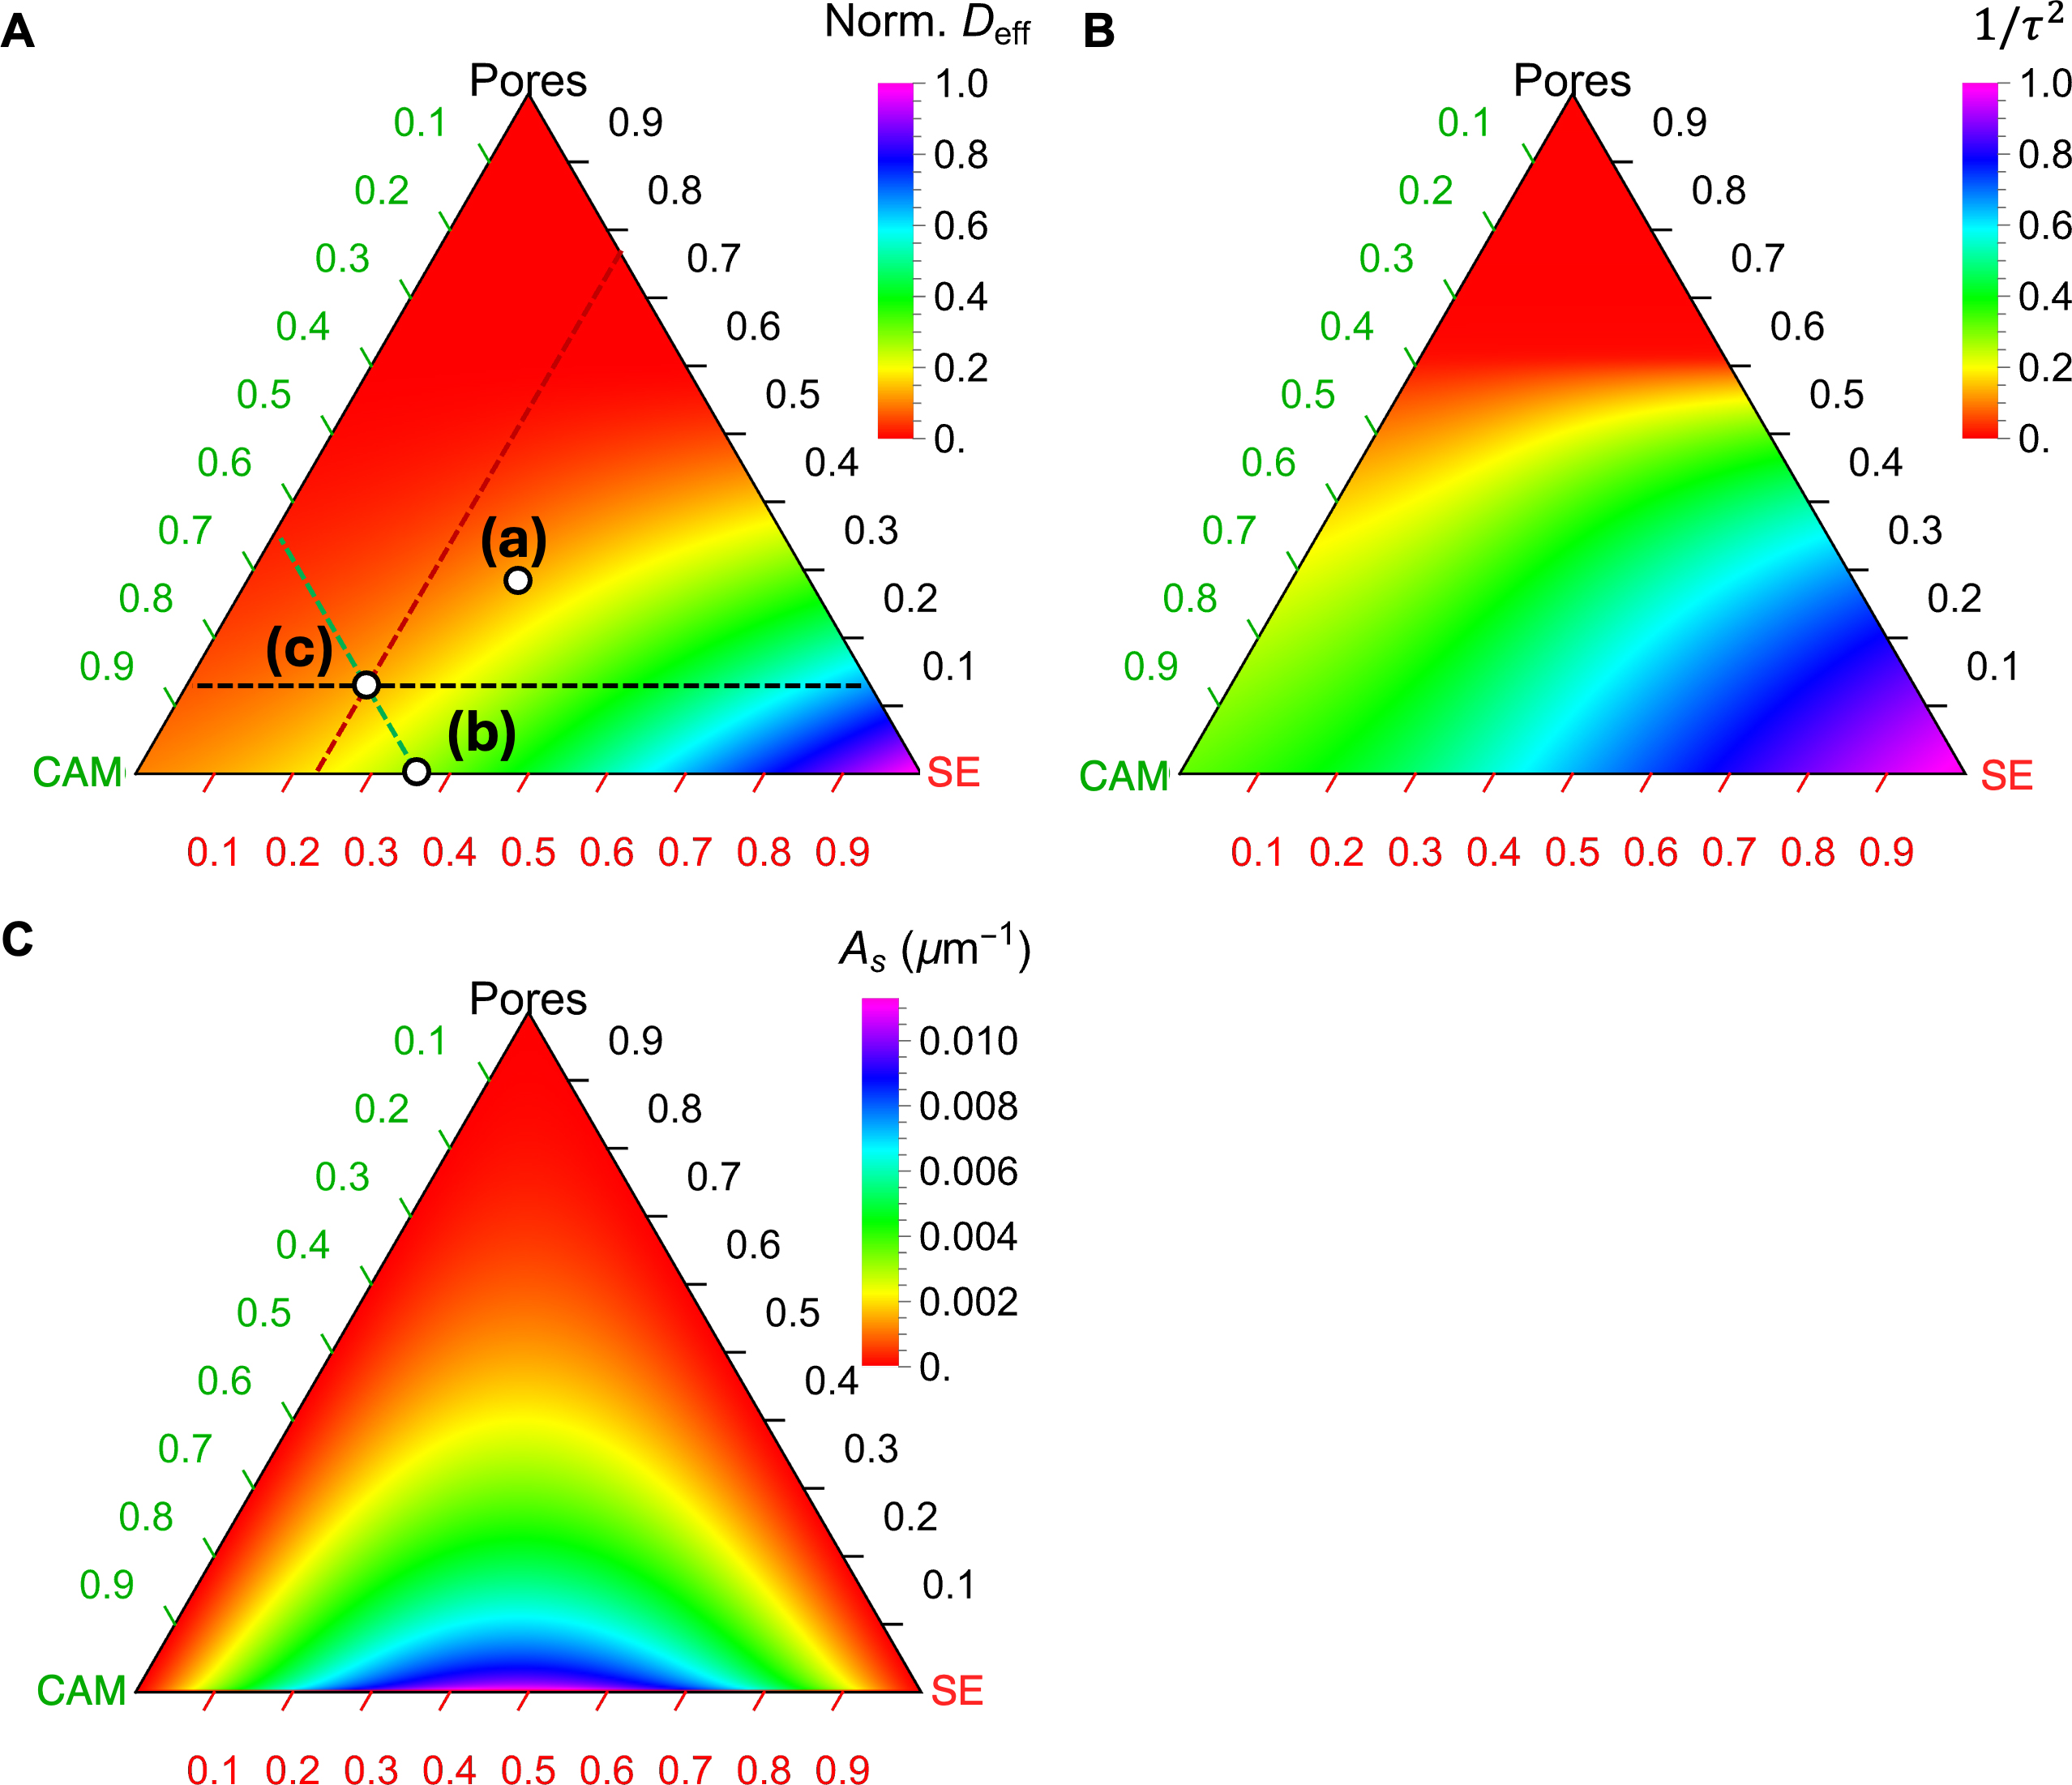
Figure 8. Ternary diagrams of (A) the effective diffusivity Deff, (B) the inverse of tortuosity factor (1/τ2), and (C) the specific interface area (As) using corresponding analytical surrogate models. The parameters for the GEMT are t’ = 0.89, t = 1.75, ρc = 0.39, ρc’ = 0.33 and the parameters for the third-order Dirichlet distribution is α1 = 2.3, α2 = 2.2, and α3 = 0.93. The labels (a), (b), and (c) in (A) correspond to the microstructures in Figure 4A-C, respectively. There are three auxiliary lines to aid in reading the phase fractions of Point (c) in (A), where the dashed green line indicates 23% CAM, the dashed black line indicates 13% porosity, and the dashed red line indicates 64% SE. SE: Solid electrolyte; CAM: cathode active material.


