


fig7
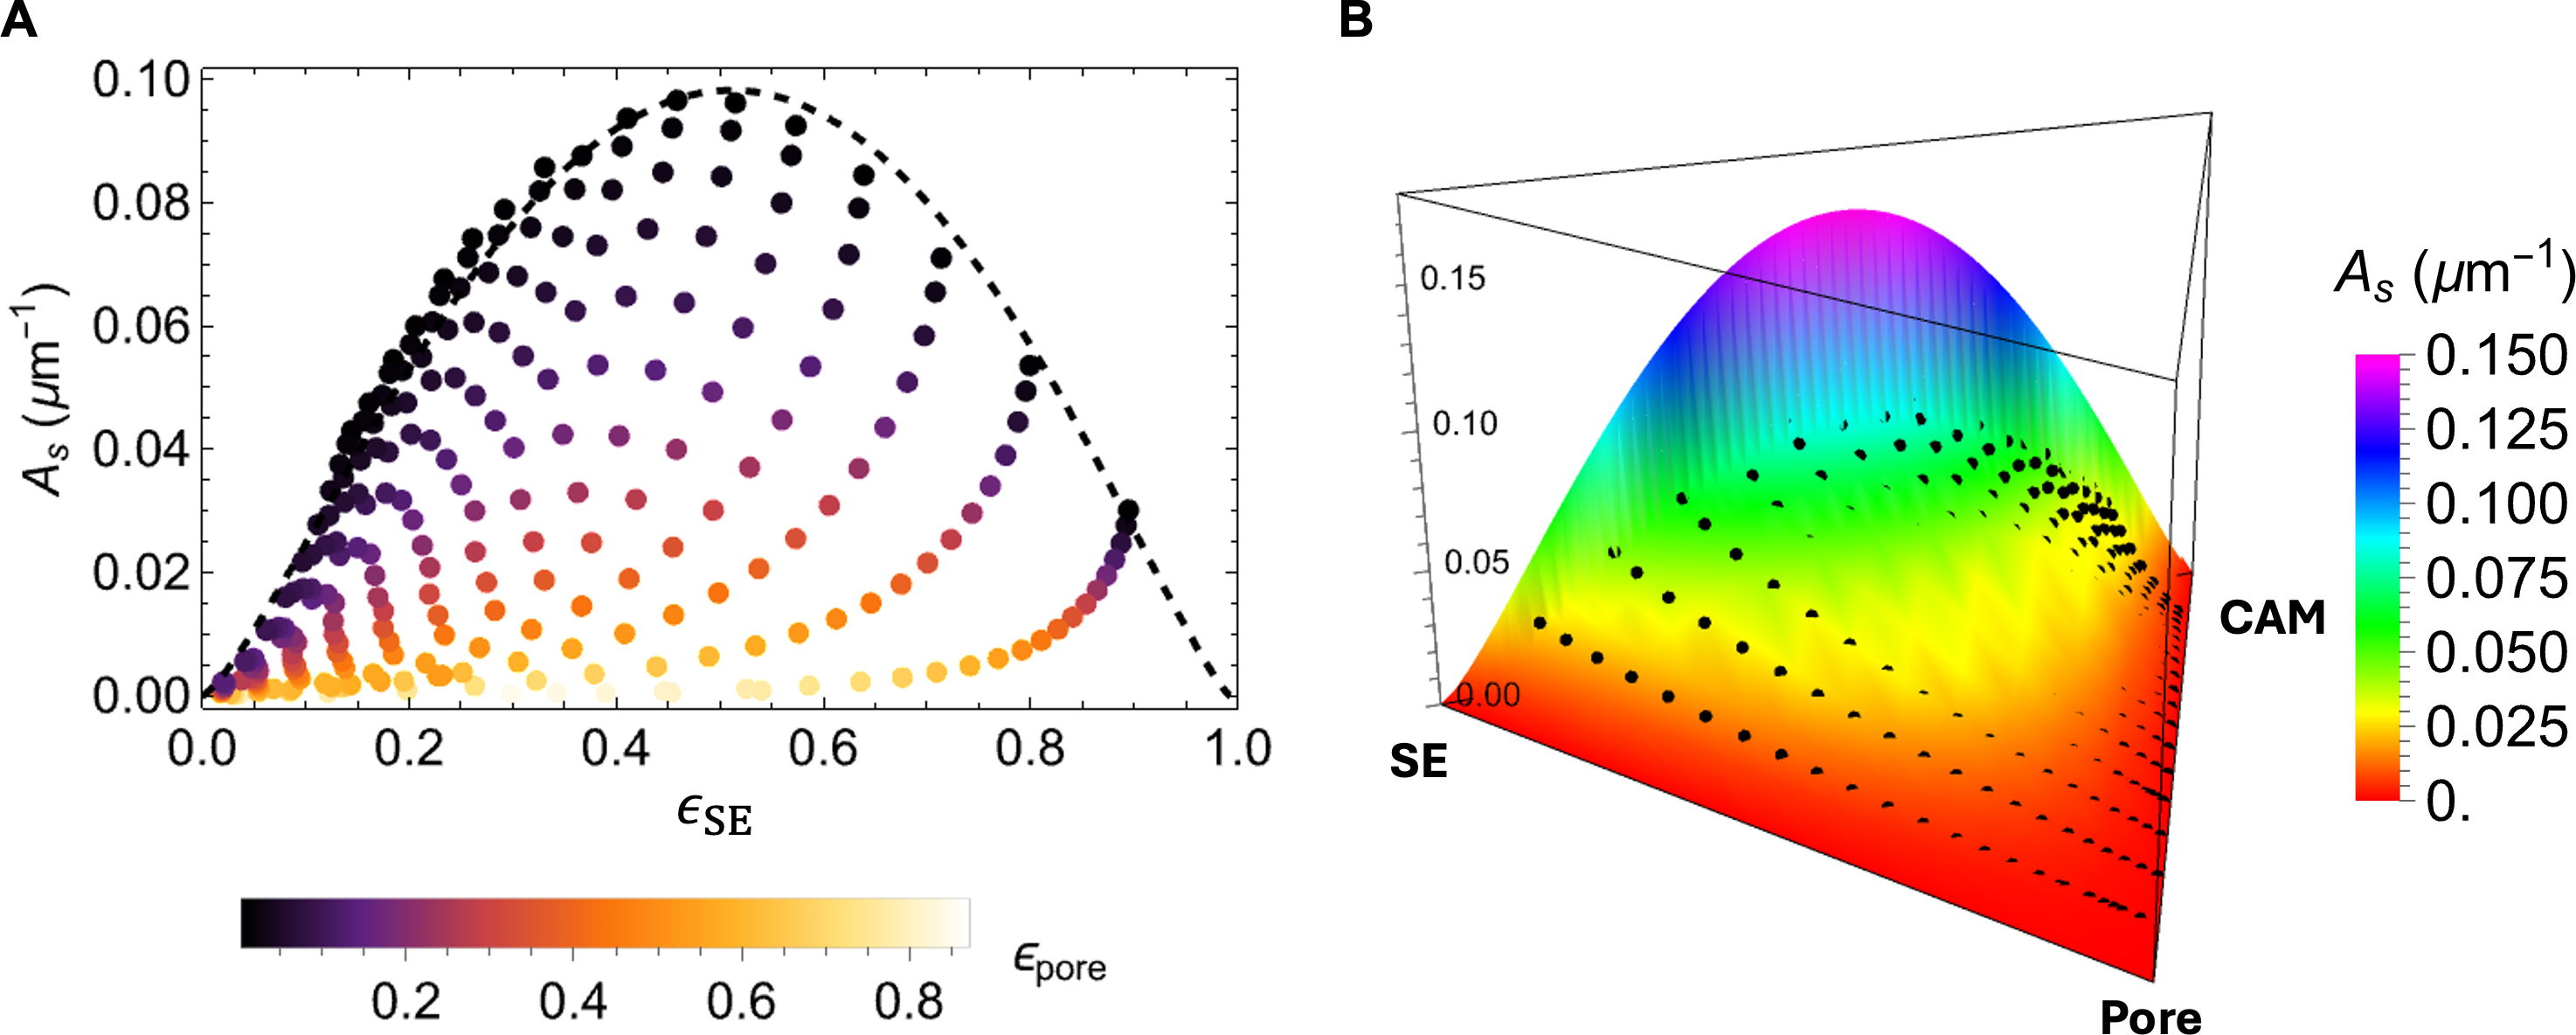
Figure 7. (A) Scatter plot of calculated specific interface area (As) as a function of the solid volume fraction of SE with an upper bound fit using the Dirichlet distribution function (black dashed curve); (B) A perspective view of the simulation data points and the functional surface by the analytical model over the ternary composition domain. SE: Solid electrolyte; CAM: cathode active material.


