


Reverse Monte Carlo modeling for catalyst nanoparticles in polymer electrolyte fuel cells by high-energy X-ray diffraction
 0
0 Abstract
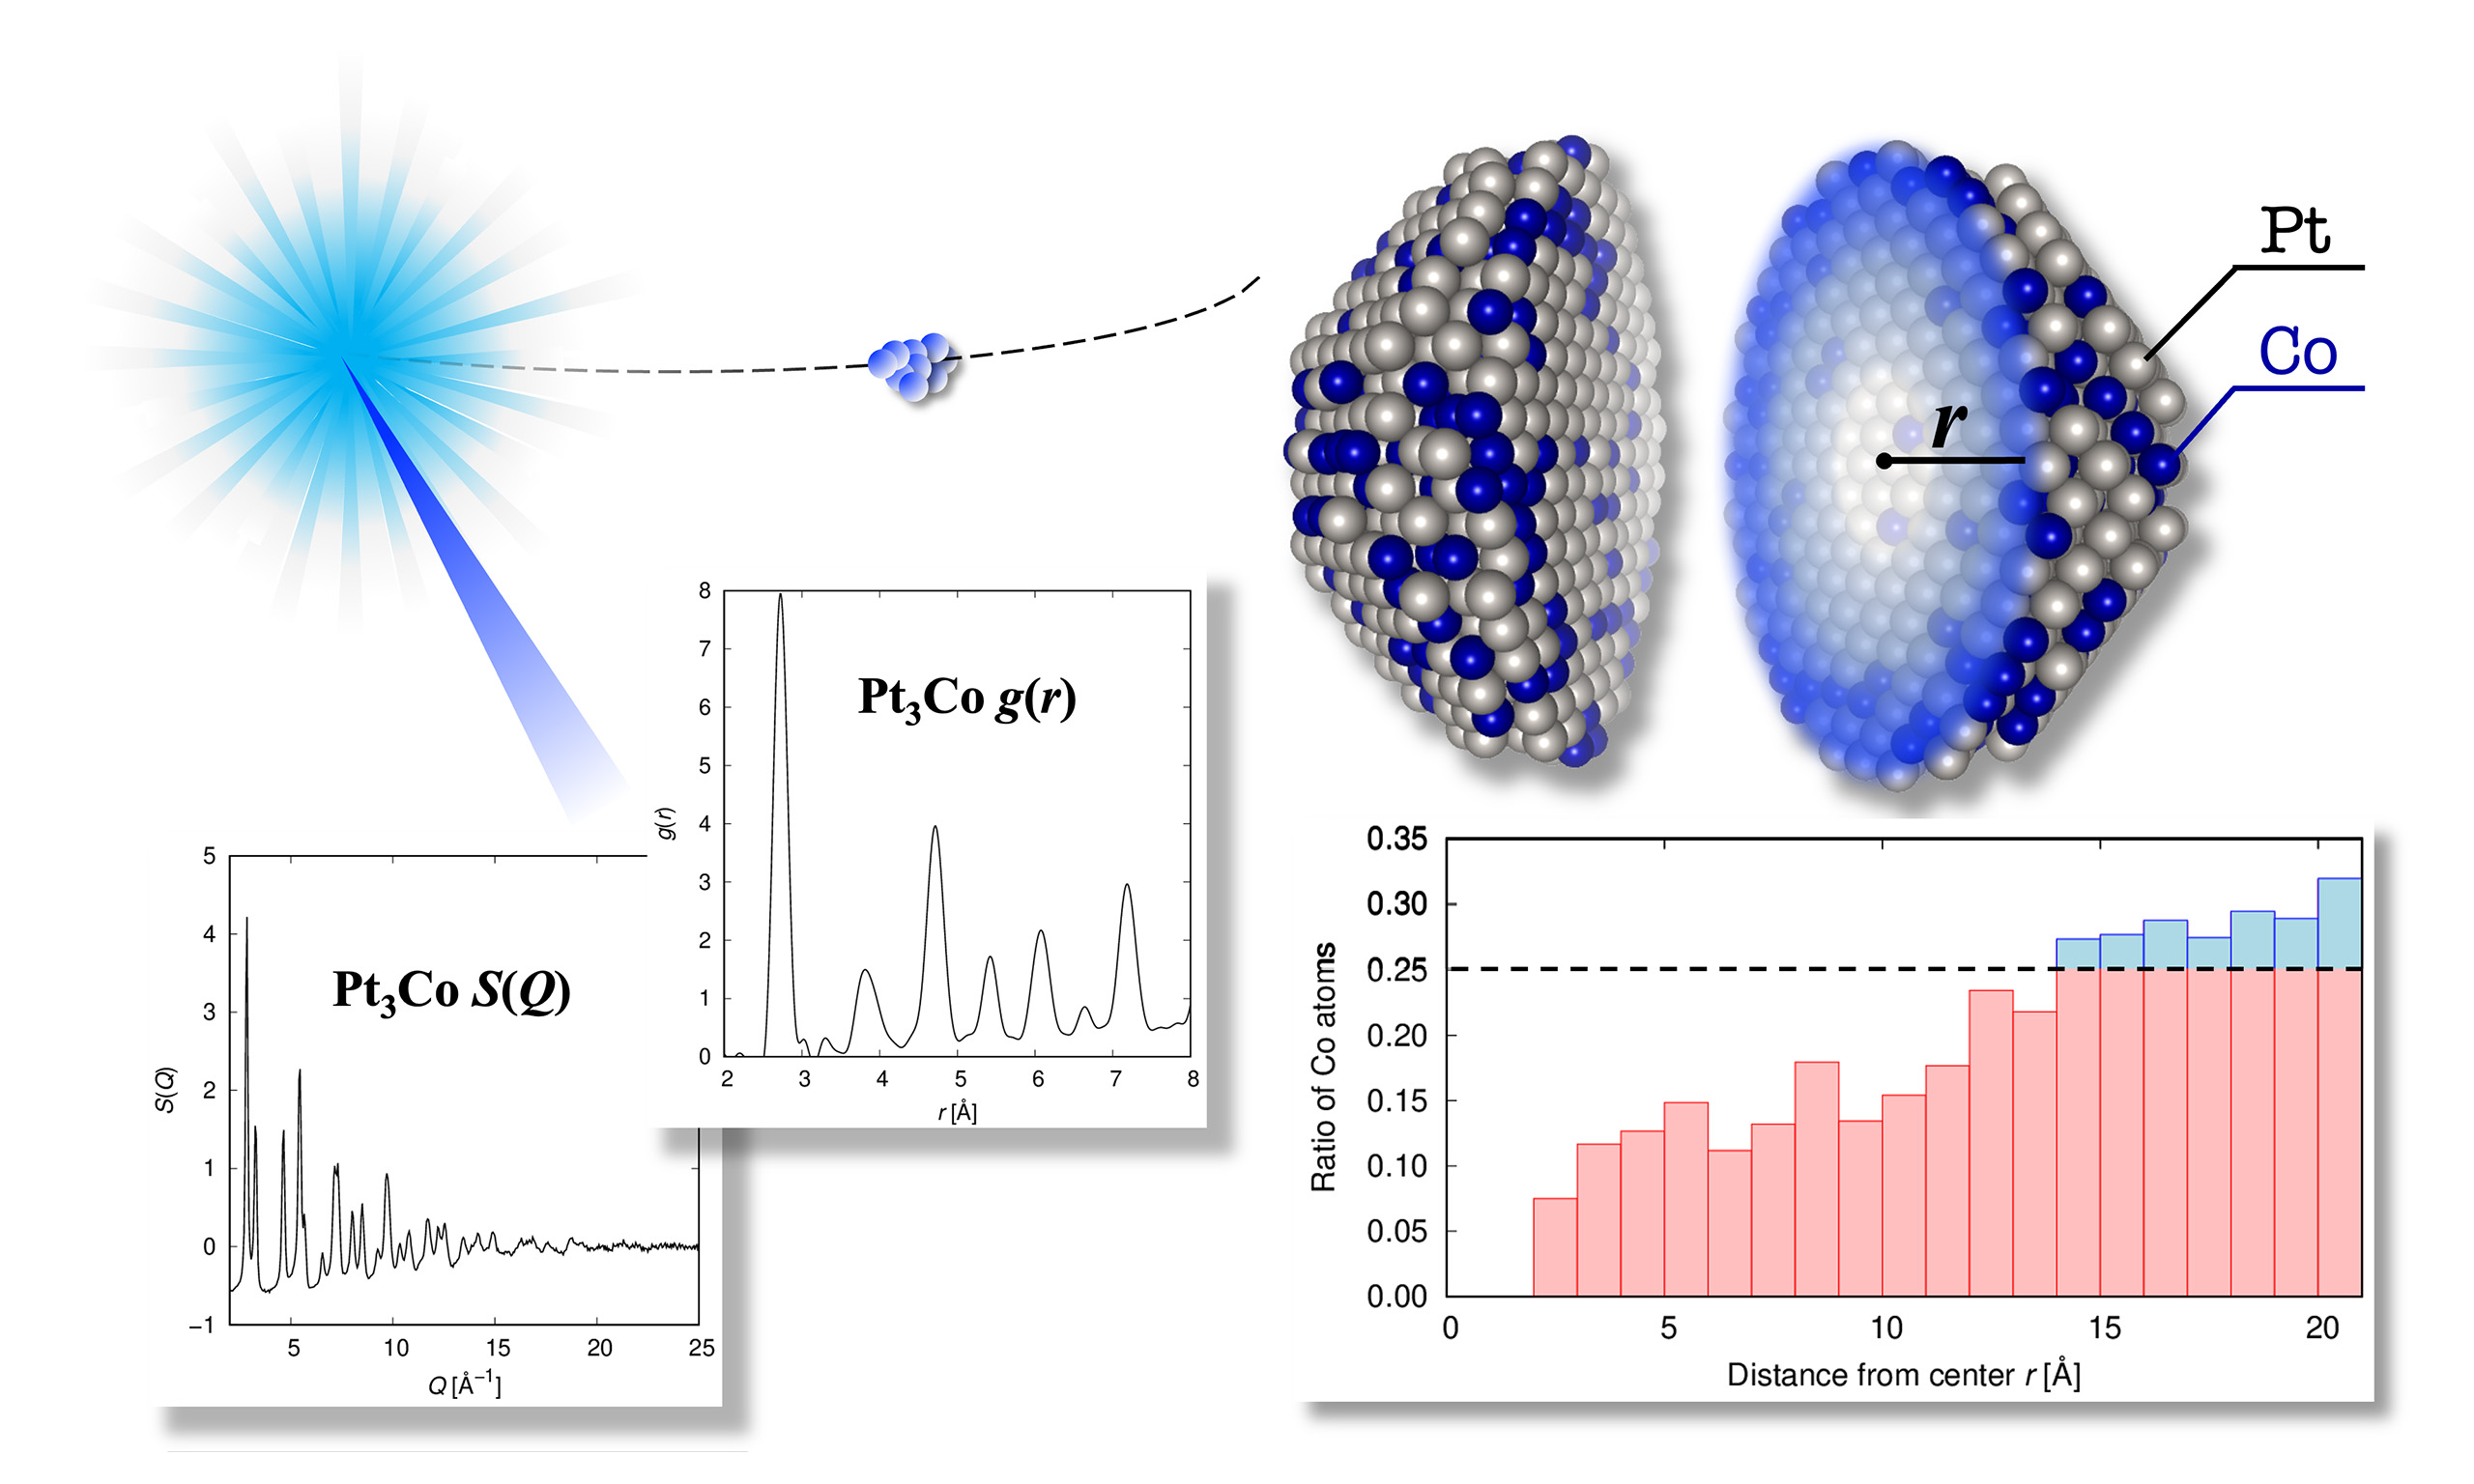
To elucidate the correlation between the catalytic properties of metal nanoparticles used in polymer electrolyte fuel cells and the atomic arrangements of such nanoparticles, high-energy X-ray diffraction measurements were conducted. Using the measured data as a reference, Reverse Monte Carlo was performed on isolated finite-size spherical cluster models to visualize the atomic arrangements of Pt and Pt3Co nanoparticles. In the Pt3Co nanoparticles, the local composition of the nanoparticle center and the surface region differed. The tendency of Co atoms to be located closer to the surface rather than the center was confirmed. Furthermore, the atomic arrangements in the center of the Pt and Pt3Co nanoparticles were more disordered than those in the surface region. Thus, we clarified the difference in the distribution of atoms in the center and surface regions by creating a three-dimensional model of the atomic arrangement of the nanoparticles. The visualized structural model can contribute to the development and performance enhancement of nanoparticle catalysts.
Keywords
INTRODUCTION
In the bid to achieve carbon neutrality by 2050, fuel cells (FCs), which convert the energy of water production from hydrogen and oxygen in the air into electricity, have been touted as potential power generation devices for hydrogen utilization[1]. FC vehicles (FCVs) have recently been commercialized, and polymer electrolyte FCs (PEFCs) have begun to be used as a power source for FCVs. PEFCs present significant advantages, as they exhibit a high power generation efficiency and do not produce carbon dioxide[2]. However, the commercialization of Pt nanoparticles, a precious metal, as catalysts for the hydrogen and oxygen electrodes of PEFCs has been slow because of the high price of PEFCs for high-power FCVs, which require a large amount of catalysts. In particular, the reduction reaction at the oxygen electrode is slower than the oxidation reaction at the hydrogen electrode[3,4]. Furthermore, the large amount of Pt used in the oxygen electrode hinders a reduction in PEFC costs. Pt catalysts with superior performance, i.e., high oxygen reduction reaction activity and durability, are required to reduce the amount of Pt needed.
The nanoparticles used as catalysts in PEFCs are crystallites (diameters of approximately 1-5 nm) and are characterized by a large proportion of interfaces. Thus, the structure and properties of the nanoparticles differ from those of the bulk metal. The number of atoms in the surface layer of such small metal nanoparticles is comparable to the number of atoms within the nanoparticles. Thus, it is important to investigate the three-dimensional (3D) atomic arrangement of the entire nanoparticle to understand the relationship between its atomic structure and catalytic properties.
To date, pair distribution function (PDF) analysis based on high-energy X-ray diffraction (HEXRD) has been employed to examine the 3D atomic arrangements of metal nanoparticles that deviate from the corresponding bulk crystal structures[5,6]. Furthermore, Reverse Monte Carlo (RMC) modeling[7,8] based on HEXRD data suggests that the atomic-scale structures of metal nanoparticles, such as Pt, Pd, Rh, and Ru, exhibit clear structural disorder[9-11]. Conventional RMC modeling is not suitable for modeling the atomic structure of nanoparticles because it assumes a homogeneous bulk metal. This is because, as the particle size decreases, the ratio of surface to core atoms becomes significant. In addition to such structural approaches, density functional theory (DFT) calculations have also been shown to provide valuable insights into catalytic mechanisms[12], highlighting the complementarity of experimental and theoretical analyses.
In 2013, Gereben and Petkov developed an RMC approach with nonperiodic boundary conditions (NP-RMC). Since NP-RMC enables the modeling of samples confined to finite sizes such as nanoparticles, it facilitates the analysis of structural differences between the core and surface. In particular, when the target material functions as a catalyst, the reaction sites are located on the surface; therefore, understanding the structural characteristics of the surface is crucial. Here, the 3D structural modeling of Pt and Pt3Co nanoparticles was performed via the RMC simulations of isolated finite-size spherical cluster models without periodic boundary conditions using HEXRD data to clarify the atomic arrangements associated with catalytic properties.
MATERIALS AND METHODS
Sample preparation
A carbon-supported Pt catalyst (TEC10V30E, Tanaka Kikinzoku Kogyo) and a carbon-supported PtCo catalyst (TEC36F52, Tanaka Kikinzoku Kogyo) were used as samples. Although they are commercial products, it is important to investigate their structures, as they can serve as standard samples for evaluating various catalyst samples in the future. The powder samples were reduced in a reaction vessel filled with high-purity hydrogen gas at room temperature for 30 min. The vessel was opened in a glove box under an Ar atmosphere and the samples were loaded into a quartz glass capillary (diameter = 1 mm).
High-energy X-ray diffraction measurements
HEXRD measurements were performed at the BL04B2 beamline[13,14] in SPring-8, Hyogo, Japan, to reveal the local atomic configuration of the synthesized nanoparticle catalysts. The incident X-ray beam
where ci and fi(Q) are the atomic concentration and X-ray atomic scattering factor of the i-th element in the material, respectively. The PDF, g(r), was calculated using the Fourier transform of S(Q):
where ρ is the atomic number density, and r is the radial distance. The upper limit of the integral was Qmax, which was determined by the experimental conditions. The sequential analyses were executed with the original software for the BL04B2 beamline.
Reverse Monte Carlo modeling
The atomic configuration of the nanoparticle catalysts was constructed via RMC modeling[7,8] with nonperiodic boundary conditions (NP-RMC)[9,16] using the obtained S(Q) values. Table 1 summarizes the structural information of the initial models of the Pt nanoparticles in TEC10V30E (average particle size of
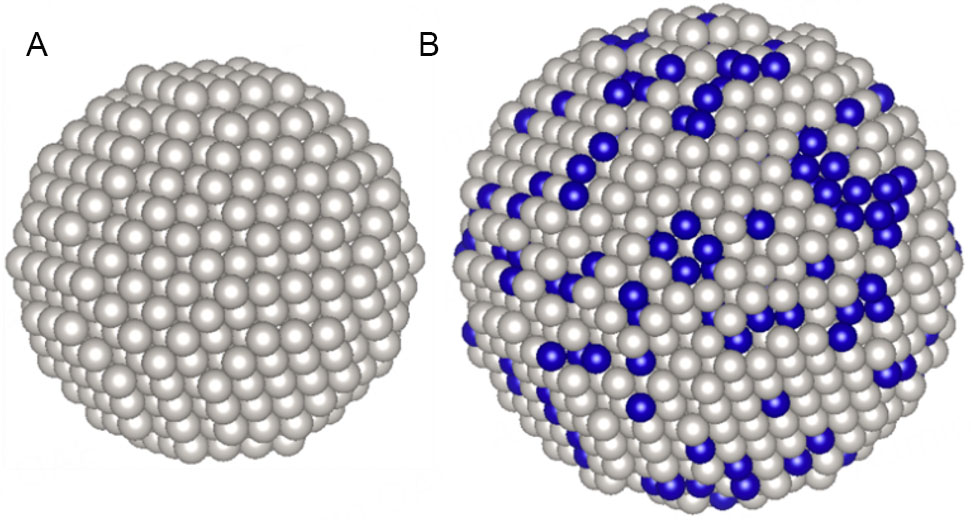
Figure 1. Snapshot of the initial atomic configurations of a Pt nanoparticle in TEC10V30E (A) and a Pt3Co nanoparticle in TEC36F52 (B). White and blue spheres represent Pt and Co atoms, respectively.
Structural information of the initial models of the Pt and Pt3Co nanoparticles
| Sample | TEC10V30E | TEC36F52 |
| Composition | Pt | Pt3Co |
| Lattice constant (fcc) | 3.902 Å | 3.859 Å |
| Number of atoms | 959 (Pt: 959) | 2315 (Pt: 1744, Co: 571) |
| Simulation diameter | 30 Å | 40 Å |
The Rw value used usually in crystallography to characterize the goodness of the fit is calculated for the g(r) and S(Q) data series, according to the formula:
where
In this study, we focus on nanoparticles in a static environment similar to a vacuum or inert conditions. However, during actual PEMFC operation, catalysts are exposed to a dynamic environment involving oxidation, hydration, and potential structural rearrangements. Although reproducing such dynamic environments using RMC is challenging, it is possible to discuss structural changes by performing similar experiments and modeling on nanoparticles after exposure to these dynamic conditions.
RESULTS AND DISCUSSION
Figure 2 shows the S(Q) and g(r) obtained via HEXRD measurements. A broadened Bragg peak profile corresponding to the nano-order crystallite size was confirmed for the S(Q) of both samples, and these profiles corresponded to the fcc crystal structure. Similarly, the g(r) exhibited peaks corresponding to the interatomic distances of the fcc crystal structure. These peaks were separated from each other because of a few disordered atomic configurations, such as the amorphous phase in the nanoparticles.
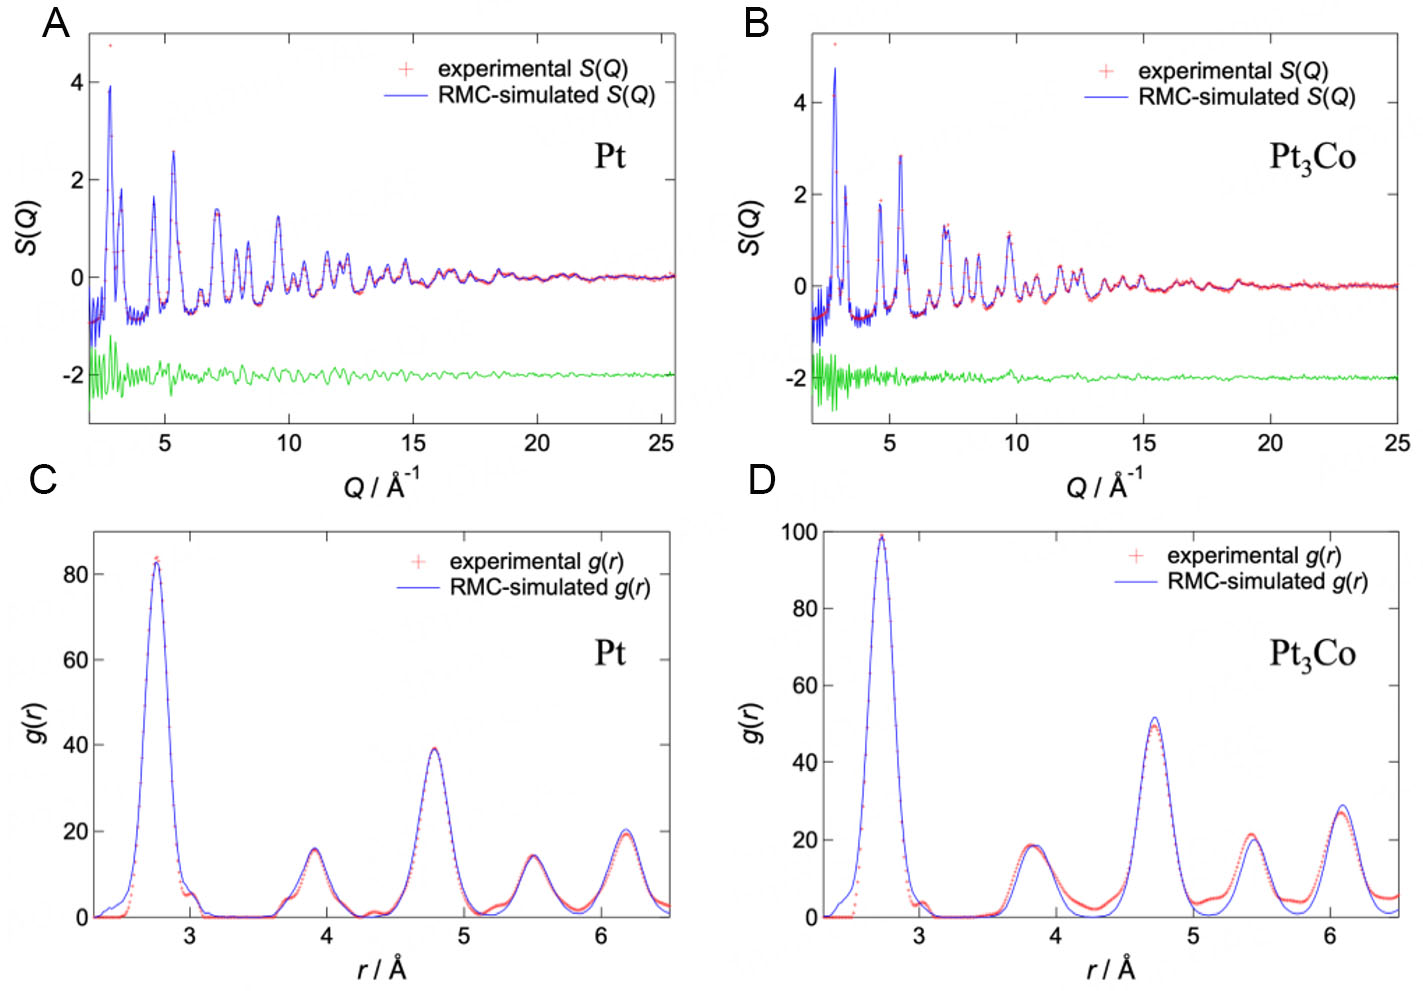
Figure 2. Results of HEXRD measurements and NP-RMC fittings. Structure factors S(Q) of the Pt (A) and Pt3Co (B) nanoparticles, as well as the pair distribution functions g(r) of the Pt (C) and Pt3Co (D) nanoparticles. The red, blue, and green marks represent the experimental data, RMC-simulated data, and the differences between both, respectively.
Figure 2 shows the S(Q) and g(r) of the final atomic configurations obtained via NP-RMC modeling. For both samples, the goodness-of-fit indicator Rw for fitting to the S(Q) via NP-RMC modeling reached
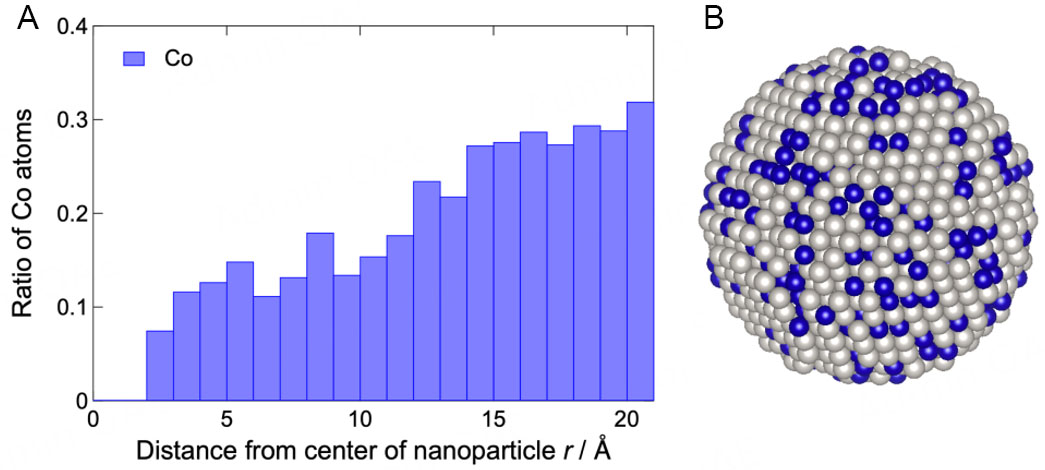
Figure 3. Ratio of Co atoms as a function of the distance from the center (A) of the nanoparticles. Snapshot (B) of the final atomic configuration of the Pt3Co nanoparticles. White and blue spheres represent Pt and Co atoms, respectively.
The neighboring distance distribution for the nanoparticle crystals was analyzed to characterize the disorder of the atomic configuration. Thus, NP-RMC calculations were performed 10 times for each nanoparticle under the same calculation conditions, and the neighboring distance distributions of the results were added to improve the statistical accuracy. Figure 4 shows the neighboring distance distribution for the Pt and
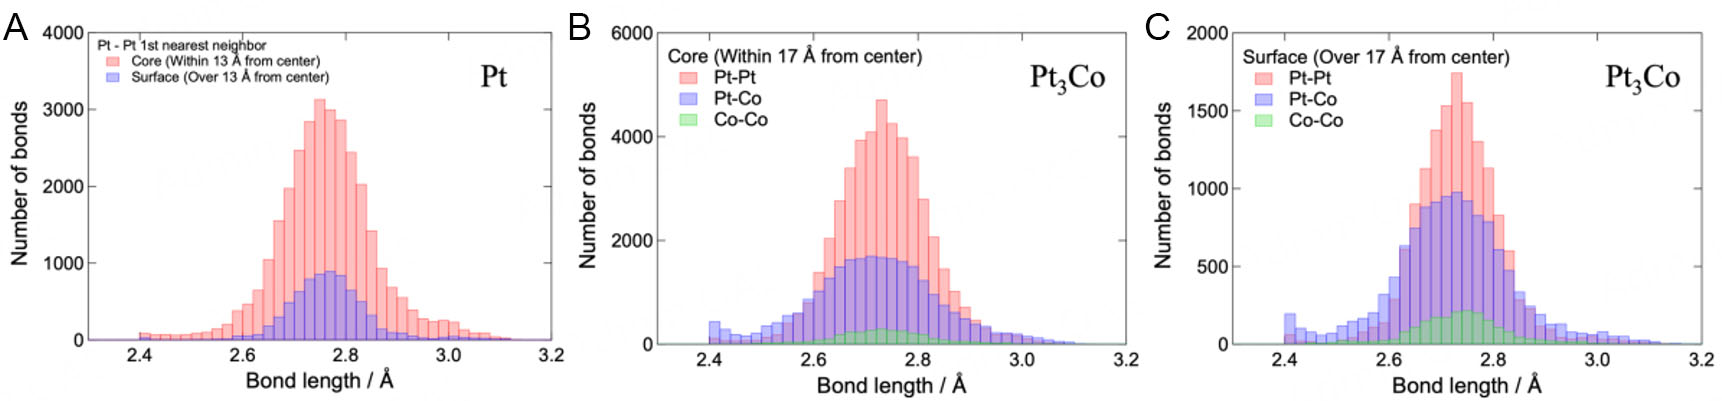
Figure 4. Neighboring distance distribution of atoms in the Pt nanoparticles (A) and of internal (B) and surface (C) atoms in the Pt3Co nanoparticles. For the Pt nanoparticles, the red and blue bars represent the distributions of internal and surface atoms, respectively. Oppositely, for the Pt3Co nanoparticles, the red, blue, and green bars represent the Pt-Pt, Pt-Co, and Co-Co correlation distributions, respectively.
Neighboring distance distribution parameters for the Pt and Pt3Co nanoparticles
| Pairs (Pt nanoparticles) | Average distance | FWHM |
| Pt-Pt (core) | 2.75 Å | 0.18 Å |
| Pt-Pt (surface) | 2.75 Å | 0.15 Å |
| Pairs (Pt3Co nanoparticles) | Average distance | FWHM |
| Pt-Pt (core) | 2.73 Å | 0.19 Å |
| Pt-Co (core) | 2.72 Å | 0.26 Å |
| Co-Co (core) | 2.73 Å | 0.20 Å |
| Pt-Pt (surface) | 2.73 Å | 0.16 Å |
| Pt-Co (surface) | 2.72 Å | 0.22 Å |
| Co-Co (surface) | 2.73 Å | 0.17 Å |
An understanding of the atomic arrangement of the surface region will prove useful in the prediction of catalytic properties since catalytic reactions occur on the surface of nanoparticles. This will facilitate an evaluation of the catalytic activity and durability of nanoparticles using new variables, such as the composition of the surface region, disorder in the crystal lattice, and particle size, which is related to the surface area. These variables can then be used to elucidate the structural features that strongly contribute to the catalytic properties. We expect that the development of nanoparticle catalysts using HEXRD and NP-RMC will be dramatically accelerated by establishing a technique for evaluating catalytic properties from a microscopic viewpoint.
CONCLUSIONS
Here, Pt and Pt3Co nanoparticles were subjected to HEXRD measurements to clarify the correlation between the local atomic configuration and catalytic activity. Furthermore, 3D atomic configuration models were successfully constructed via NP-RMC modeling based on the experimental S(Q) and g(r). From the structural model, features such as spatial concentration and atomic arrangement disorder were extracted. In the Pt3Co nanoparticles, the dependence of Pt and Co concentrations on the distance from the center was confirmed. Fewer Co atoms were observed in the center, and more Co atoms were observed near the surface. NP-RMC modeling, which permits Pt and Co swapping, confirmed the difference between the core and surface Co distributions. The distributions of the distance between neighboring atoms were derived from the obtained models. For both Pt and Pt3Co nanoparticles, the distributions were slightly wider in the core region than in the surface region, indicating that the atomic arrangement was more disordered in the core region than in the surface region. Furthermore, the width of the distribution of the Pt3Co nanoparticles exceeded that of the Pt nanoparticles, indicating that the disorder in the atomic arrangement of the Pt3Co nanoparticles was due to the presence of Co atoms.
Nanoparticles are promising as catalysts because of their large surface area for chemical reactions. Here, the atomic distribution of the surface region and the degree of disorder in the atomic arrangement were successfully determined by modeling the atomic arrangement of nanoparticles via NP-RMC. This study provides insights into the development of catalytic properties based on an understanding of the atomic configuration of nanoparticles.
DECLARATIONS
Acknowledgments
Synchrotron radiation experiments were performed with the approval of the Japan Synchrotron Radiation Research Institute (JASRI) (Proposal Nos. 2021B1016, 2022A1014, and 2022B1006).
Authors’ contributions
Study conception and design, data analysis, commented on the first version of the manuscript: Mizuno, Y.; Tsuji, H.; Hiroi, S.; Uruga, T.; Kaneko, T.; Nakada, K.; Ohara, K.; Imai, H.; Uchimoto, Y.; Sakurai, Y.
Material preparation: Imai, H.
Data collection: Mizuno, Y.; Tsuji, H.; Hiroi, S.; Ohara, K.
The first draft of the manuscript was written:Mizuno, Y.; Hiroi, S.; Ohara, K.
All authors read and approved the final manuscript.
Availability of data and materials
Data are available from the corresponding authors upon reasonable request.
AI and AI-assisted tools statement
Not applicable.
Financial support and sponsorship
This work is based on results obtained from an FC-Platform project (P20003) commissioned by the New Energy and Industrial Technology Development Organization (NEDO).
Conflicts of interest
All authors declared that there are no conflicts of interest.
Ethical approval and consent to participate
Not applicable.
Consent for publication
Not applicable.
Copyright
© The Author(s) 2026.
REFERENCES
2. Wang, Y.; Diaz, D. F. R.; Chen, K. S.; Wang, Z.; Adroher, X. C. Materials, technological status, and fundamentals of PEM fuel cells - A review. Mater Today 2020, 32, 178-203.
3. Debe, M. K. Electrocatalyst approaches and challenges for automotive fuel cells. Nature 2012, 486, 43-51.
4. Strmcnik, D.; Escudero-Escribano, M.; Kodama, K.; Stamenkovic, V. R.; Cuesta, A.; Marković, N. M. Enhanced electrocatalysis of the oxygen reduction reaction based on patterning of platinum surfaces with cyanide. Nat Chem 2010, 2, 880-5.
6. Petkov, V.; Bedford, N.; Knecht, M. R.; et al. Periodicity and atomic ordering in nanosized particles of crystals. J Phys Chem C 2008, 112, 8907-11.
7. McGreevy, R. L.; Pusztai, L. Reverse Monte Carlo simulation: a new technique for the determination of disordered structures. Mol Simul 1988, 1, 359-67.
9. Gereben, O.; Petkov, V. Reverse Monte Carlo study of spherical sample under non-periodic boundary conditions: the structure of Ru nanoparticles based on x-ray diffraction data. J Phys Condens Matter 2013, 25, 454211.
10. Kumara, L. S.; Sakata, O.; Kohara, S.; et al. Origin of the catalytic activity of face-centered-cubic ruthenium nanoparticles determined from an atomic-scale structure. Phys Chem Chem Phys 2016, 18, 30622-9.
11. Harada, M.; Ikegami, R.; Kumara, L. S. R.; Kohara, S.; Sakata, O. Reverse Monte Carlo modeling for local structures of noble metal nanoparticles using high-energy XRD and EXAFS. RSC Adv 2019, 9, 29511-21.
12. Wang, J.; Zhang, J.; Zhang, Y.; et al. Atom-level tandem catalysis in lithium metal batteries. Adv Mater 2024, 36, e2402792.
13. Isshiki, M.; Ohishi, Y.; Goto, S.; Takeshita, K.; Ishikawa, T. High-energy X-ray diffraction beamline: BL04B2 at SPring-8. Nucl Instrum Methods Phys Res A 2001, 467-8, 663-6.
14. Ohara, K.; Onodera, Y.; Murakami, M.; Kohara, S. Structure of disordered materials under ambient to extreme conditions revealed by synchrotron X-ray diffraction techniques at SPring-8-recent instrumentation and synergic collaboration with modelling and topological analyses. J Phys Condens Matter 2021, 33, 383001.
15. Billinge, S. J.; Kanatzidis, M. G. Beyond crystallography: the study of disorder, nanocrystallinity and crystallographically challenged materials with pair distribution functions. Chem Commun 2004, 7, 749-60.
Cite This Article
How to Cite
Download Citation
Export Citation File:
Type of Import
Tips on Downloading Citation
Citation Manager File Format
Type of Import
Direct Import: When the Direct Import option is selected (the default state), a dialogue box will give you the option to Save or Open the downloaded citation data. Choosing Open will either launch your citation manager or give you a choice of applications with which to use the metadata. The Save option saves the file locally for later use.
Indirect Import: When the Indirect Import option is selected, the metadata is displayed and may be copied and pasted as needed.
About This Article
Copyright

Data & Comments
Data
0


Comments
Comments must be written in English. Spam, offensive content, impersonation, and private information will not be permitted. If any comment is reported and identified as inappropriate content by OAE staff, the comment will be removed without notice. If you have any queries or need any help, please contact us at [email protected].