


fig2
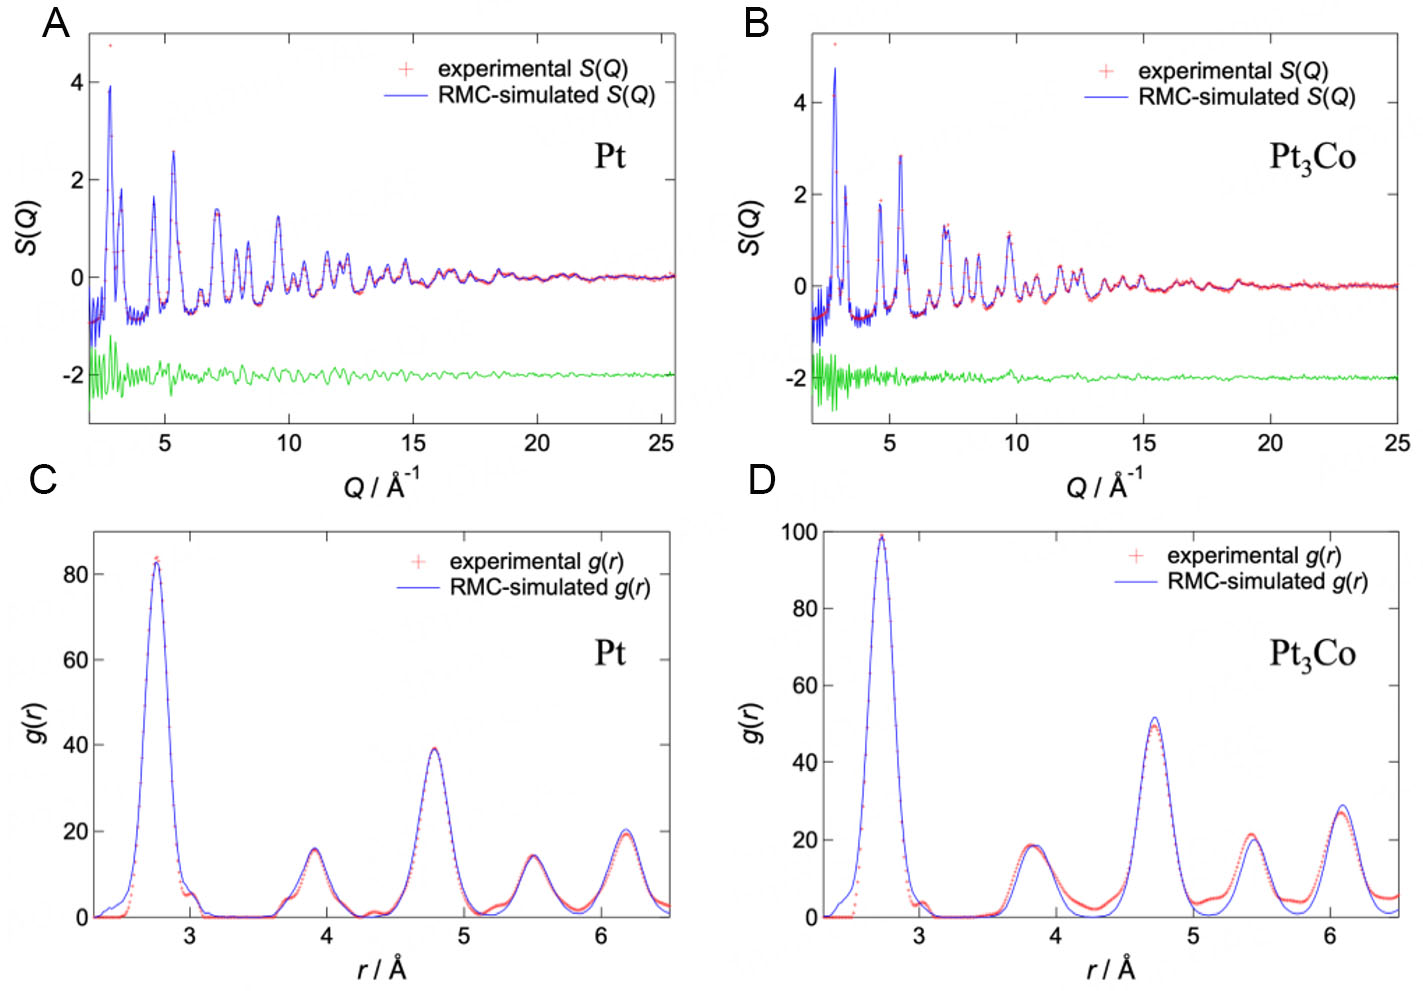
Figure 2. Results of HEXRD measurements and NP-RMC fittings. Structure factors S(Q) of the Pt (A) and Pt3Co (B) nanoparticles, as well as the pair distribution functions g(r) of the Pt (C) and Pt3Co (D) nanoparticles. The red, blue, and green marks represent the experimental data, RMC-simulated data, and the differences between both, respectively.


