


fig4
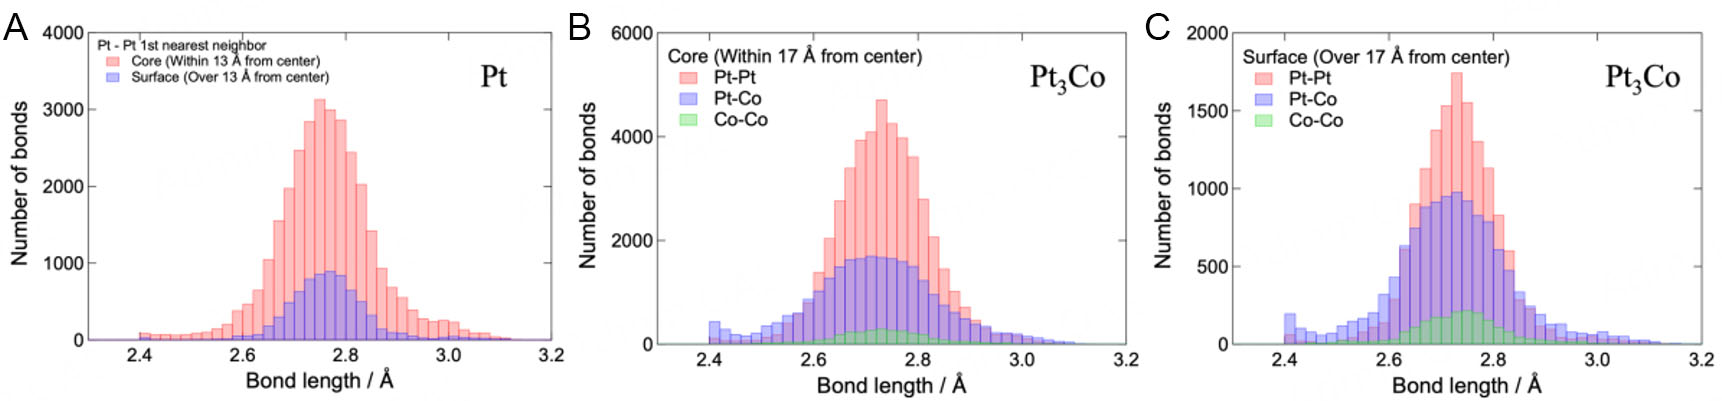
Figure 4. Neighboring distance distribution of atoms in the Pt nanoparticles (A) and of internal (B) and surface (C) atoms in the Pt3Co nanoparticles. For the Pt nanoparticles, the red and blue bars represent the distributions of internal and surface atoms, respectively. Oppositely, for the Pt3Co nanoparticles, the red, blue, and green bars represent the Pt-Pt, Pt-Co, and Co-Co correlation distributions, respectively.


