


fig8
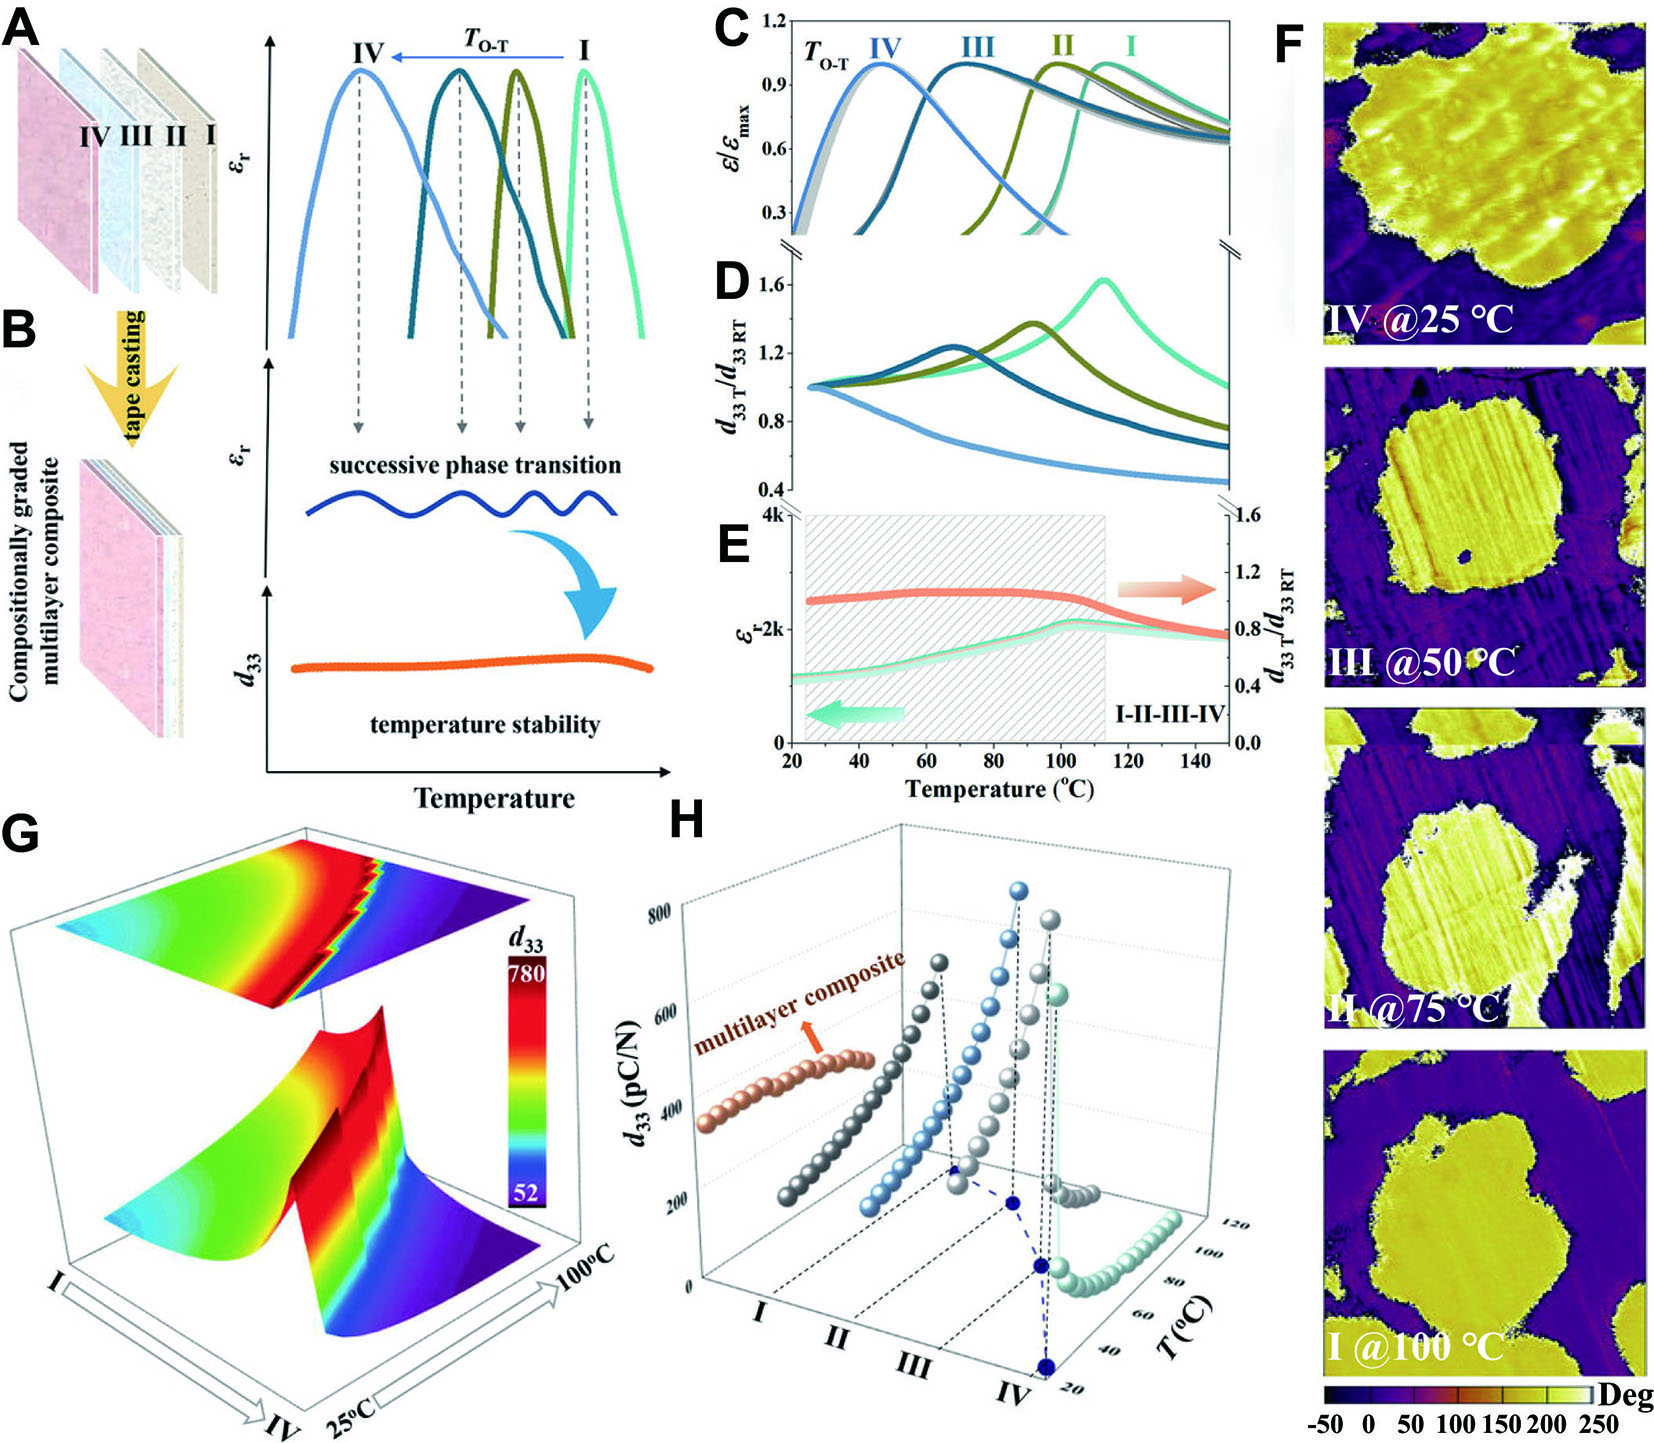
Figure 8. Multilayer structures and compositional gradient design. (A and B) Schematic diagrams for the mechanism of multilayer compositional gradients. Temperature dependence of (C) ε/εmax (D) d33T/d33RT, and (E) εr of each layer. (F) PFM images of the single layer near the O-T transition. (G) Phase-field simulation of the multilayer composite. (H) Temperature-dependent d33 of the single and multilayer composite, calculated from the simulation results. This figure quoted with permission[33]. Copyright 2022, Wiley-VCH.


