


fig10
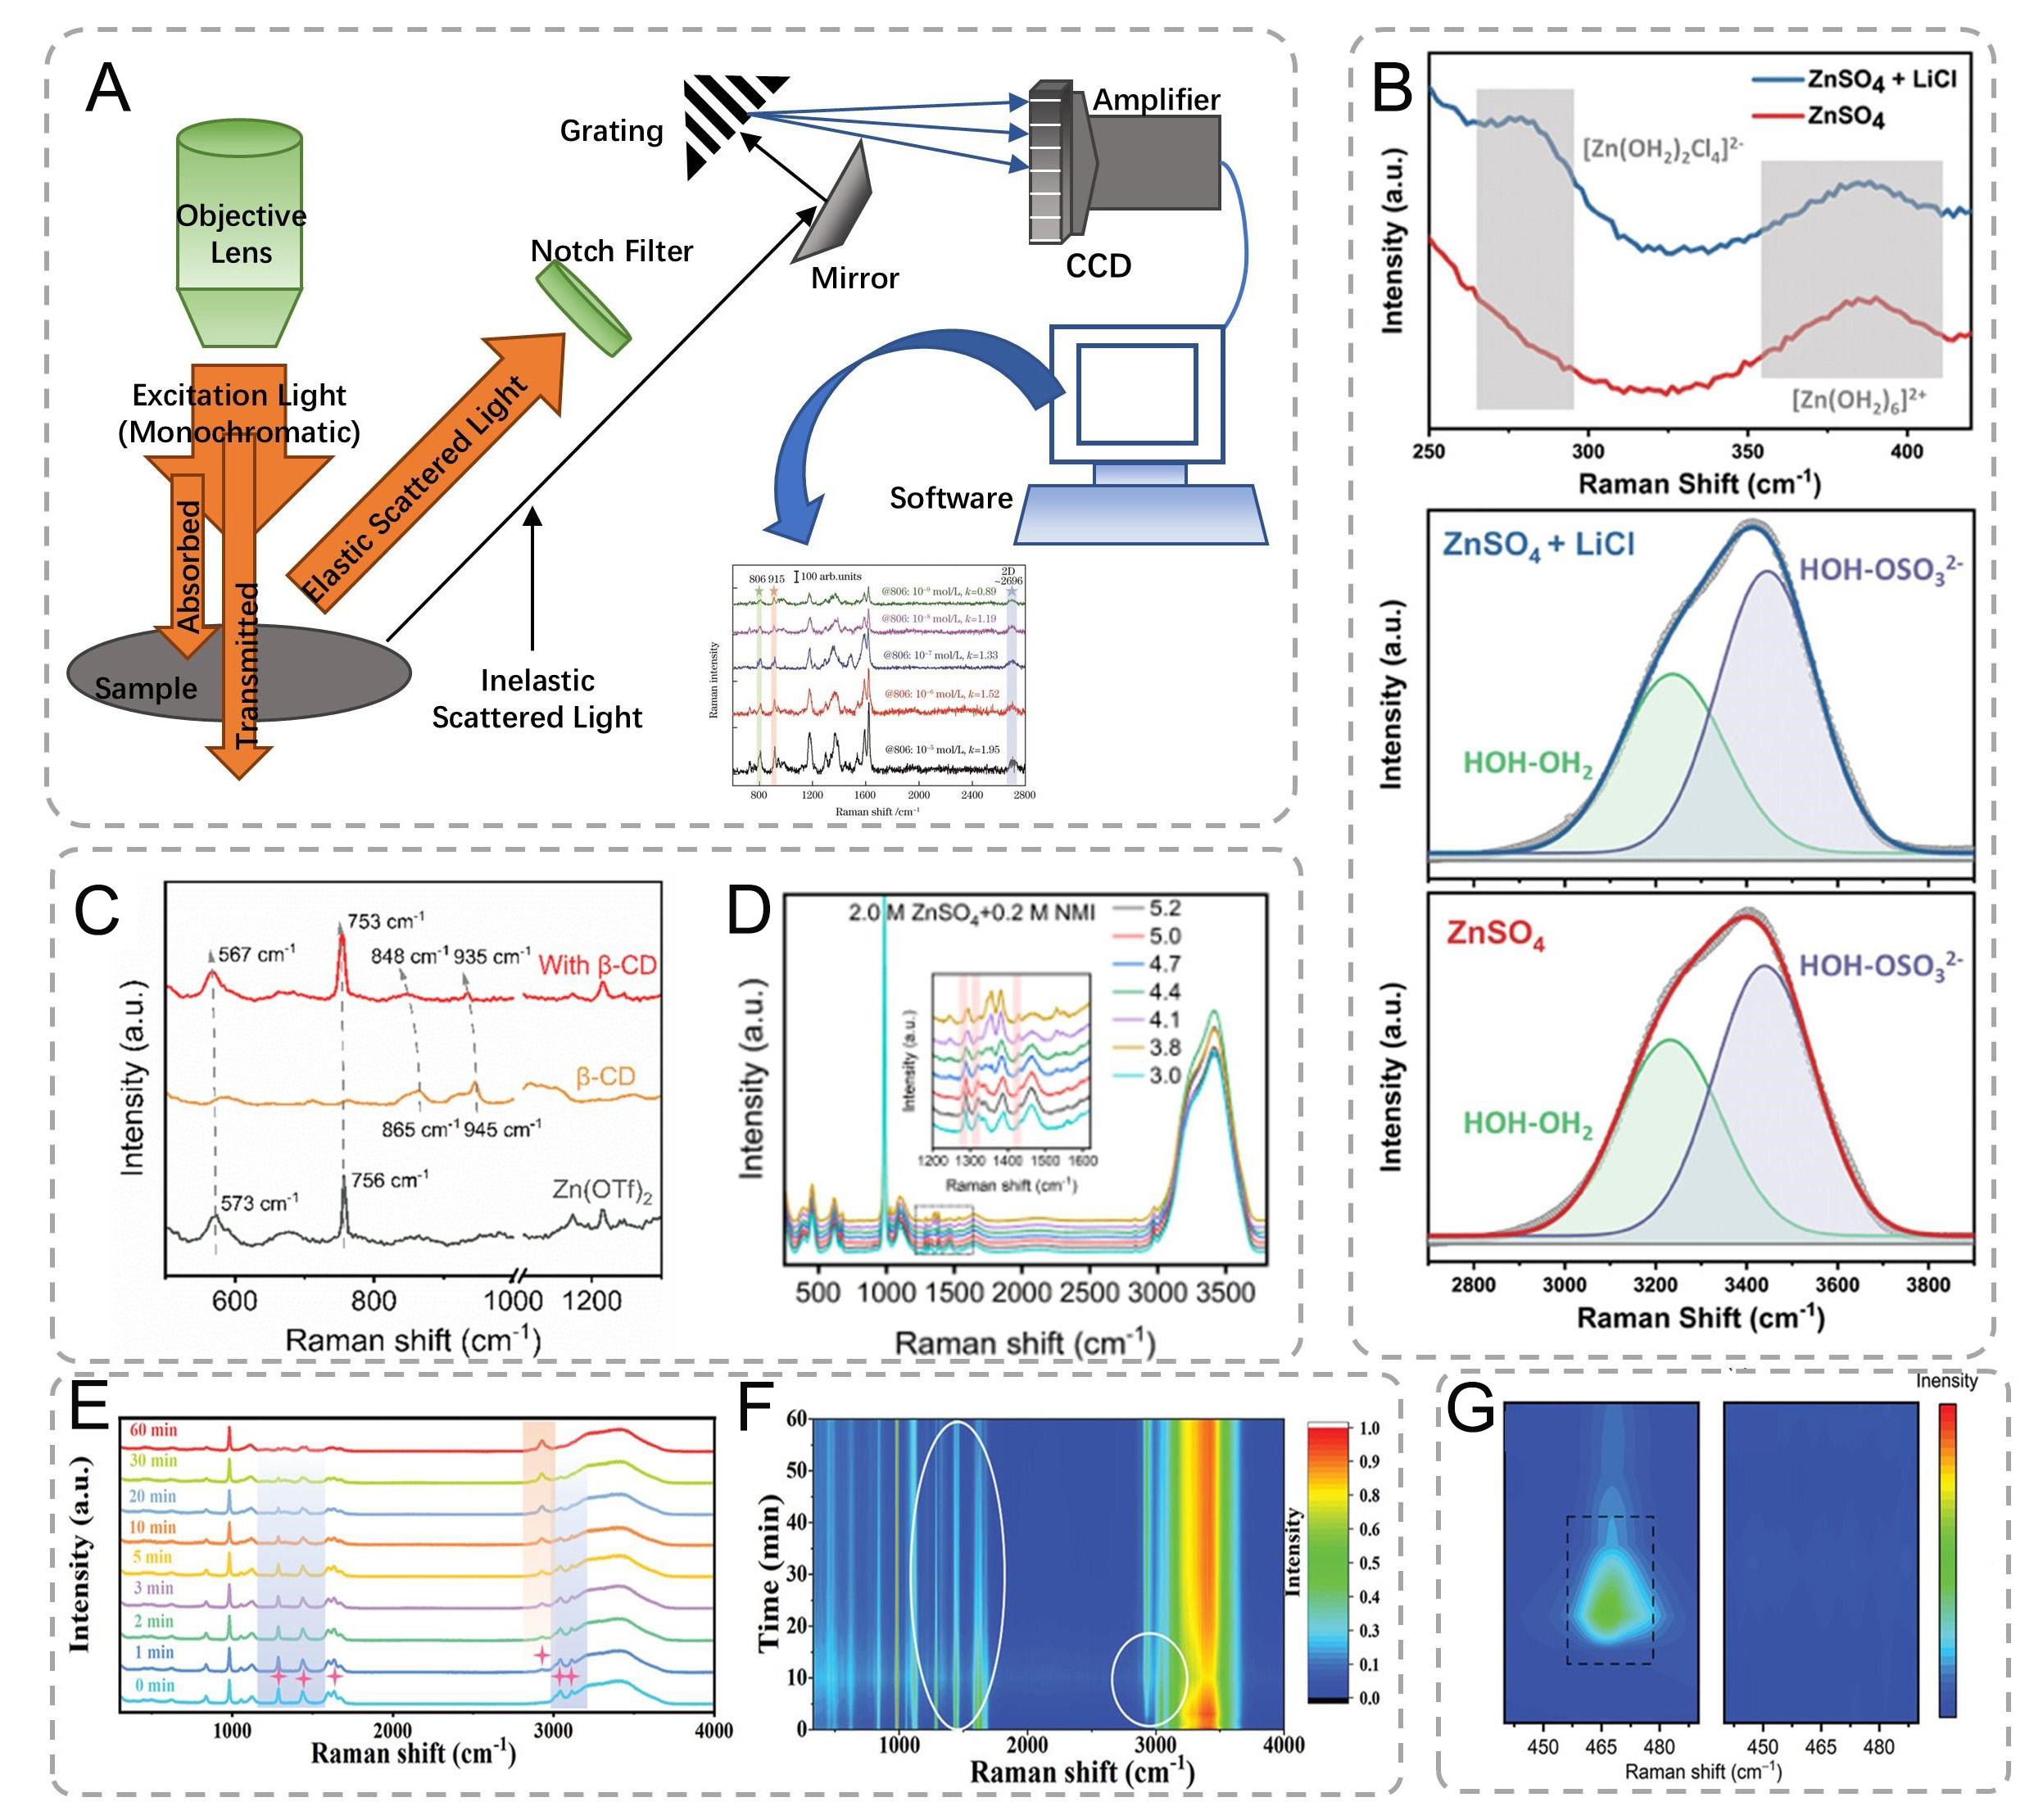
Figure 10. (A) Schematic diagram of the Raman spectroscopy setup. (B) Raman spectra of 2 M ZnSO4 and 2 m ZnSO4 containing 1.1 M LiCl electrolytes. Voltages are referenced to Zn/Zn2+[137]. Copyright 2024, Wiley (C) Raman spectra of pure Zn(OTf)2, β-CD, and β-CD@OTf- complex[9]. Copyright 2024, Springer Nature. (D) Raman spectrophotometry of 2.0 M ZnSO4 + 0.2 M NMI solutions at different pH values[138]. Copyright 2023, Wiley. (E) In situ Raman spectra of the GPE at various reaction times and (F) the corresponding contour map[131]. Copyright 2023, Wiley. (G) Raman spectra of Cu@Zn and MGA@Zn electrodes after first cycling[139]. Copyright 2022, Wiley.


