


Non-equilibrium dendrite microstructure during quasi-rapid solidification of Mg-Al alloy
 0
0 Abstract
The non-equilibrium dendrite growth of Mg-6wt.%Al alloy during quasi-rapid solidification is studied by combining phase-field simulations and comparative experiments (furnace/air/water cooling: 0.07/2.9/181 K/s). The kinetic behavior of the solid-liquid interface is characterized, and the solute trapping-drag competition is emphasized. The effects of undercooling (28-36 K), cooling rate, and orientation angle (0-π/6) on dendrite morphological evolution are systematically explored, and the laws governing the morphological transition of the interface front are analyzed according to the condition criterion of interface transition. The experimental primary dendrite arm spacing decreases from ~45 ± 4.2 μm (0.07 K/s) to ~5.5 ± 0.7 μm (181 K/s), matching the phase-field simulations (relative error less than 9%). The solid-phase Al concentration rises from 2.6 ± 0.22 wt.% to 5.4 ± 0.26 wt.% experimentally, consistent with the simulated trends. The simulated critical value for planar-to-cellular transition (1.2 × 10⁹ K·s/m2) is lower than the theoretical value (1.48 × 10¹⁰ K·s/m2) due to solute drag. The analysis of the partial drag condition is extended by integrating thermodynamics and kinetics. The limitation of the current model in capturing the intermediate partial drag state and potential future direction to address this are discussed. Through combining with the experimental results under different cooling rates, the simulation results are further interpreted and validated in both quantitative and qualitative way. This research provides theoretical basis for the regulation of magnesium alloy microstructures under quasi-rapid solidification such as industrial die-casting process.
Keywords
INTRODUCTION
As one of the lightest metal structural materials, magnesium alloy is widely used in automotive, aerospace and other fields because of high specific strength, excellent shock absorption, and heat dissipation performance[1-4]. Because of good mechanical properties and low production cost, Mg-Al alloys are one of the most commonly used magnesium alloy systems, and they are mainly formed by die casting process[5-8]. The die casting process has a typical feature of fast solidification velocity which belongs to quasi-rapid solidification. Through changing the interface dynamics, the non-equilibrium effects during quasi-rapid solidification can refine the microstructures and enhance the solid solubility, which directly affects the materials properties. Therefore, revealing the microstructure evolution mechanism of Mg-Al alloys during quasi-rapid solidification can benefit performance improvement and process optimization.
Numerous studies have reported the microstructural characteristics under quasi-rapid solidification. Teng et al. prepared AZ61 magnesium alloy foils using a quasi-rapid solidification technique and found that microsegregation in the quasi-rapid solidified structure was significantly suppressed compared with the conventional solidified structure, with alloying elements exhibiting higher solid solubility[9]. You et al. obtained the die casting microstructures of AZ91 with different cooling rates by changing the thickness of the die casting wall, and they found that the grain size is refined with the increase of the cooling rate[10]. Sharifi et al. predicted the grain size and skin thickness of die-cast AM60 alloy as a function of cooling rate, enabling the prediction of grain size distribution and skin layer thickness across the casting cross-section[11]. However, it is difficult to capture the transient interface evolution and solute redistribution process during quasi-rapid solidification through experimental methods. During quasi-rapid solidification, high cooling rate induces transient and non-equilibrium characteristics in solid-liquid interface evolution and solute redistribution. Traditional experimental methods, limited by temporal and spatial resolution, struggle to achieve real-time capture of dynamic processes. Although in-situ synchrotron X-ray imaging technology demonstrates unique advantages in solidification observation through high spatiotemporal resolution, the data acquisition speed presents a time-scale mismatch with the high-speed interface migration during quasi-rapid solidification, making real-time dynamic observation challenging.
Alternatively, numerical simulation provides effective ways to characterize the dynamic behavior of quasi-rapid solidification[12,13]. The phase-field method (PFM) has significant advantages in solidification simulation because of eliminating the tracking of the solid-liquid interface[14-16]. Ji et al. established a rapid solidification phase-field model by enhancing solute diffusivity at the interface and studied interface shapes and tip radii of Al-Cu alloys under different interface thickness parameters[17]. Kavousi and Zaeem simulated one-dimensional rapid growth of Si-As alloys by modifying the anti-trapping current in the PFM, and the predictions for the partition coefficient, solid-phase concentration, and dimensionless undercooling under the full solute drag condition agree well with the analytical results[18]. Pinomaa and Provatas simulated the directional growth of Si-As alloys by adjusting the anti-trapping current and emphasized the effect of solute trapping on the growth behavior[19]. However, existing non-equilibrium solidification studies primarily focus on reproducing solute trapping in one-dimensional simulations, e.g., matching continuous growth model (CGM) kinetics and analyzing the impact of model parameters. The dendrite growth behavior, which is one of the most common solidification microstructures, has not been inadequately characterized, especially for magnesium alloys with hexagonal close-packed (hcp) crystal structure. The large phase transformation driving force during quasi-rapid solidification gives rise to a series of non-equilibrium effects, including interface kinetic undercooling, solute trapping, and solute drag. These effects dominate the quasi-rapid solidification process and strongly influence the formation of dendrite microstructures. Additionally, the prediction results of quasi-rapid solidification models are less used to compare the experimental results for interpretation and validation.
The solute trapping and the solute drag play an important role in controlling the evolution of the non-equilibrium microstructures. The solute trapping refers to a phenomenon where the diffusion rate of solute atoms lags far behind the advancing rate of the solid-liquid interface under quasi-rapid or rapid non-equilibrium conditions. As a result, the solute atoms cannot be expelled from the solid phase in time and are “frozen” in the solid solution lattice. Its essence lies in kinetics inhibiting the normal segregation of solutes. In contrast, the solute drag occurs when the solute atoms segregate at the solid-liquid interface. Through interactions with the interface, the solute atoms impede the migration of the solid-liquid interface. Its essence is that the interaction between the solutes and the interface slows down the interface movement rate.
In this work, the effects of solute trapping and solute drag on the non-equilibrium dendrite morphology of Mg-6wt.%Al alloy, which is viewed as a viable candidate for Mg alloy gigacastings, are investigated by the dimensionless phase-field model of quasi-rapid solidification. The competition mechanism between solute trapping and solute drag is revealed in terms of the dendrite growth velocity, interface stability, and solute distribution under different temperature conditions. The effects of orientation angle, temperature gradient, and cooling rate on the morphology of columnar dendrites are clarified. The analysis of the intermediate partial drag condition is extended by combining thermodynamics with kinetics. The limitation of the current model in capturing the partial drag state and potential future direction to address this are deliberated to strengthen this work. The simulation results are further explained and validated in combination with experimental results. The results can provide theoretical guidance for the microstructure control of quasi-rapid solidification, e.g., in the forming process of die-cast magnesium alloys.
MATERIALS AND METHOD
Model
A quantitative phase-field model developed by Pinomaa and Provatas is used to simulate dendrite growth under quasi-rapid solidification conditions[19]. The model is further nondimensionalized by using far-field concentration c∞ and equilibrium freezing temperature range ΔT0 = |m|c∞(1 - ke)/ke as concentration and temperature scales, as follows:
where ϕ is the order parameter denoting liquid (ϕ = -1) and solid phase (ϕ = 1), τ is the relaxation time, W = W0A(ψ) is the interface width, ke is the equilibrium partition coefficient, λ =
The anti-trapping current is used to obtain controlled solute trapping:
where A is the trapping parameter which determines the amount of solute trapping during the quasi-rapid solidification, and introducing A can obtain a velocity-dependent partition coefficient. During quasi-rapid solidification, the kinetic effect cannot be neglected due to increased interface velocity. The expression for the kinetic coefficient is:
where a1 = 0.8839 is the asymptotic constant, and a2 is determined by the trapping parameter which is modified to incorporate the continuous growth kinetics[19]:
where a2+ corresponds to zero solute drag, and a2- corresponds to full solute drag.
The numerical discretization is performed on a Cartesian uniform mesh. The phase-field Equation (1) is discretized by the finite difference method, i.e., the center discretization scheme for the Laplace operator. The solute field Equation (2) is discretized according to the net flux control volume method, mainly for the divergence operator[20,21]. The first order marching scheme is employed for the first derivation with respect to time.
Parameters
The Mg-6wt.%Al alloy is used to simulate the dendrite growth, and the thermo-physical parameters, together with modeling parameters, are listed in Table 1.
Thermo-physical parameters of Mg-6wt.%Al alloys
| Parameters | Mg-6wt.%Al |
| c∞ (nominal composition, wt.%) | 6 |
| D (solute diffusivity in liquid, m2/s) | 5 × 10⁻⁹ |
| ke (equilibrium partition coefficient) | 0.33 |
| m (liquidus slope, K/wt.%) | -6.1 |
| TM (melting point of the pure melt, K) | 923 |
| Γ (Gibbs-Thomson coefficient, K·m) | 1.4 × 10⁻⁷ |
| ΔT0 (equilibrium freezing range, K) | 80 |
| VDCGM (diffusion velocity in CGM, m/s) | 0.5 |
| VDPF (diffusion velocity in PFM, m/s) | 0.31 |
| τ 0 (relaxation time under equilibrium, s) | 8.2 × 10⁻⁷ |
| W 0 (interface thickness parameter, m) | 2.0 × 10⁻⁸ |
| dt (dimensionless time step) | 2.04 × 10⁻² |
| dx (dimensionless space step) | 0.8 |
The domain size is 819.2 × 819.2, that is, 1,024 × 1,024 if a uniform grid of dx = 0.8 W0 is employed, where dx is the grid size, i.e., the space step, and W0 is the interface thickness parameter. With this domain size, the growing dendrite tip can reach a steady state without the solute boundary layer in front of it interfering with the domain boundary, avoiding finite-size effects. The circular solid seed is initialized inside the domain. A periodic boundary condition is set at all domain sides for all variables including phase field, solute concentration, and temperature. The model convergence is tested by evaluating the change of the average growth velocity with the space step and the time step, as shown in Supplementary Materials.
The trapping parameter is related to the solute diffusivity in the liquid, i.e., A = D/(VDPFW), where VDPF is the phase-field diffusion velocity and D is real solute diffusivity, which can be calculated by solving the transcendental relationship between the interface velocity V and the non-equilibrium partition coefficient k(V):
The quasi-rapid solidification model is obtained by modifying the anti-trapping current which is determined according to the asymptotic analysis[19]. In this way, the thin-interface behavior is quantitatively mapped to CGM kinetics, achieving the correlation between the PFM and the CGM in describing solute trapping and kinetic undercooling. The CGM provides a velocity-dependent partition coefficient[22]:
where VDCGM is the solute diffusive velocity, which is estimated to be of the order of 10-1-101 m/s and is considered as the ratio of the diffusion coefficient to the interatomic spacing.
To map the quasi-rapid solidification model to the CGM, it is necessary to match the PFM partition coefficient kPF(V) with the CGM partition coefficient kCGM(V). The non-equilibrium partition coefficient k(V) curves with different VDPF values are plotted, and the results are fitted with the k(V) curve of the CGM to obtain the most appropriate characteristic solute trapping velocity, i.e., VDPF = 0.31 m/s, as shown in Figure 1. The fitting results match well in the velocity range (10-2 < V < 100 m/s), which belongs to the category of quasi-rapid solidification, indicating that the phase-field model of quasi-rapid solidification converges to the CGM. Besides, the value of A determines the difference between the quasi-rapid solidification model and the equilibrium solidification model. If A = 0, the quasi-rapid solidification model will return to the equilibrium solidification model.
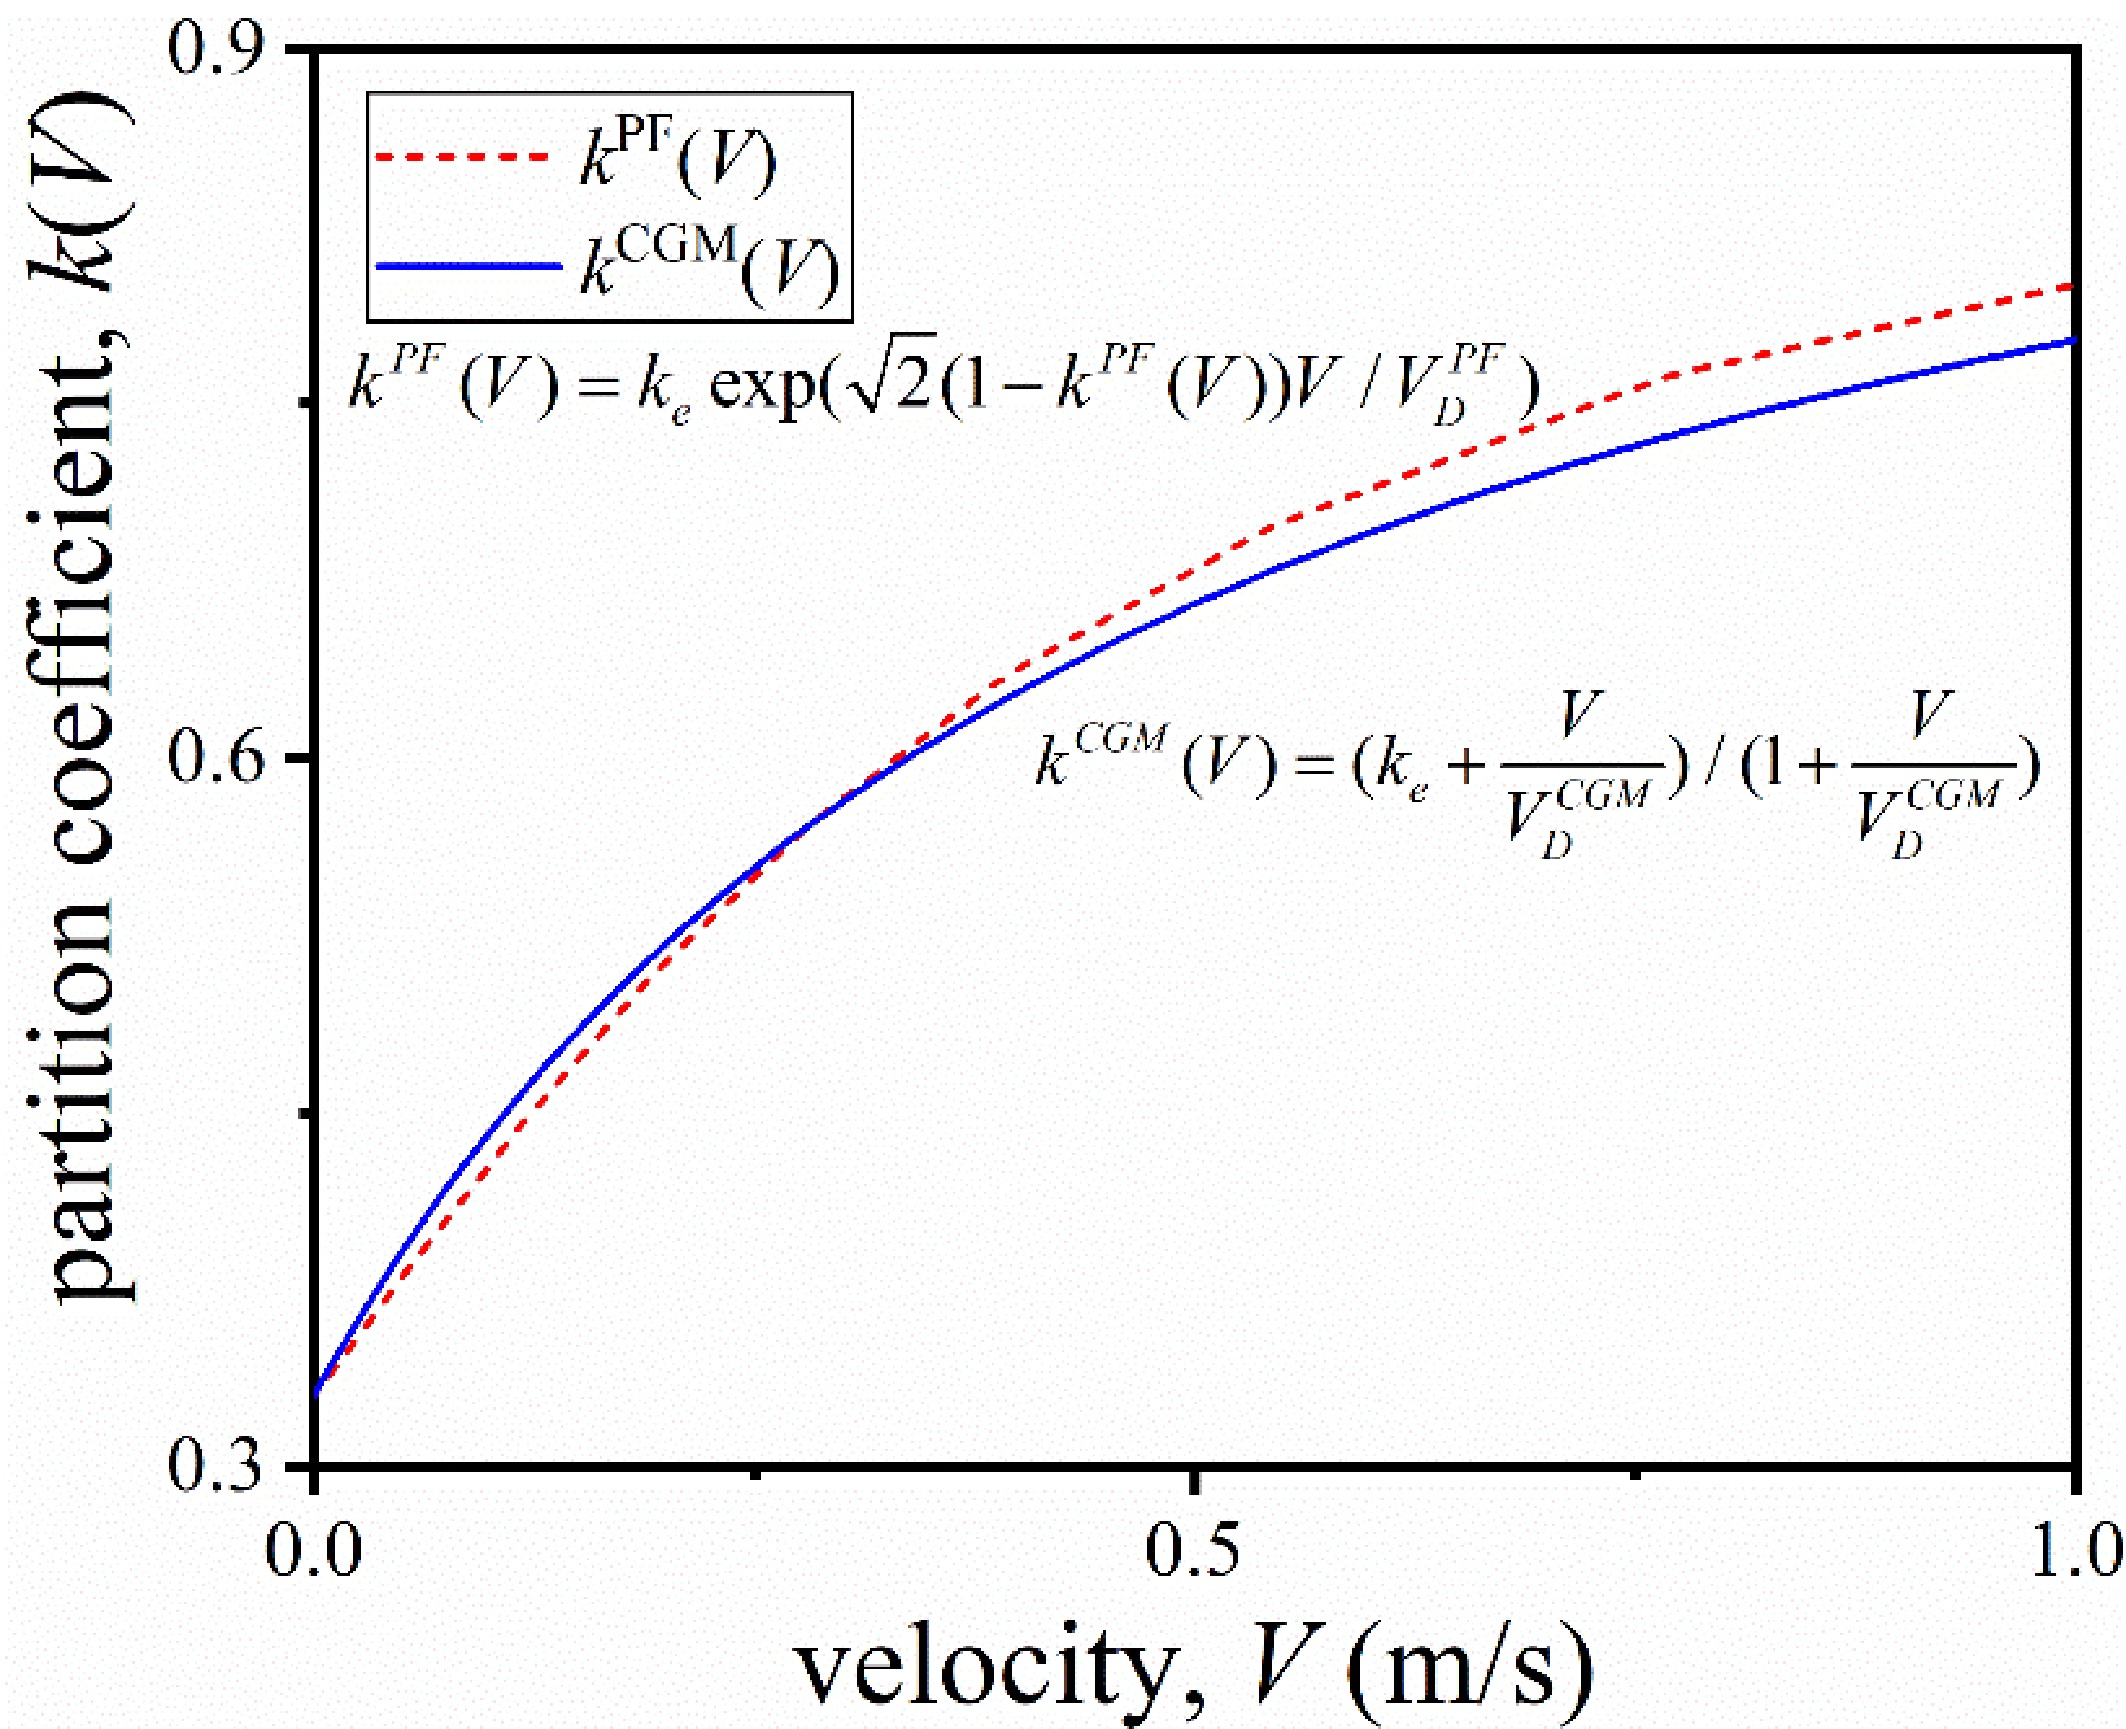
Figure 1. Determination of the partition coefficient kPF(V) in the PFM for Mg-6wt.%Al alloy. PFM: Phase-field method.
The cooling rate, defined as the rate of temperature decrease, is a key kinetic parameter in quasi-rapid solidification, and its implementation in the PFM is tied to temperature field evolution, which directly governs the thermodynamic driving force and the interface migration velocity. The domain temperature is updated by Δ = Δ0 - Rtstepdtτ, where Δ0 and Δ are the initial dimensionless undercooling and the time-varying dimensionless undercooling, R is the imposed cooling rate, tstep is the step number, and dt is the dimensionless time step during simulation. Since the unit of the input cooling rate is K/s, the factor τ is used to satisfy dimensional matching between the phase-field units and the real units.
Experimental method
The pure Mg (99.99 wt.%) and pure Al (99.99 wt.%) are used as raw materials to prepare Mg-6Al alloy ingots in the RPM-20-9 resistance furnace. The Mg-6wt.%Al alloy with low cost, high specific strength, and good castability is considered a promising candidate for Mg alloy gigacastings. The experimental procedures are as follows. The surface oxide scales of the raw materials are mechanically polished, and the materials are accurately weighed according to the composition ratio. The crucible and mold are pre-treated by drying and preheating. The melting furnace is preheated to 723 K for 1 h, after which the pure Mg is placed into the crucible and heated to 993 K, with a protective gas mixture of CO2:SF6 (volume ratio = 99:1) introduced to suppress oxidation. Once the Mg is completely molten, the pre-weighed pure Al is added to the crucible. After complete melting, the furnace is powered off, and the melt is stirred for 3 min to remove surface scum. The homogeneous melt is then held at 973 K for 30 min before being poured into a preheated mold. Following air cooling and demolding, the ingot ends are removed by wire electrical discharge machining to obtain a cylindrical ingot with a diameter of 40 mm and a height of 350 mm.
The key difference between quasi-rapid solidification and conventional solidification lies in the cooling rate. To validate and analyze the results of the quasi-rapid solidification phase-field model, the Mg-6wt.%Al alloy melts are solidified under three cooling conditions: furnace cooling, air cooling, and water cooling. A stainless steel thin-walled crucible is used as the mold for melt cooling, and a data acquisition system is employed to record the temperature curves during the solidification process and measure the cooling rates under different cooling conditions. A high-response K-type thermocouple is embedded at the ingot center to record temperature changes via a data acquisition system. The cooling rate during solidification is calculated as the slope of the temperature-time curve or the ratio of the temperature difference to the required time interval.
Due to the difficulty in directly observing dendrite evolution, a semi-solid quenching experiment [Figure 2] is designed: the alloy is first solidified at low cooling rates to a semi-solid state and then rapidly quenched in ice water to preserve the semi-solid microstructure. This method enables direct observation of microstructural features by instantaneously solidifying the remaining liquid phase. The semi-solid quenching furnace used in the experiment is shown in Figure 3.
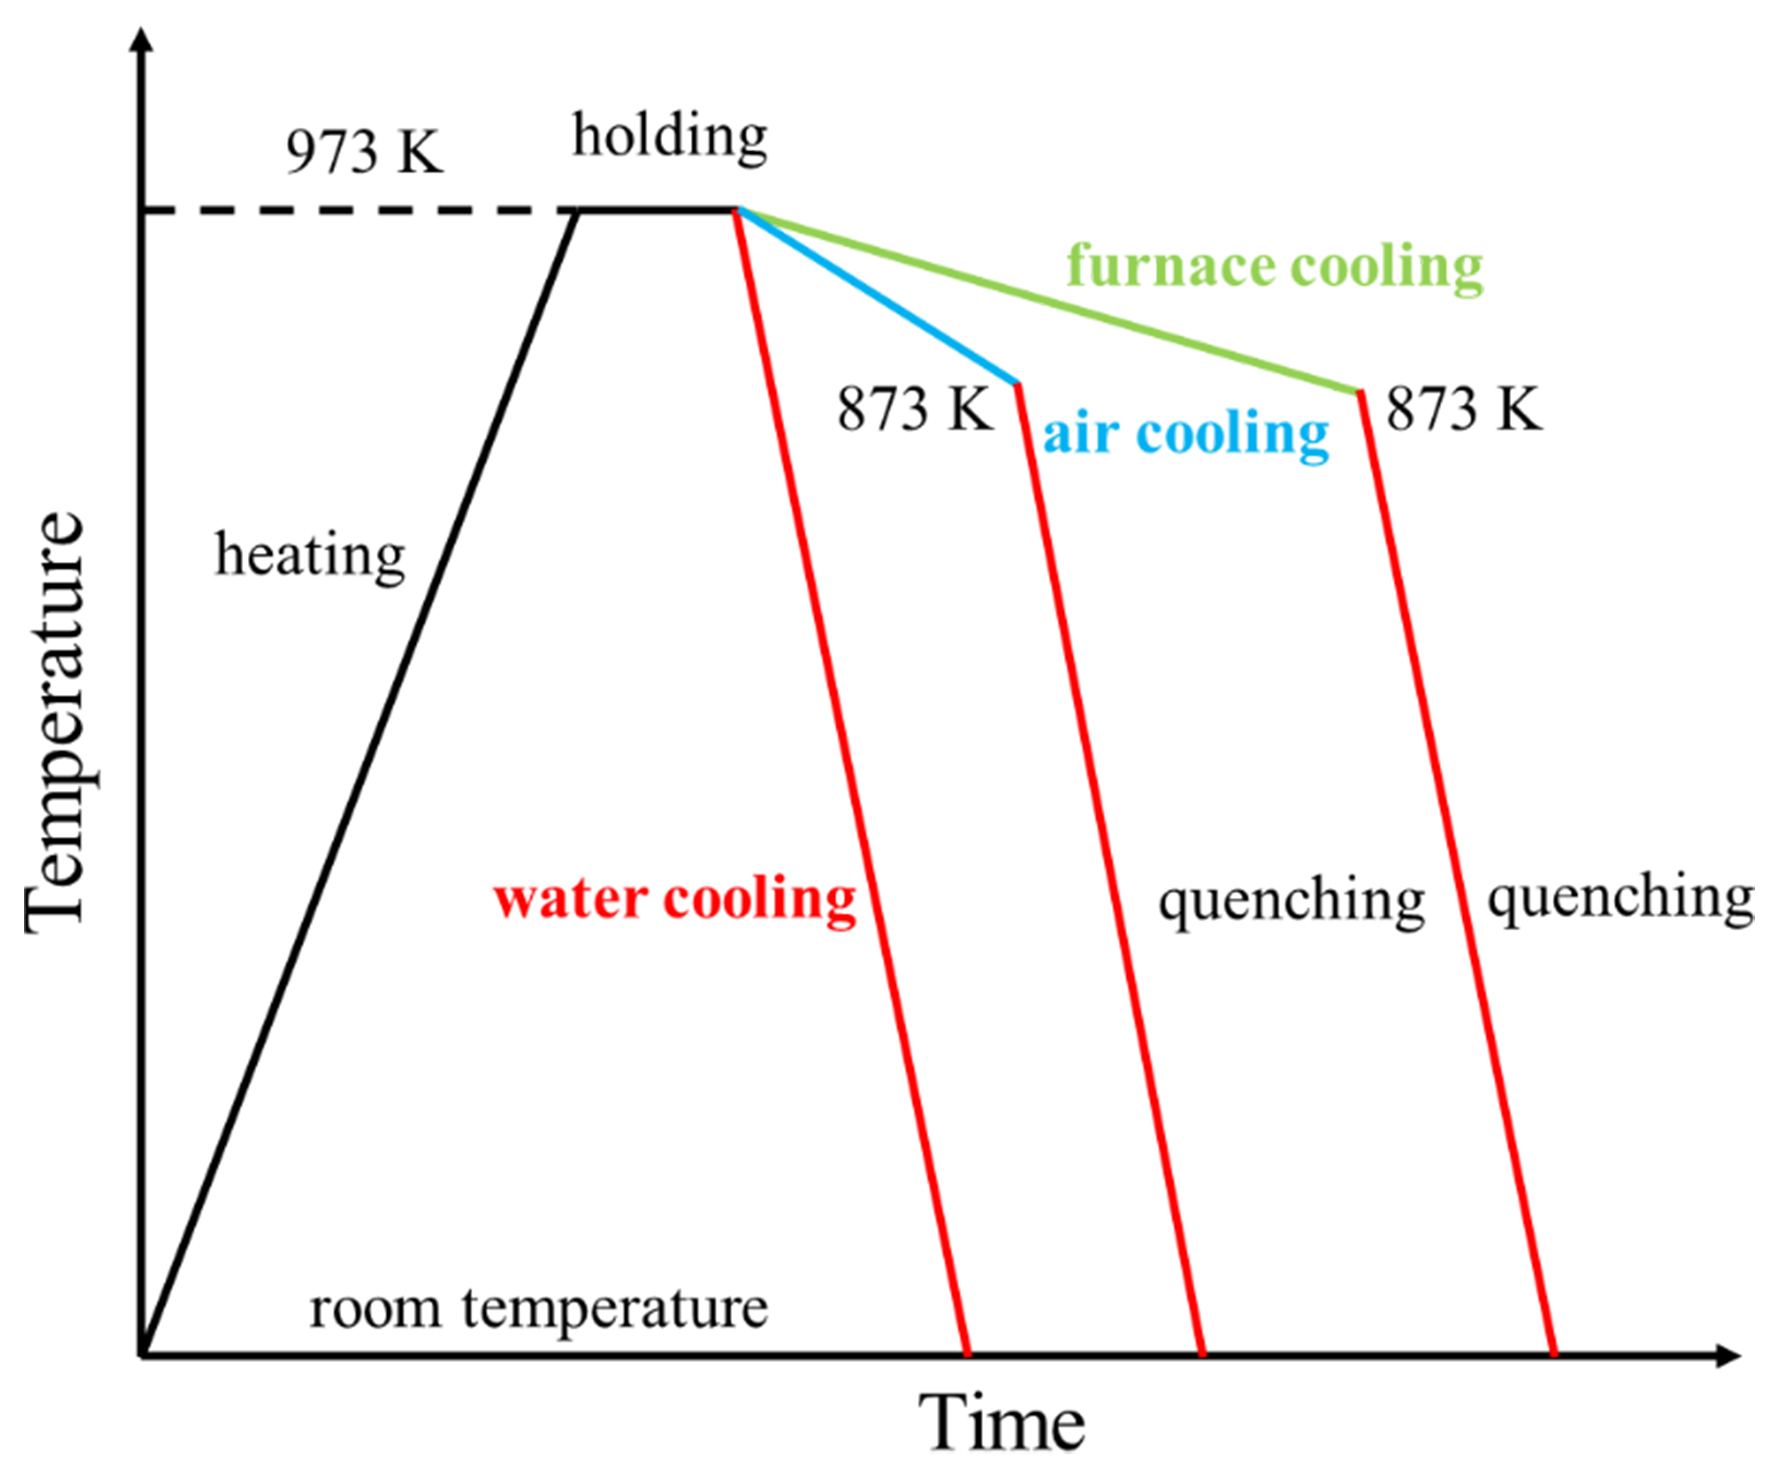
Figure 2. Schematic diagram of experiments with different cooling rates and semi-solid quenching experiment.
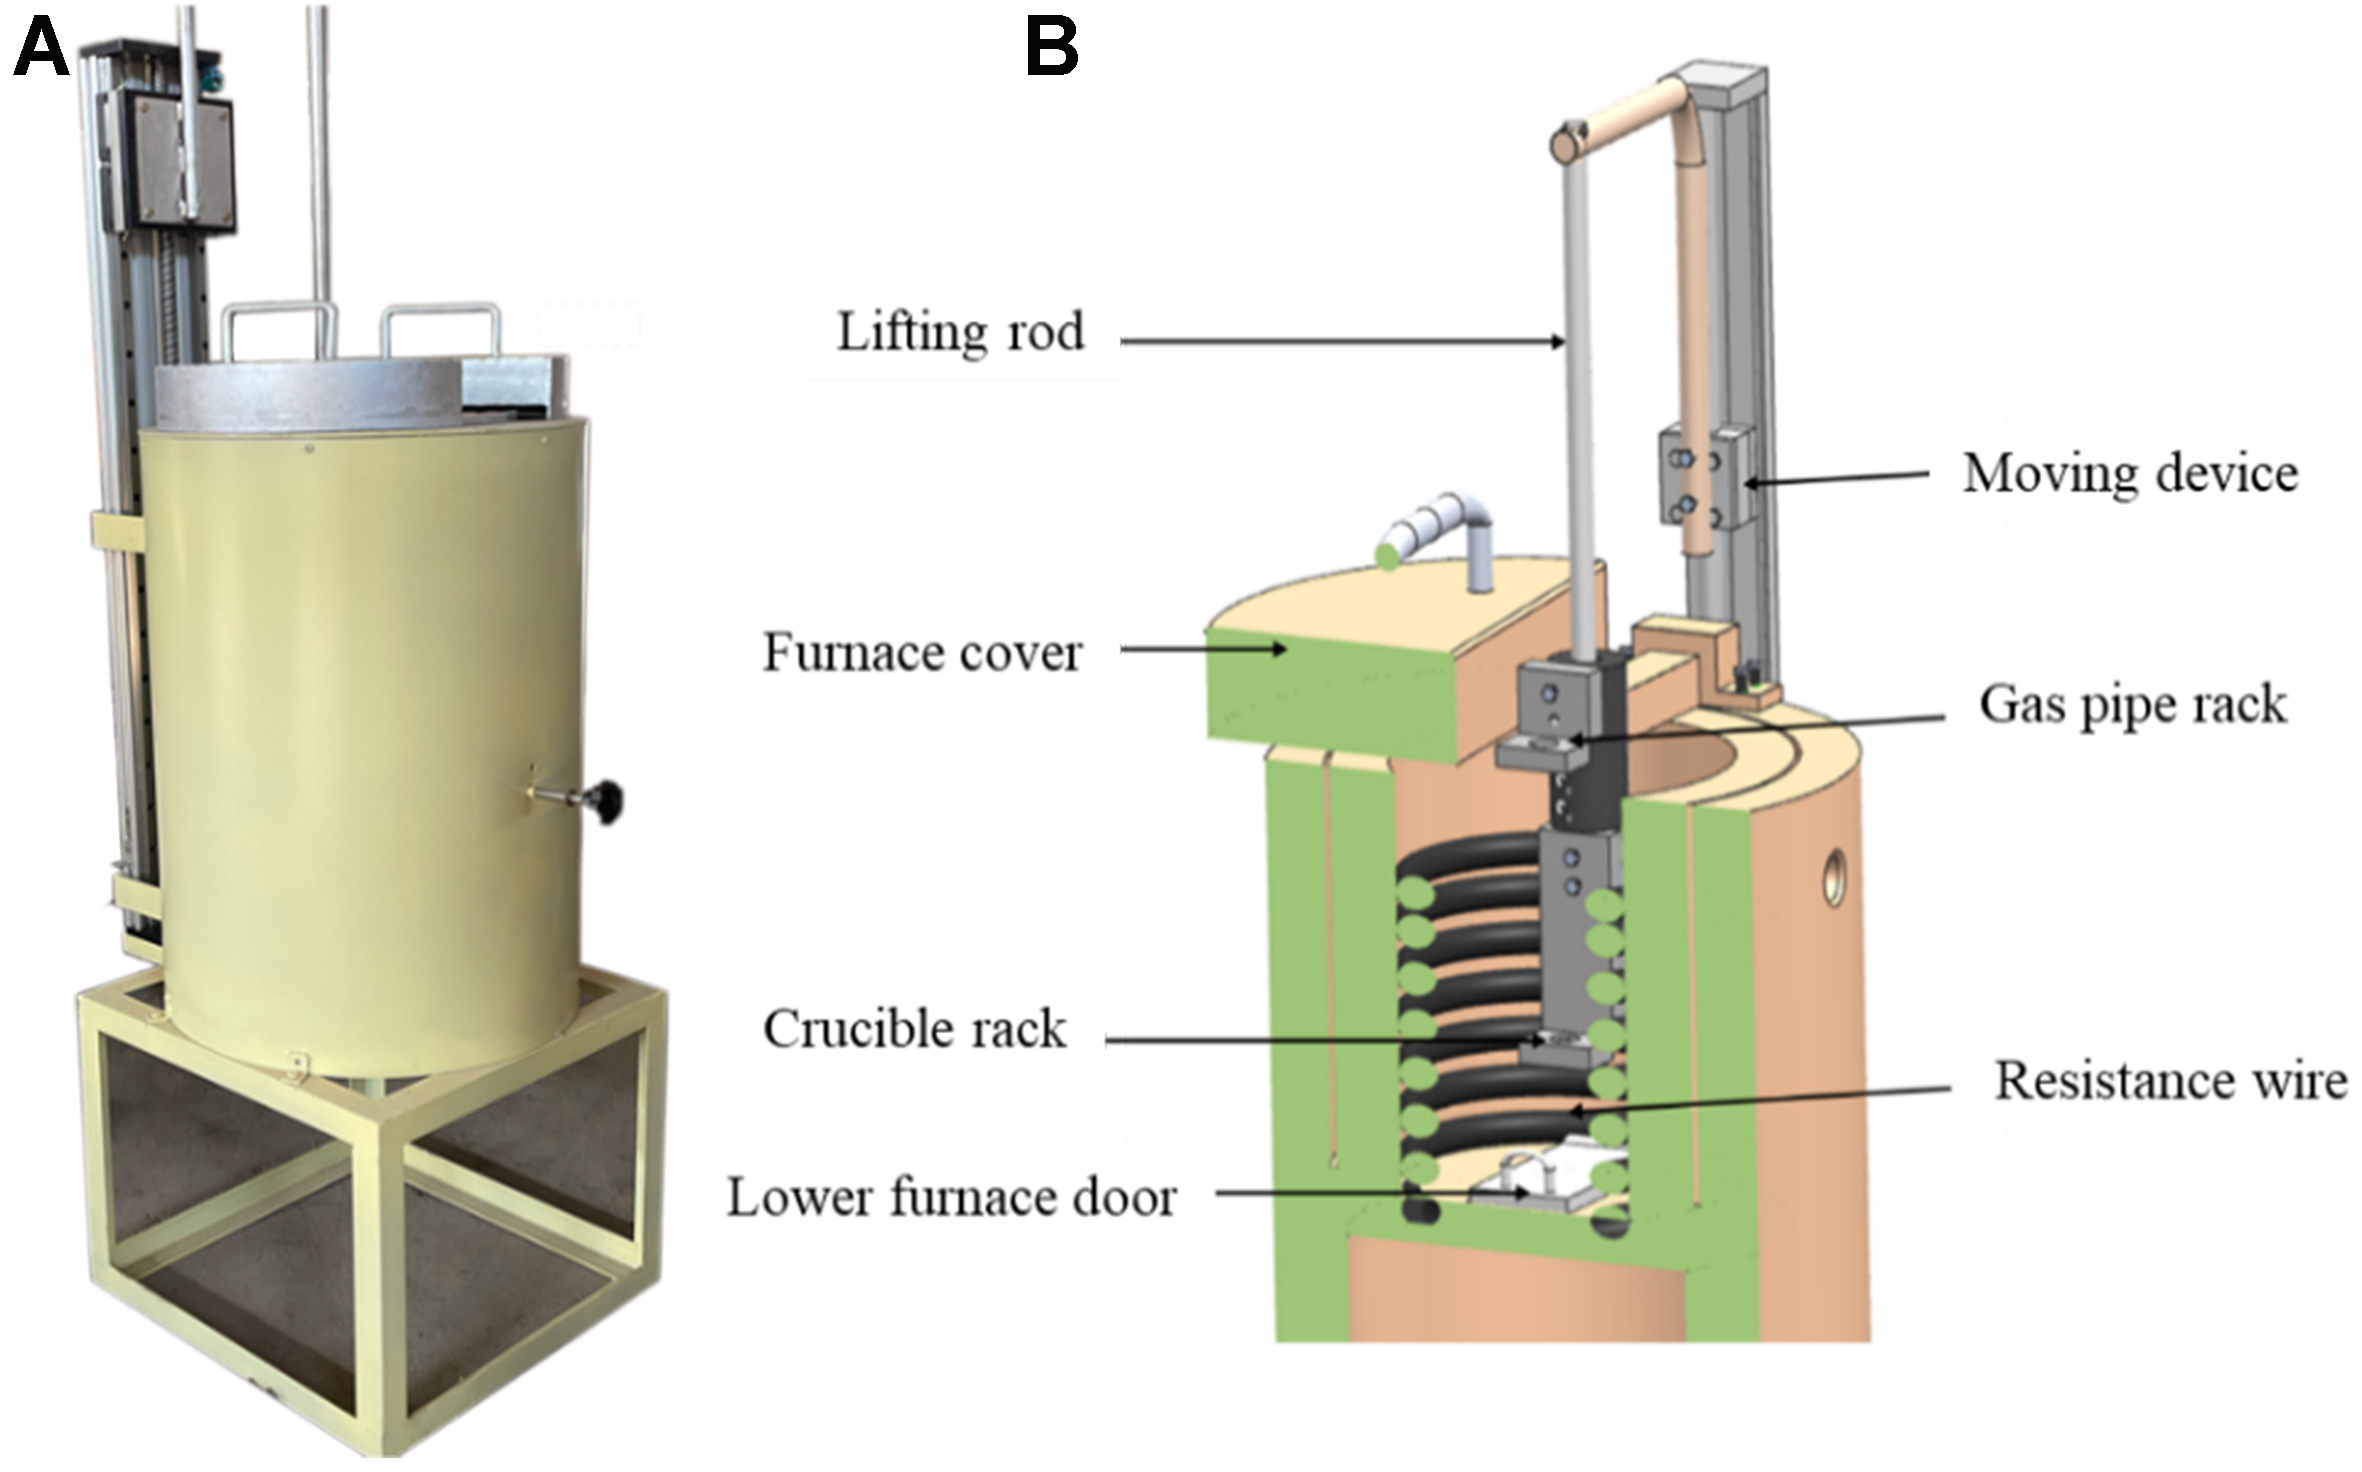
Figure 3. Semi-solid quenching furnace: (A) physical picture (photograph taken by the authors); (B) schematic diagram of the internal structure.
Microstructural morphologies and solute distributions are characterized to analyze the solidification behavior. The solidification microstructures of the samples are observed by optical microscopy (OM; ZEISS Axiovert 40 MAT) and scanning electron microscope (SEM; TESCAN VEGA 3 LMH). A back scattering electron (BSE) spectrometer and an energy dispersive spectrometer (EDS) are equipped in the electron microscope to determine the distribution of chemical elements and the elemental contents in specific regions of the alloy samples.
Validation
The model can be verified by comparing the partition coefficients obtained from the simulation results with the theoretical partition coefficients. Consistent with the CGM, two typical non-equilibrium conditions are considered for validation: full drag condition (solute trapping with solute drag) and zero drag condition (solute trapping without solute drag). Figure 4A shows the interpolation method for obtaining the solid and liquid concentrations at the solid-liquid interface. The partition coefficient is calculated by the ratio of the solid concentration to the liquid concentration. Figure 4B shows the variation of the simulated partition coefficient with the growth velocity. The partition coefficient does not change with the growth velocity under the equilibrium condition but increases with the tip growth velocity under the quasi-rapid solidification, which matches the theoretical values and validates the model.
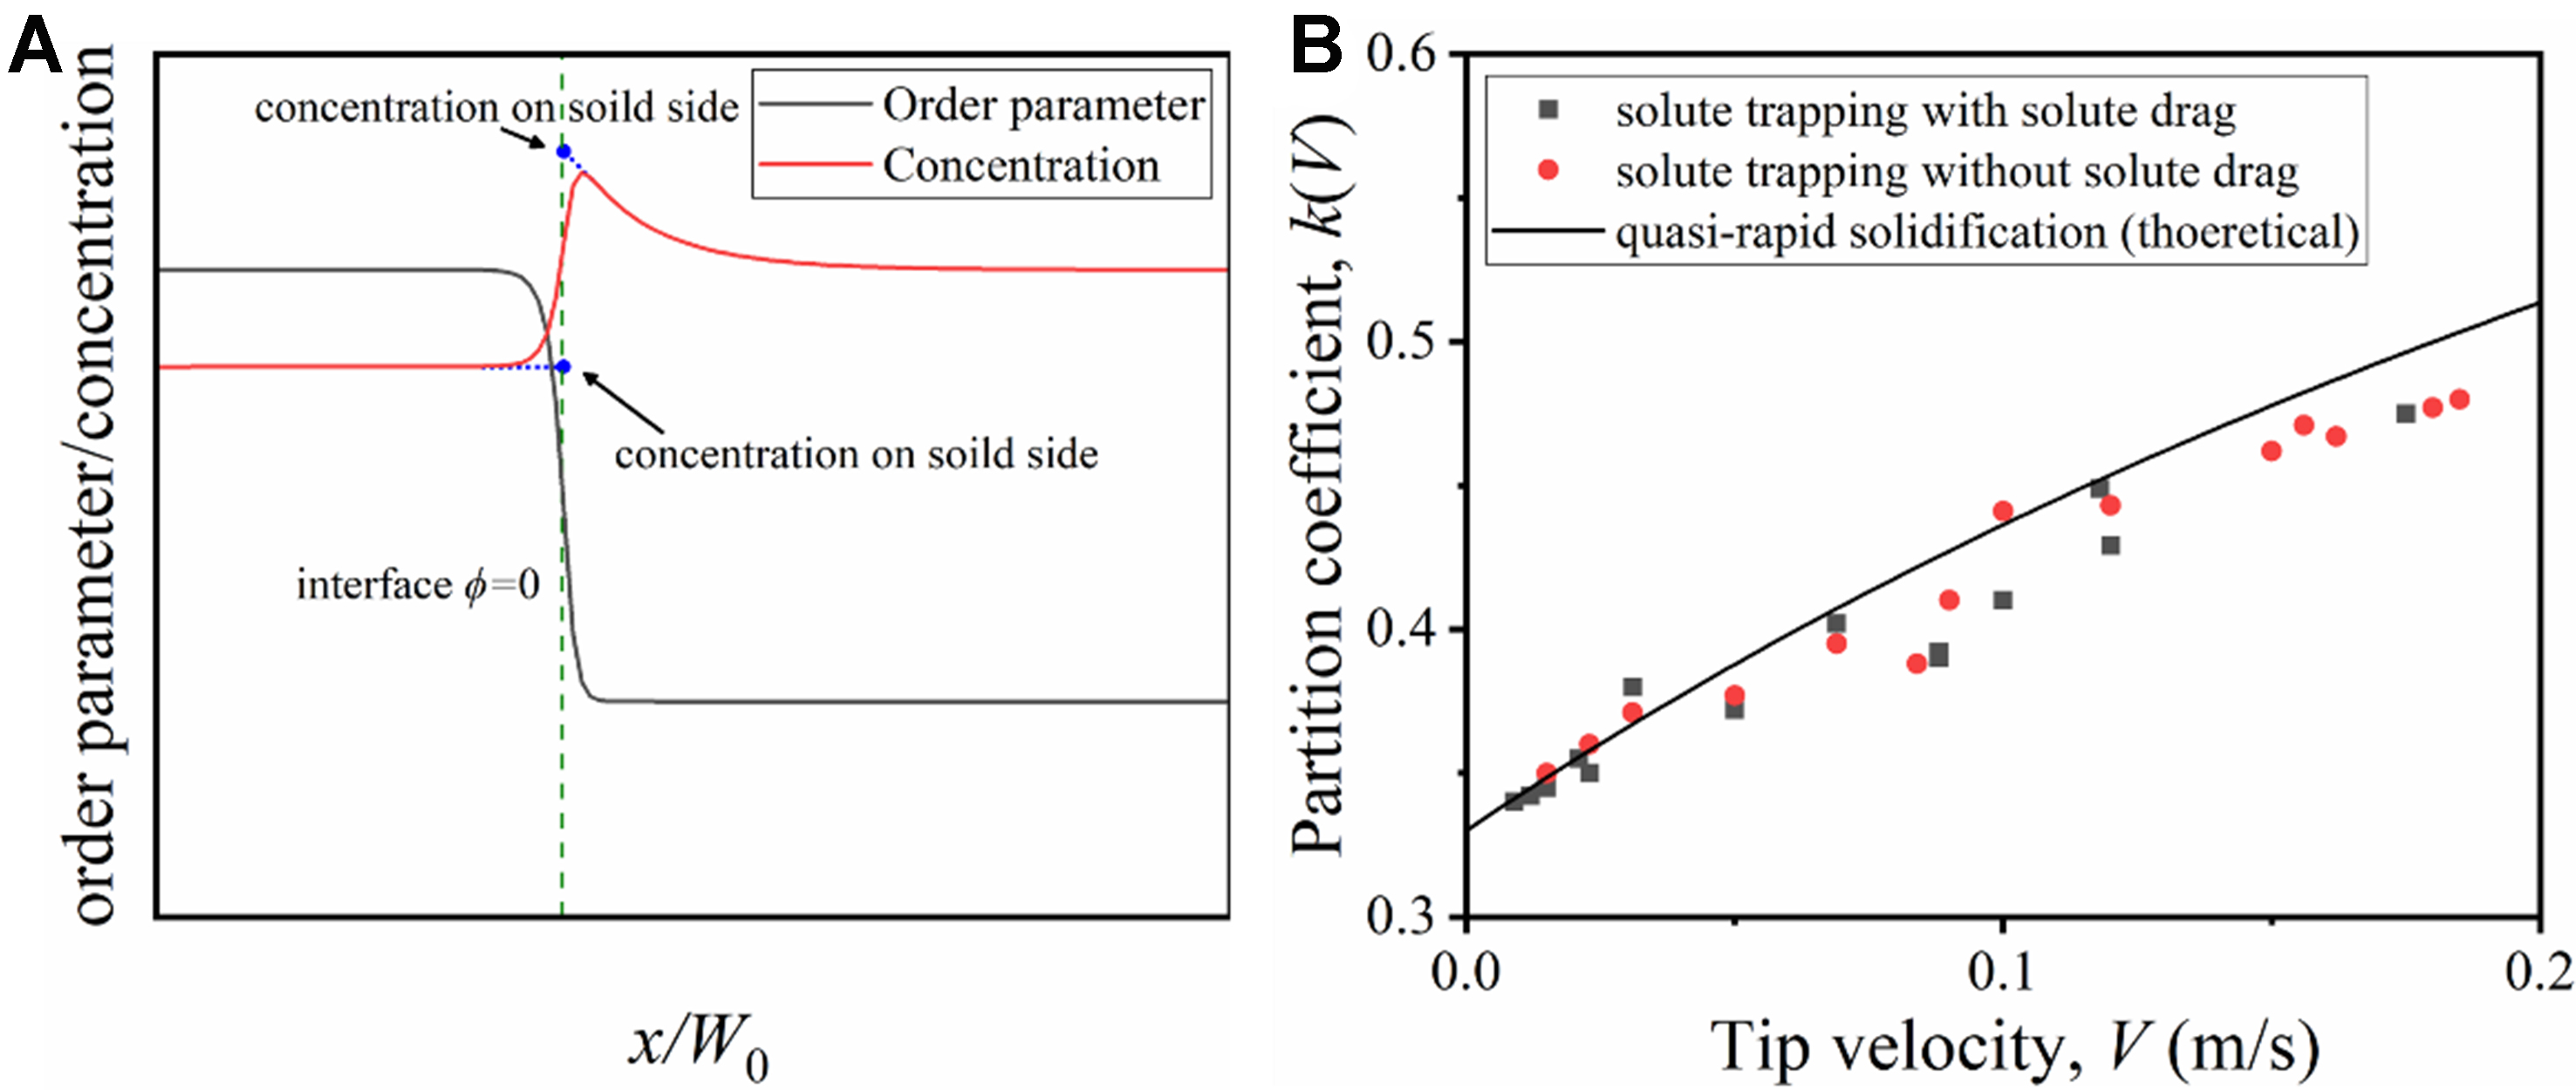
Figure 4. (A) Determination of the solid and liquid concentrations at the solid-liquid interface; (B) Comparison of simulated partition coefficients kPF(V) with theoretical partition coefficients.
It is noted that the tangent method in Figure 4A is mainly based on the physical nature of the PFM and its consistency with the CGM. In the PFM, the solid-liquid interface is described as a diffuse transition zone, rather than discontinuous interface in the sharp interface model. Within this diffuse zone (defined by the range of the order parameter ϕ: ϕ = -1 represents the liquid phase, and ϕ = 1 represents the solid phase), the solute concentration exhibits a smooth transition due to interface dynamic effects. The “maximum solute concentration near the interface” observed in the simulation may be affected by the transient solute accumulation in the diffuse interface zone, which is an inherent characteristic of the diffuse interface[23-25].
The core logic of designing the tangent method to extract the “bulk liquid phase concentration” is to utilize the linear concentration gradient in the transition zone on the liquid phase side of the diffuse interface: first, the position where ϕ = 0 is defined as the interface reference position; then, a tangent line is drawn to the solute concentration curve at ϕ = -1, and this tangent line is extrapolated to the interface reference position
The CGM model treats the interface as a sharp interface, with no transient solute accumulation. The use of the tangent method to obtain the liquid phase concentration can avoid incorrect estimation of this value caused by the solute trapping effect of the diffuse interface. This effectively reduces the deviation between the kPF(V) curve and the CGM theoretical kCGM(V) curve, as shown in Figure 4B.
RESULTS AND DISCUSSION
Results
Figure 5 shows the evolution of the equiaxed dendrite under the two typical non-equilibrium conditions. An isothermal solidification with a uniform dimensionless undercooling of Δ = 0.4 is set inside the computational domain. This condition is specifically designed to analyze the competitive effect of solute trapping and solute drag on dendrite morphology under a constant temperature. Each subplot in Figure 5 corresponds to different time (e.g., 4,000 dt, 8,000 dt) in the simulation. The dendrite arms extend outward with continuously discharged solute and decreasing dendrite tip radius. The dendrites show typical six-fold symmetry patterns, and the rejected solute from the solid dendrite accumulates near the interface, causing significant solute accumulation in the interdendrite root.
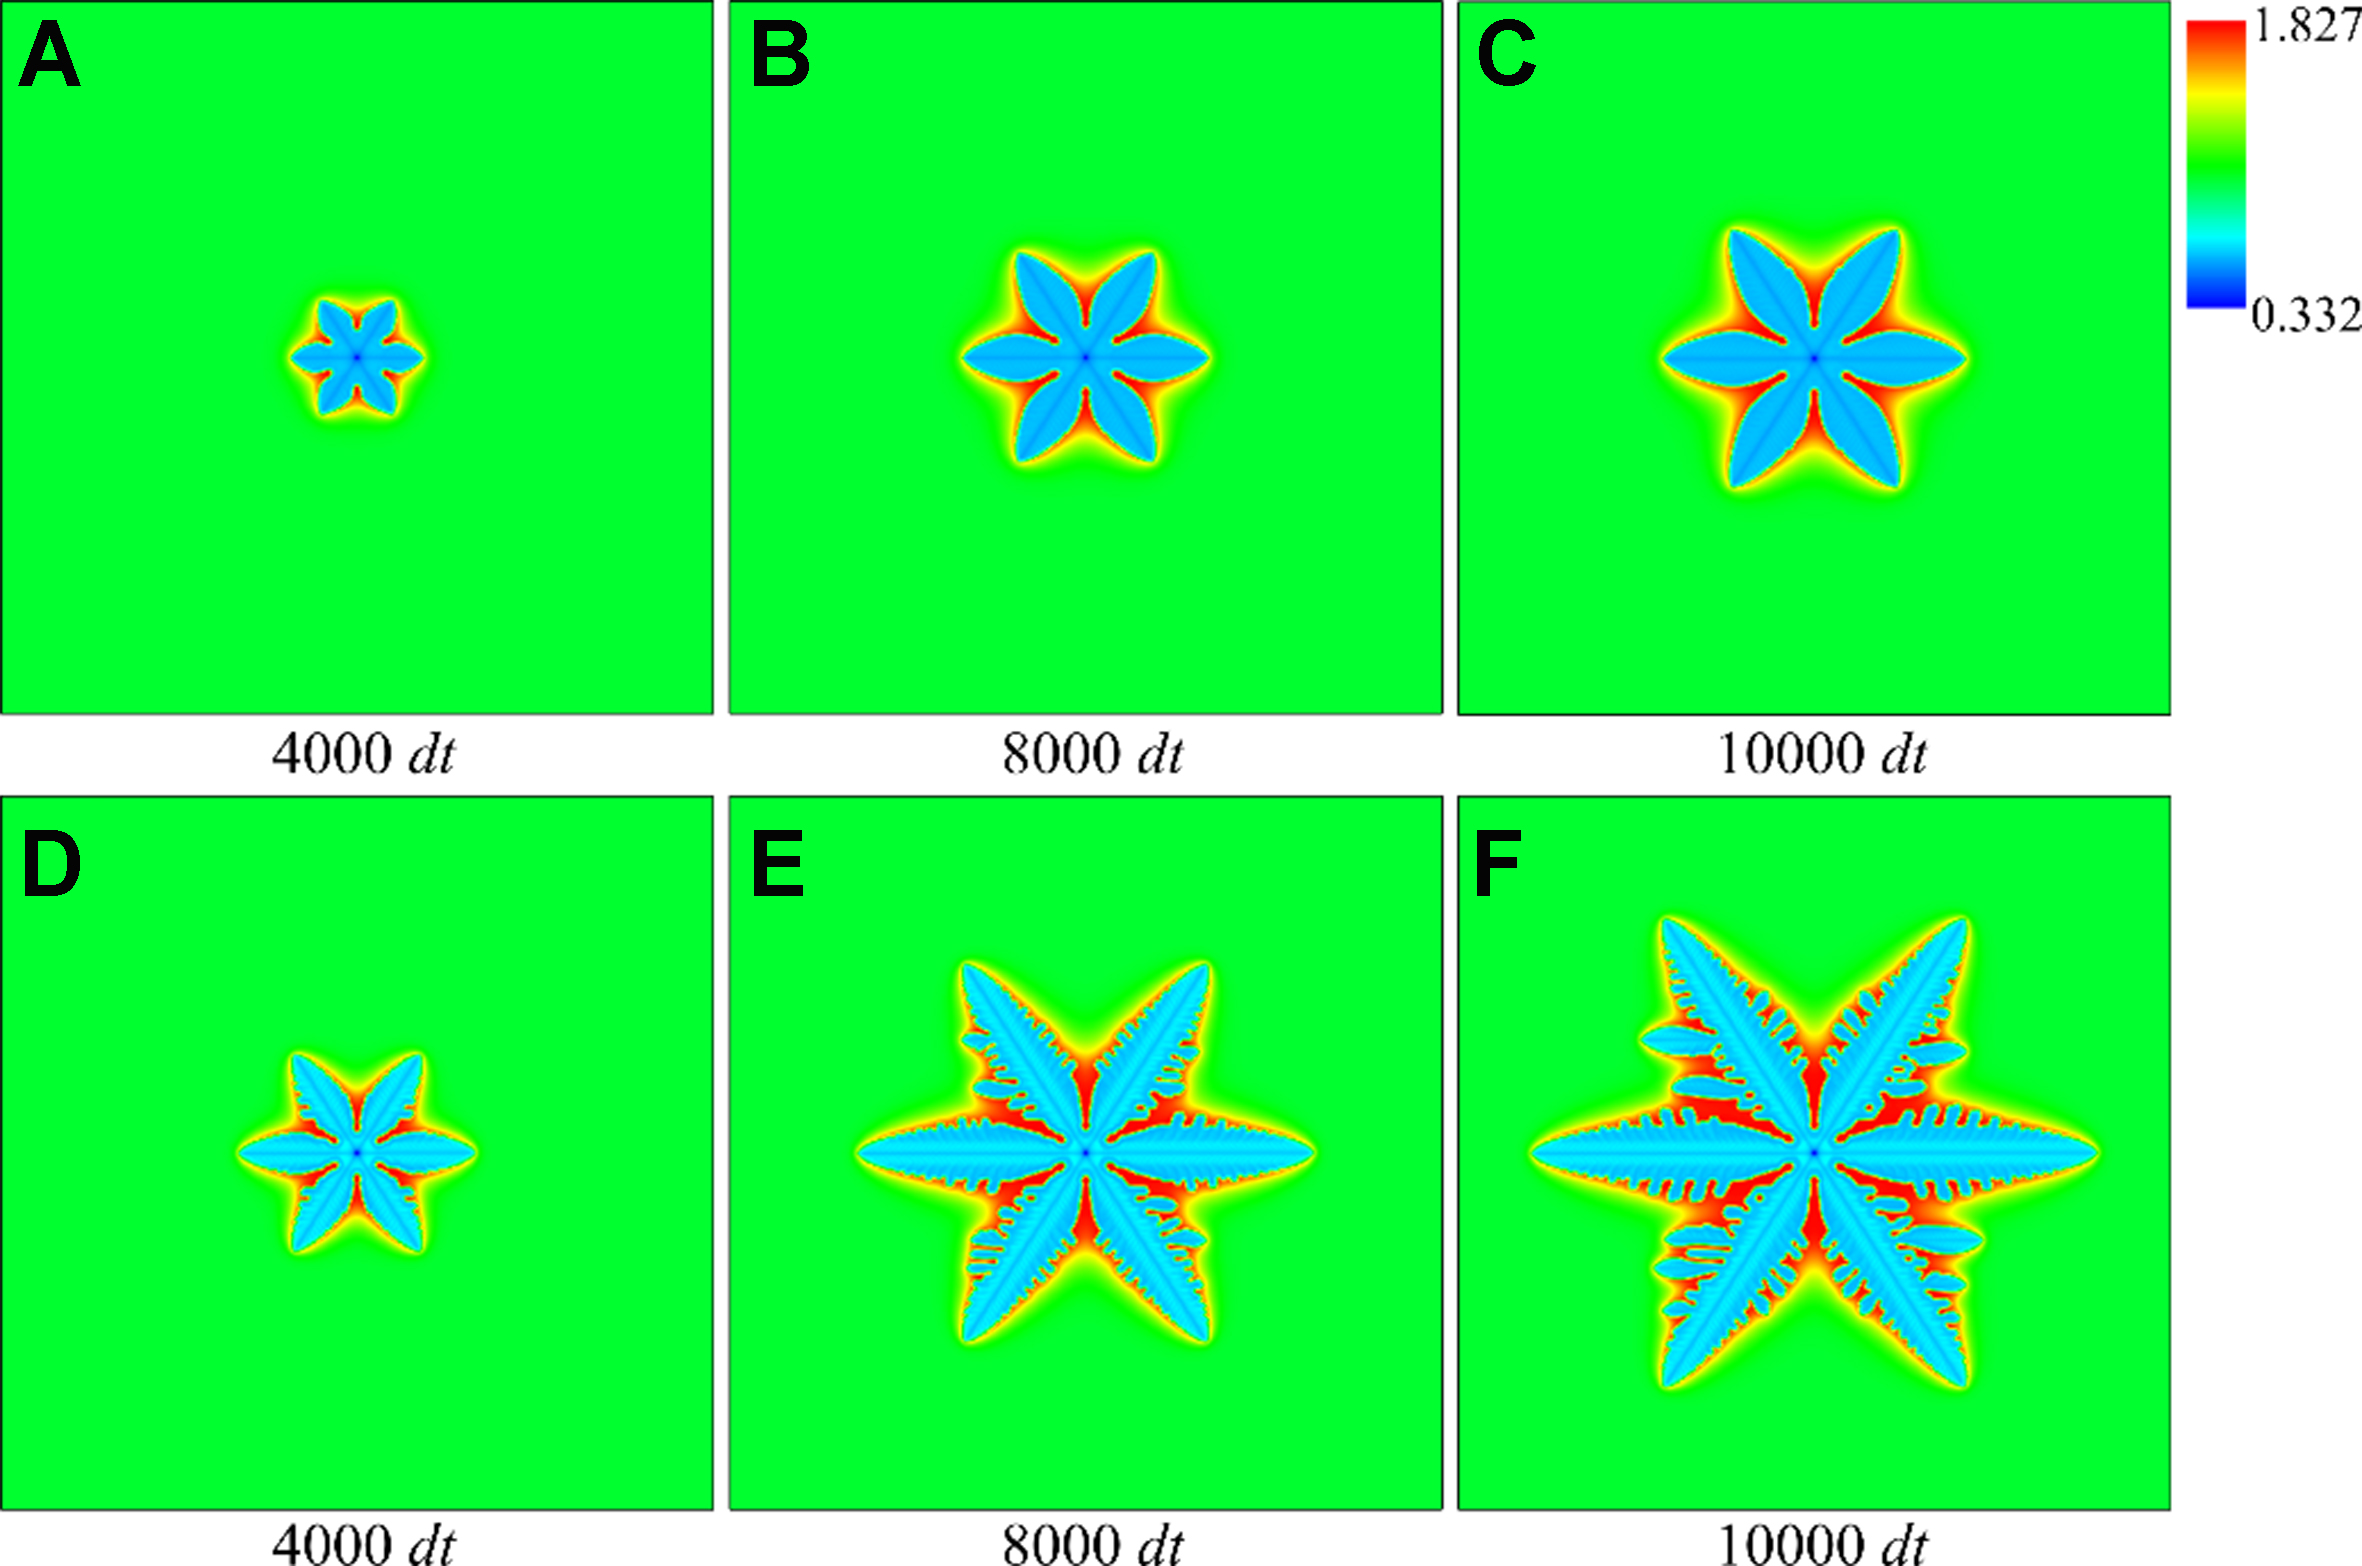
Figure 5. Morphology and solute distribution of equiaxed dendrites at different times: (A-C) solute trapping with solute drag; (D-F) solute trapping without solute drag.
The primary dendrite arms exhibit stable growth with negligible secondary branching under full drag condition, as the solute diffusion dominates the interfacial dynamics [Figure 5A-C]. As a comparison, the solid-liquid interface is unstable, and obvious secondary dendrite arms appear on the primary dendrite arms under zero drag condition [Figure 5D-F].
Figure 6 shows the evolution of the columnar dendrite under the two conditions. A fixed temperature gradient of G = 488 K/mm is imposed along the vertical direction, with the cold end at the domain bottom (dimensionless temperature Δ = 0.3) and the hot end at the top (Δ = 0.2). At the beginning of solidification, a layer of solid phase is set at the domain bottom, and the solid phase grows in the direction of heat flow in the form of the planar interface. After a period of time, the interface instability is triggered due to the interaction between the temperature gradient and the concentration diffusion, and small bulges are produced on the planar interface until the planar interface transforms into columnar dendrite growth morphology. As the solidification proceeds, the columnar dendrites compete with each other. The growth velocity of the columnar dendrites in favorable positions is faster, which reduces the evolution space of adjacent columnar dendrites. The solute continues to diffuse outward from the solid columnar dendrites, resulting in serious solute enrichment between the columnar dendrites. In the later stage of solidification, the number of the remaining columnar dendrites is much lower than that in the early stage, and the remaining columnar dendrites have more space to grow and are more likely to produce secondary branches.
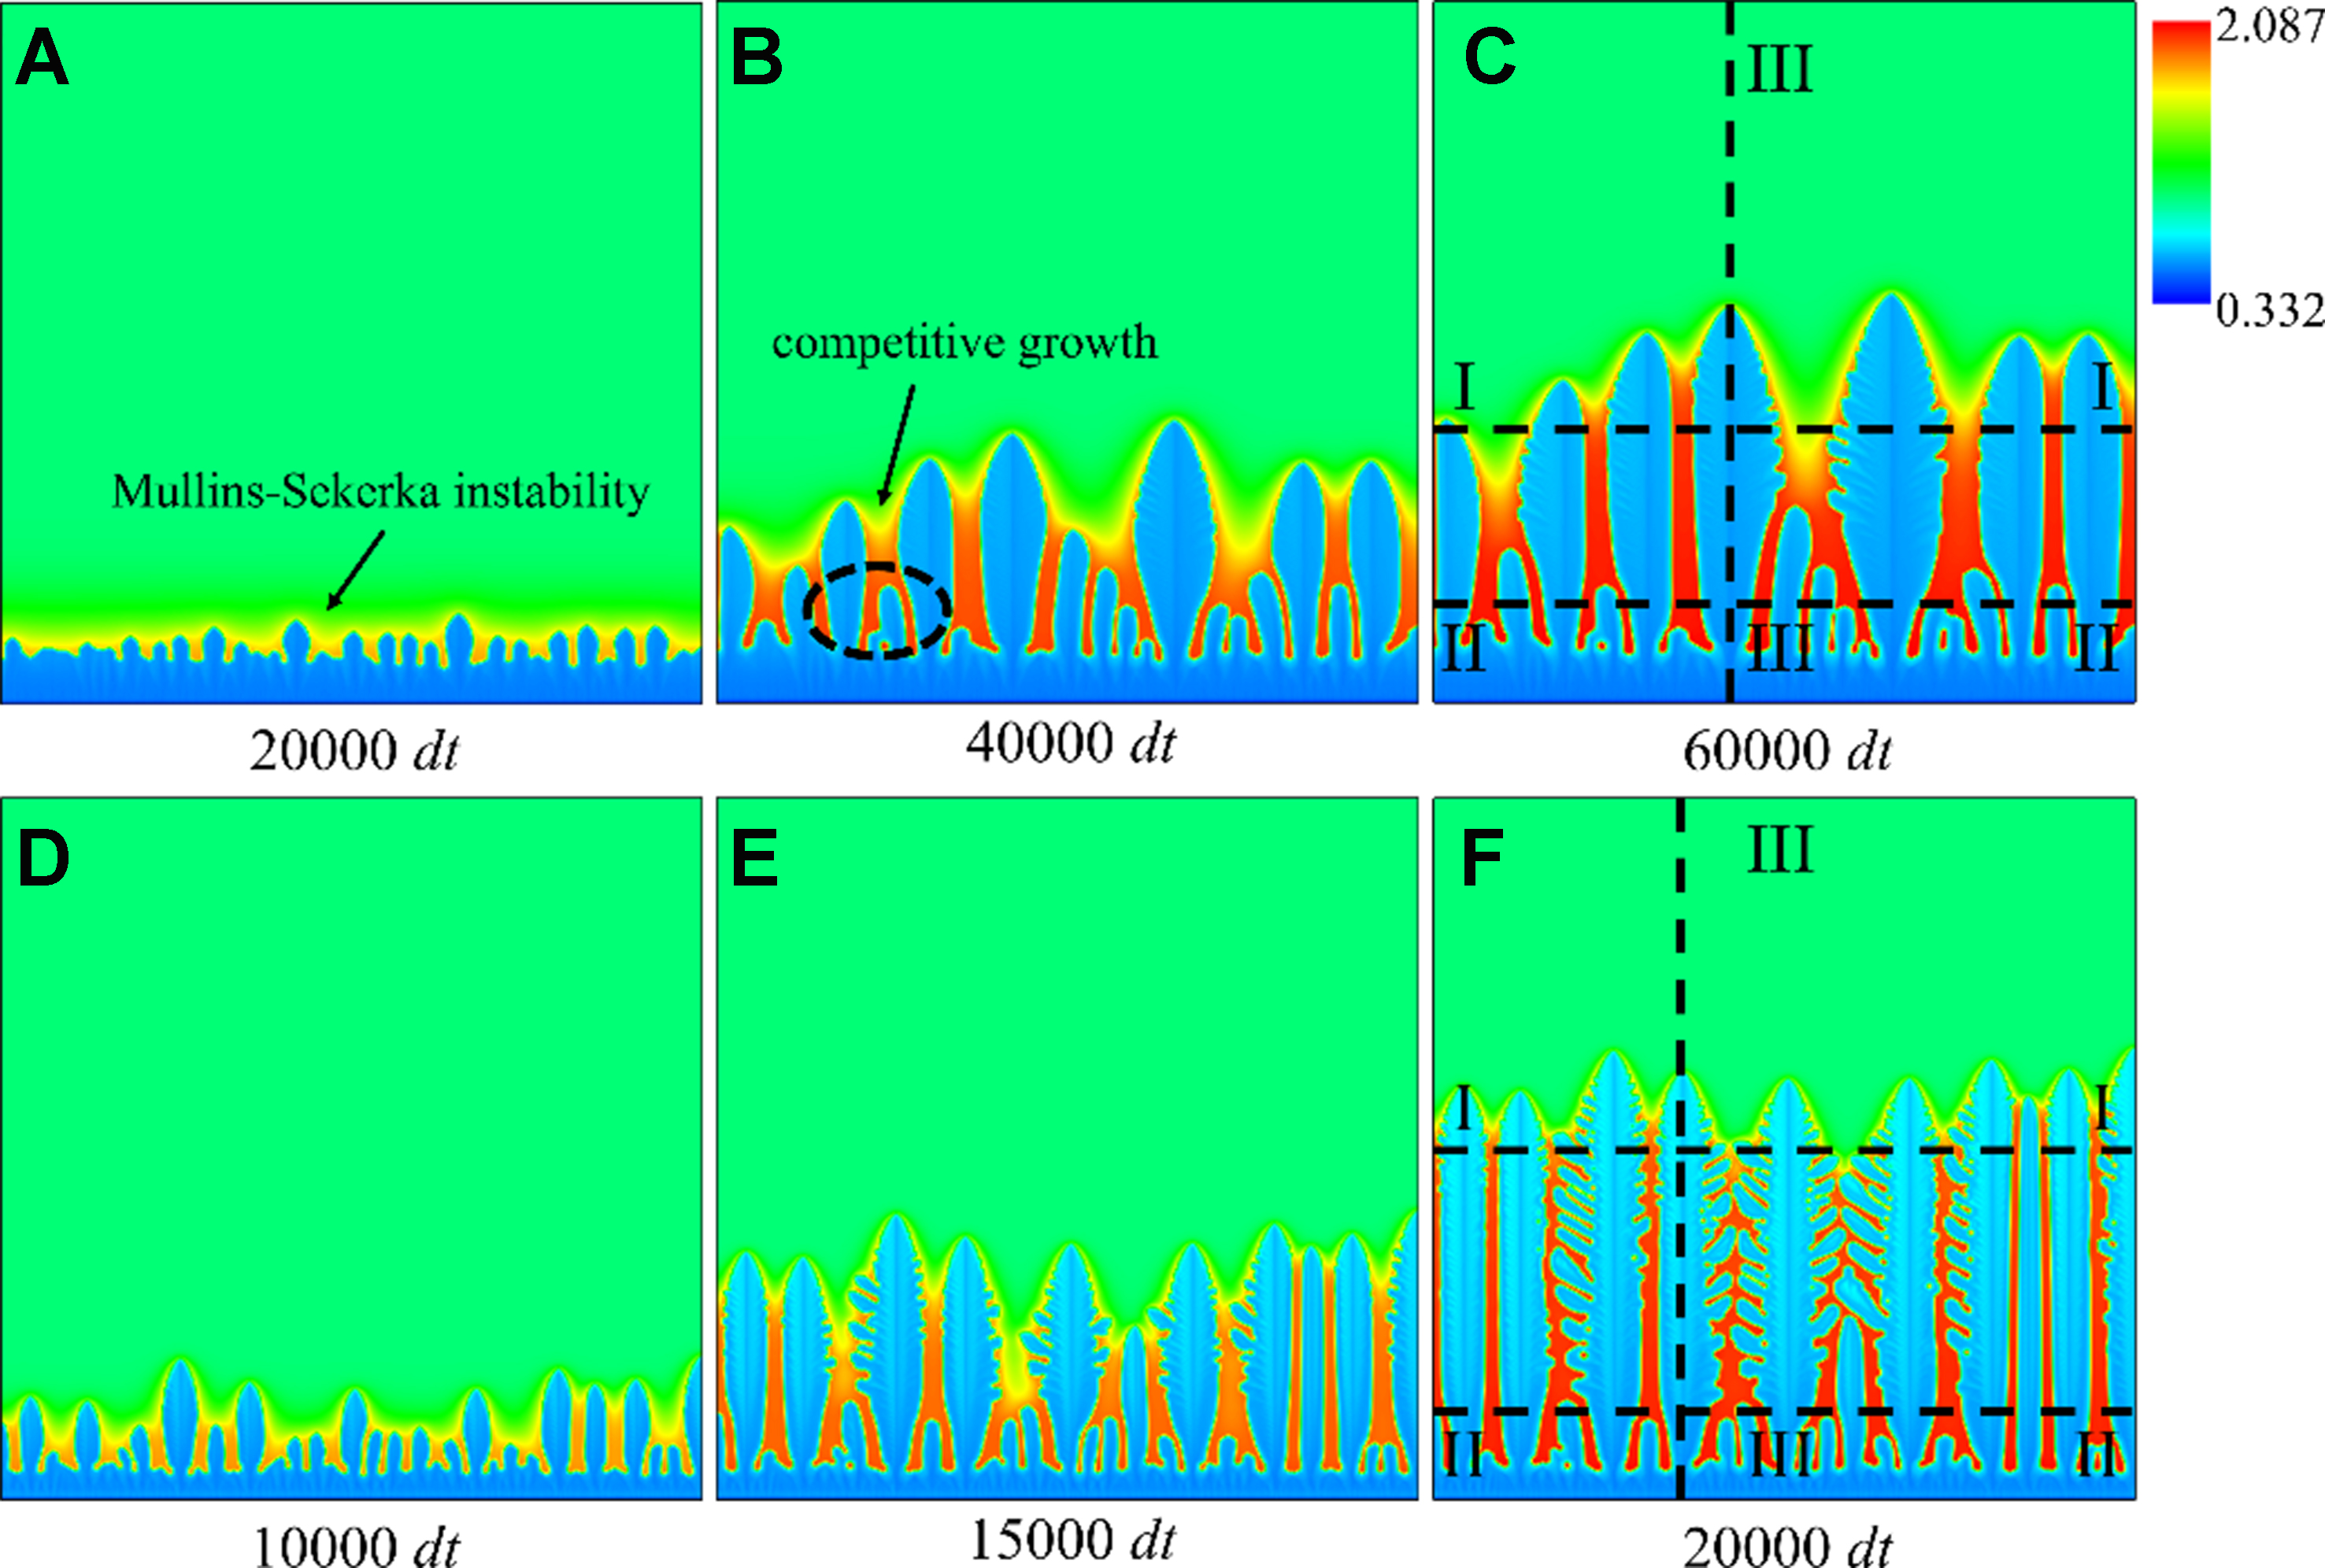
Figure 6. Morphology and solute distribution of columnar dendrites at different times: (A-C) solute trapping with solute drag; (D-F) solute trapping without solute drag.
The consideration of both solute trapping and solute drag in Figure 6A-C coarsens the columnar dendrite arms, increasing the trunk width and tip radius. The primary dendrite arm spacing (PDAS) is larger, and the number of the secondary dendrite arms is fewer. When the solute drag is not incorporated, the growth of the columnar dendrites is accelerated, and the faster solidification velocity makes the columnar dendrites grow preferentially in the direction of heat flow, forming slender but denser columnar dendrite array. The solute trapping without solute drag also intensifies the instability of the interface, and large numbers of secondary dendrite arms with an included angle of 60° to the primary trunks are formed, as shown in Figure 6D-F.
Figure 7A shows the solute distribution along the domain horizontal centerlines in Figure 5C and F. The solute trapping accelerates the dendrite growth and increases the solid concentration inside the solid phase, while the solute drag competes with the solute trapping, transferring the solute from the solid phase to the liquid phase and reducing the interface movement velocity. Figure 7B and C shows the solute distribution along the horizontal lines I-I and II-II in the top and bottom regions of the columnar dendrites and the vertical lines III-III inside a single columnar dendrite. The solute is heavily enriched in the bottom region, and the local concentration in the bottom region is twice as much as the initial concentration. Whether in equiaxed dendrites or columnar dendrites, the solid concentration under the conditions only considering solute trapping is always higher than that under the conditions also incorporating solute drag. This further verifies the crucial impact of non-equilibrium effects on the solute redistribution during quasi-rapid solidification.
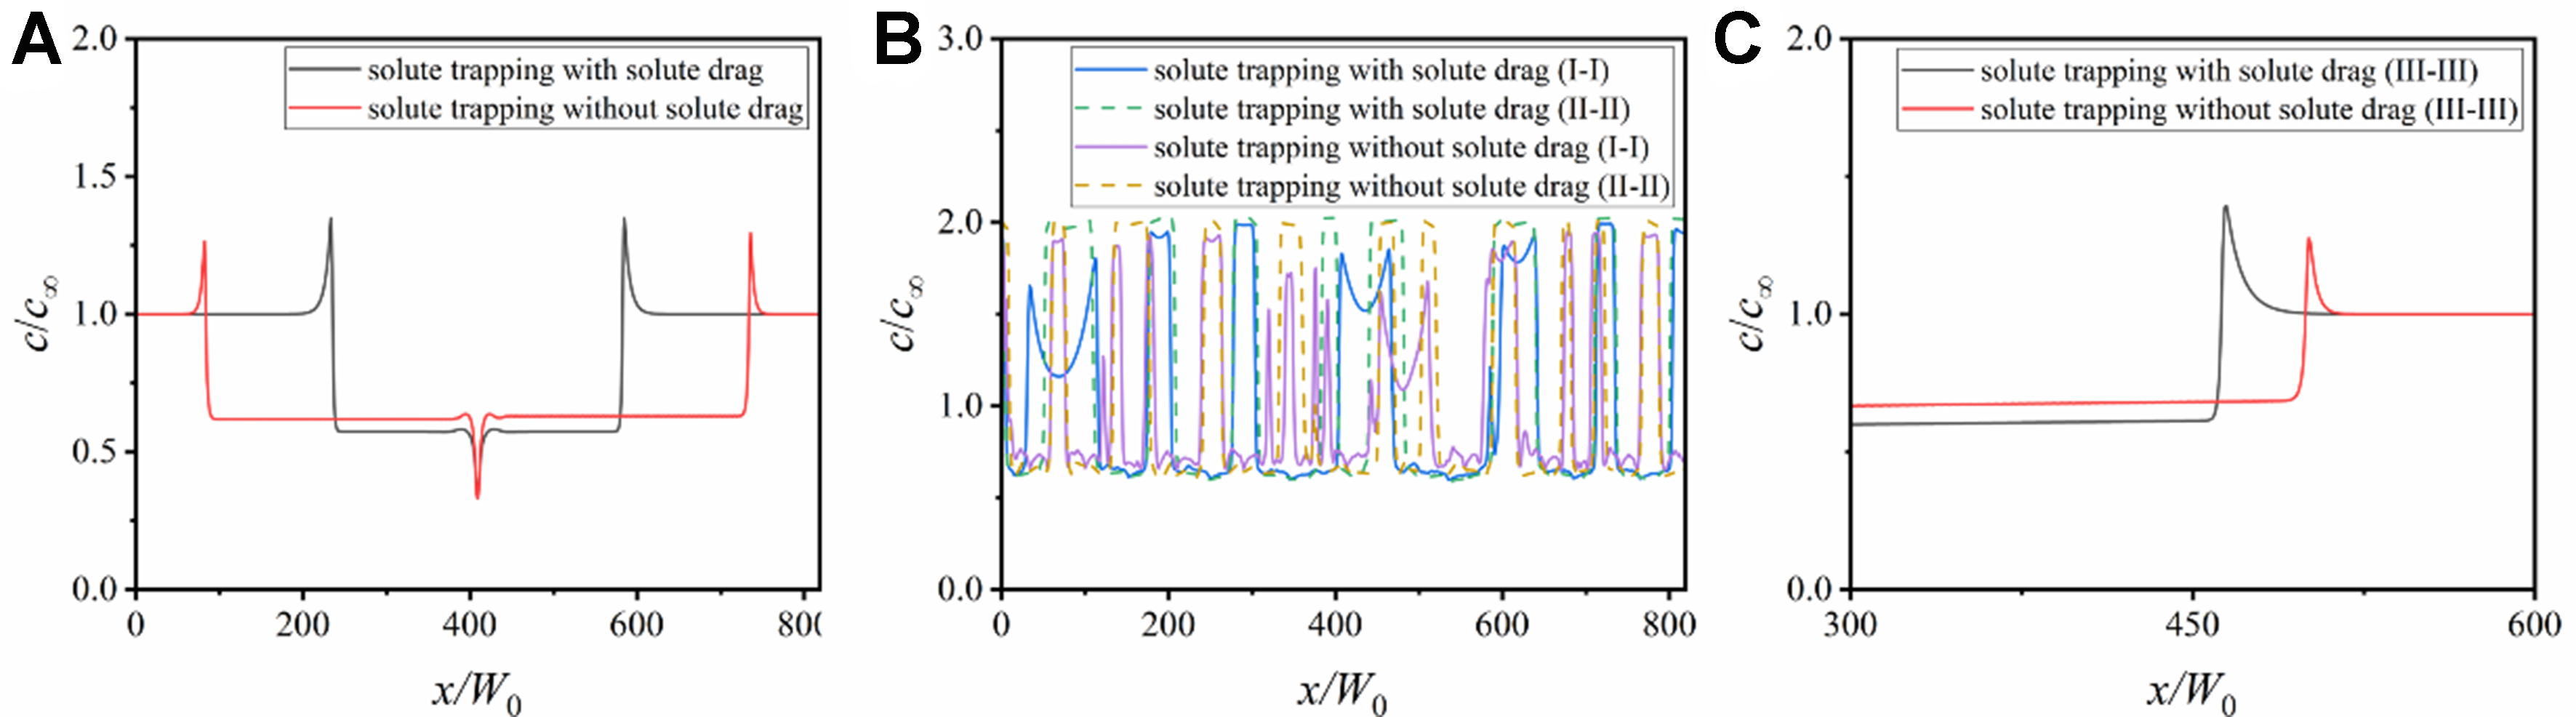
Figure 8 shows the variation of the tip growth velocity with time. At the beginning of solidification, the dendrite growth velocity is the fastest but decreases rapidly, and then the dendrite growth velocity remains stable. The solute trapping accelerates dendrite growth, while the solute drag has the opposite effect on the interface migration; thus, the growth velocity under the full drag condition is lower than that under the zero drag condition.
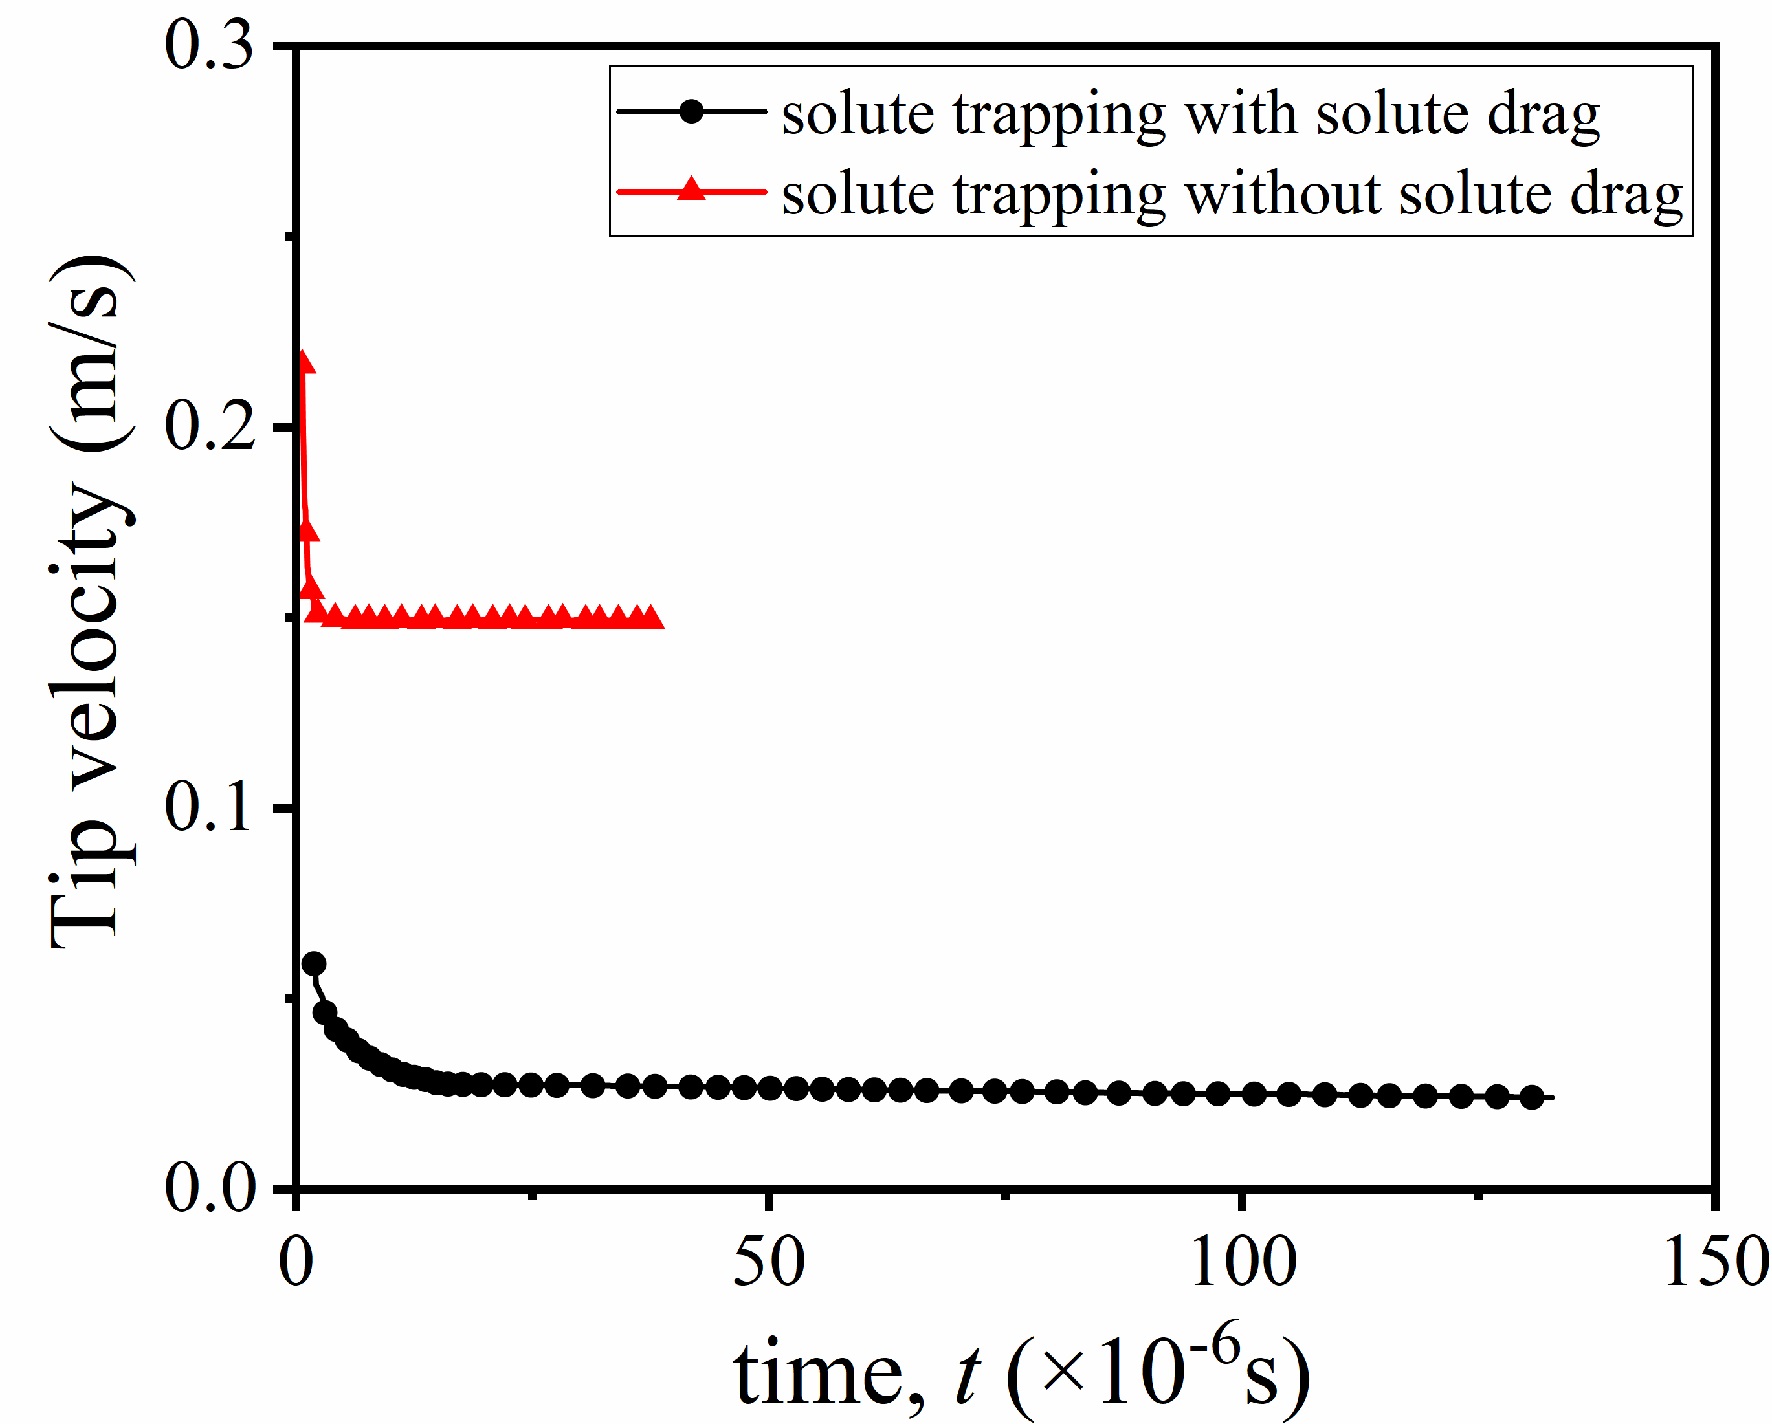
Figure 8. Comparison of dendrite tip growth velocity under the two conditions.
Discussion
Effect of undercooling
Figure 9 shows the equiaxed dendrite morphology and solute distribution under different undercoolings at
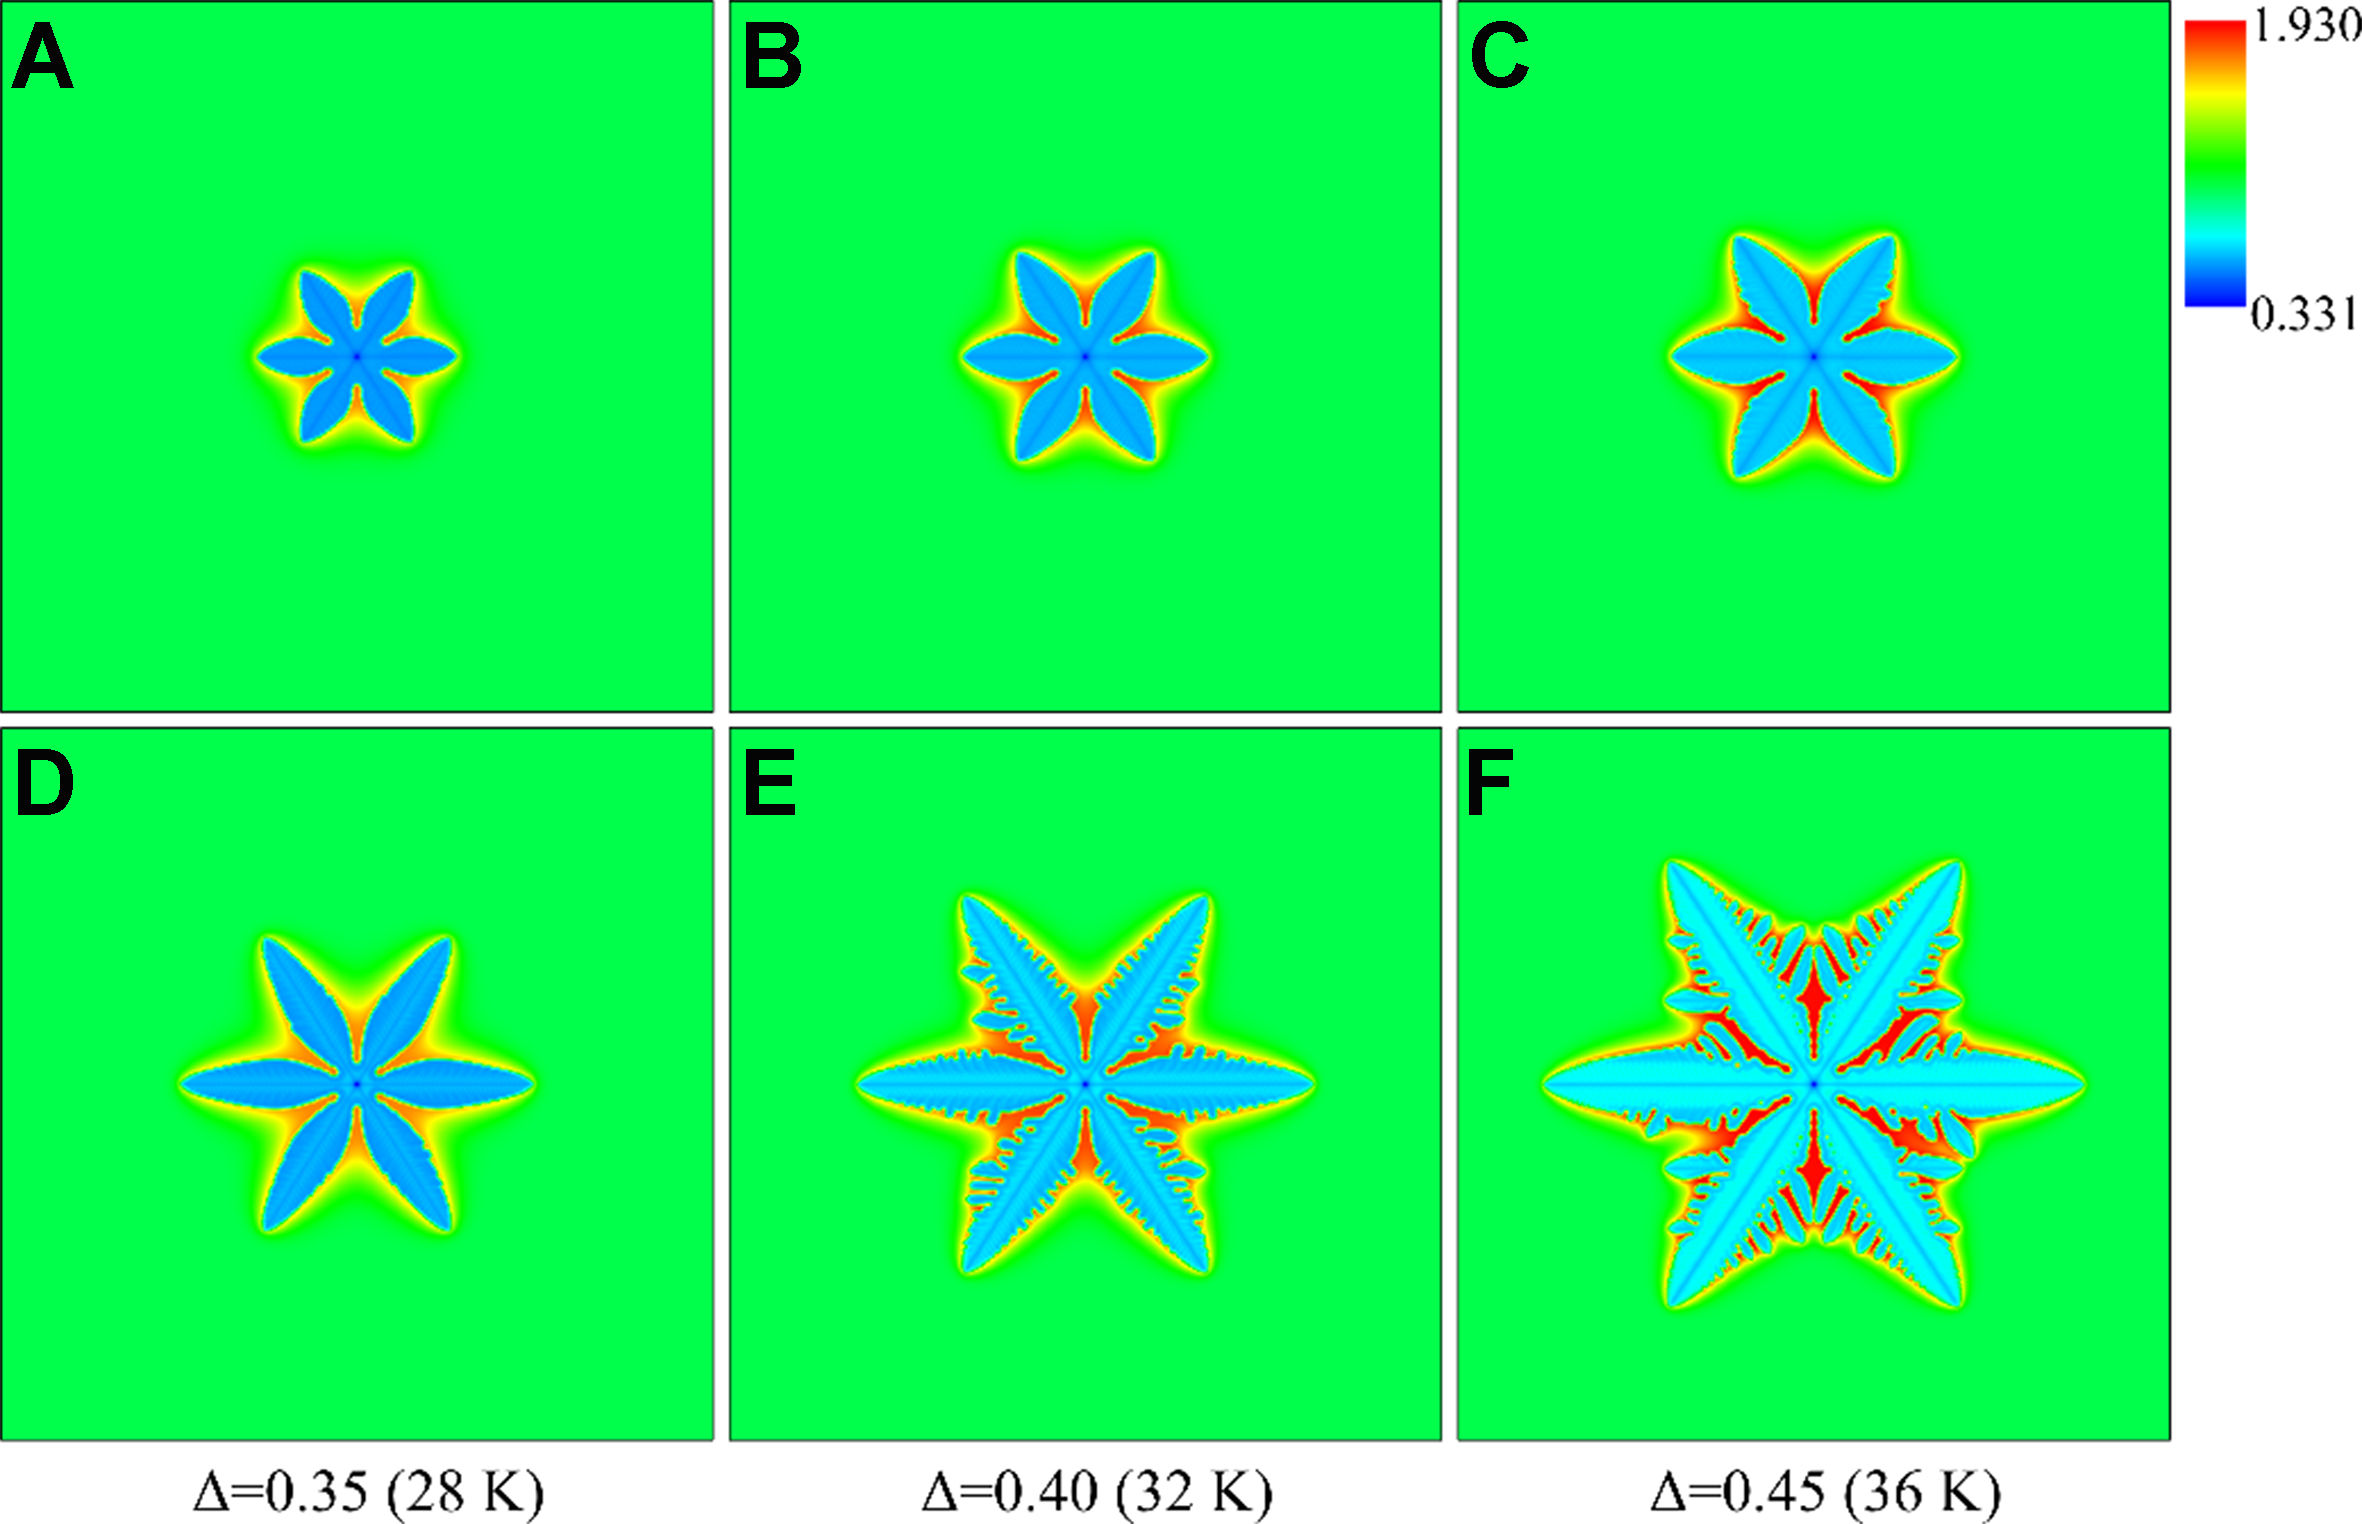
Figure 9. Morphology and solute distribution of equiaxed dendrites under different undercoolings: (A-C) solute trapping with solute drag; (D-F) solute trapping without solute drag.
The dendrite growth velocity increases with the undercooling under the two non-equilibrium conditions, but the difference between the two conditions changes with the undercooling. When the undercooling is large (e.g., Δ = 0.8), the measured steady-state growth velocity under the zero drag condition is 0.4 m/s, while that under the full drag condition is 0.1 m/s. If the undercooling is small (e.g., Δ < 0.2), the difference in the growth velocity is also small between the two conditions due to insignificant non-equilibrium effects under small undercoolings.
Figure 10 shows the solute distribution along the domain centerlines in Figure 9. The width of solute diffusion layer decreases with the increase of undercooling under the two conditions, because the elevated undercooling increases the solute trapping capacity by accelerating dendrite growth, thereby reducing the diffusion time of solutes ahead of the solid-liquid interface. The insufficient diffusion of solute atoms during quasi-rapid solidification leads to the rapid enrichment of solute atoms at the solid-liquid interface, accelerating the formation of constitutional undercooling. A smaller width of the diffusion layer under the zero drag condition corresponds to easier constitutional undercooling. Thus the narrower solute diffusion layer and the larger constitutional undercooling contribute to the formation of more developed dendritic structure under the zero drag condition in Figure 9F.
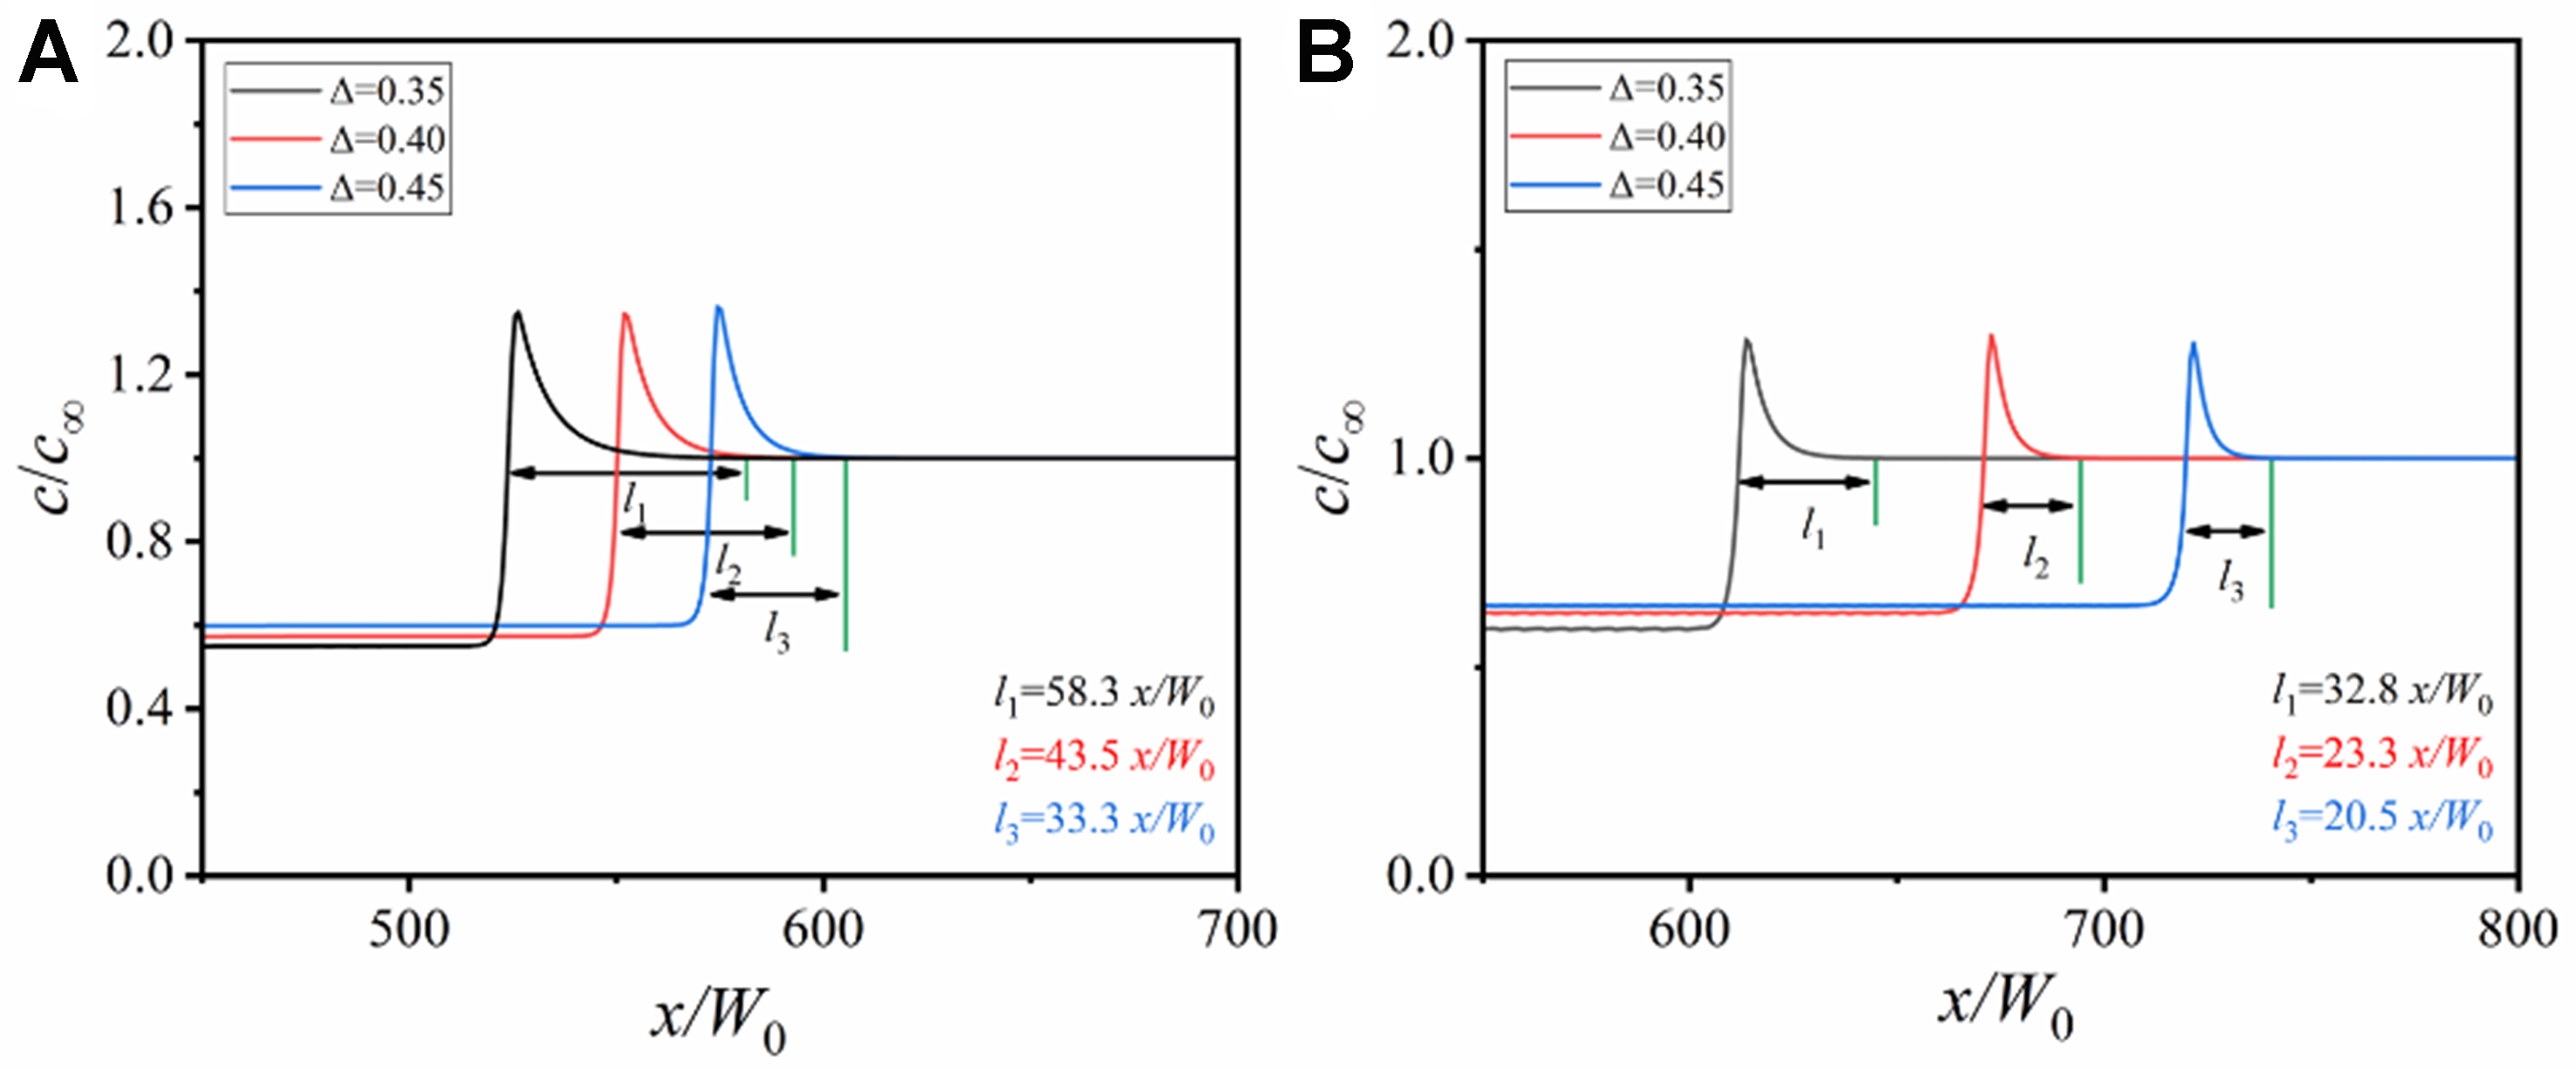
Figure 10. Change of solute concentration along the domain horizontal centerlines in Figure 9 under different undercoolings: (A) solute trapping with solute drag; (B) solute trapping without solute drag.
Different from single dendrite growth, multiple dendrites will compete with each other due to limited space, which makes the morphology evolution and solute redistribution more complex. Figure 11 shows the variation of the solid fraction with the solidification time under different undercoolings. At the initial stage of solidification, the curve is steep, indicating that the solidification velocity is high and the solid fraction increases rapidly. With the increase of solidification time, the rising rate of the solid fraction slows down, because the dendrite begins to coarsen and the solid fraction in the limited space tends to an upper limit, which is called the steady-state solid fraction.
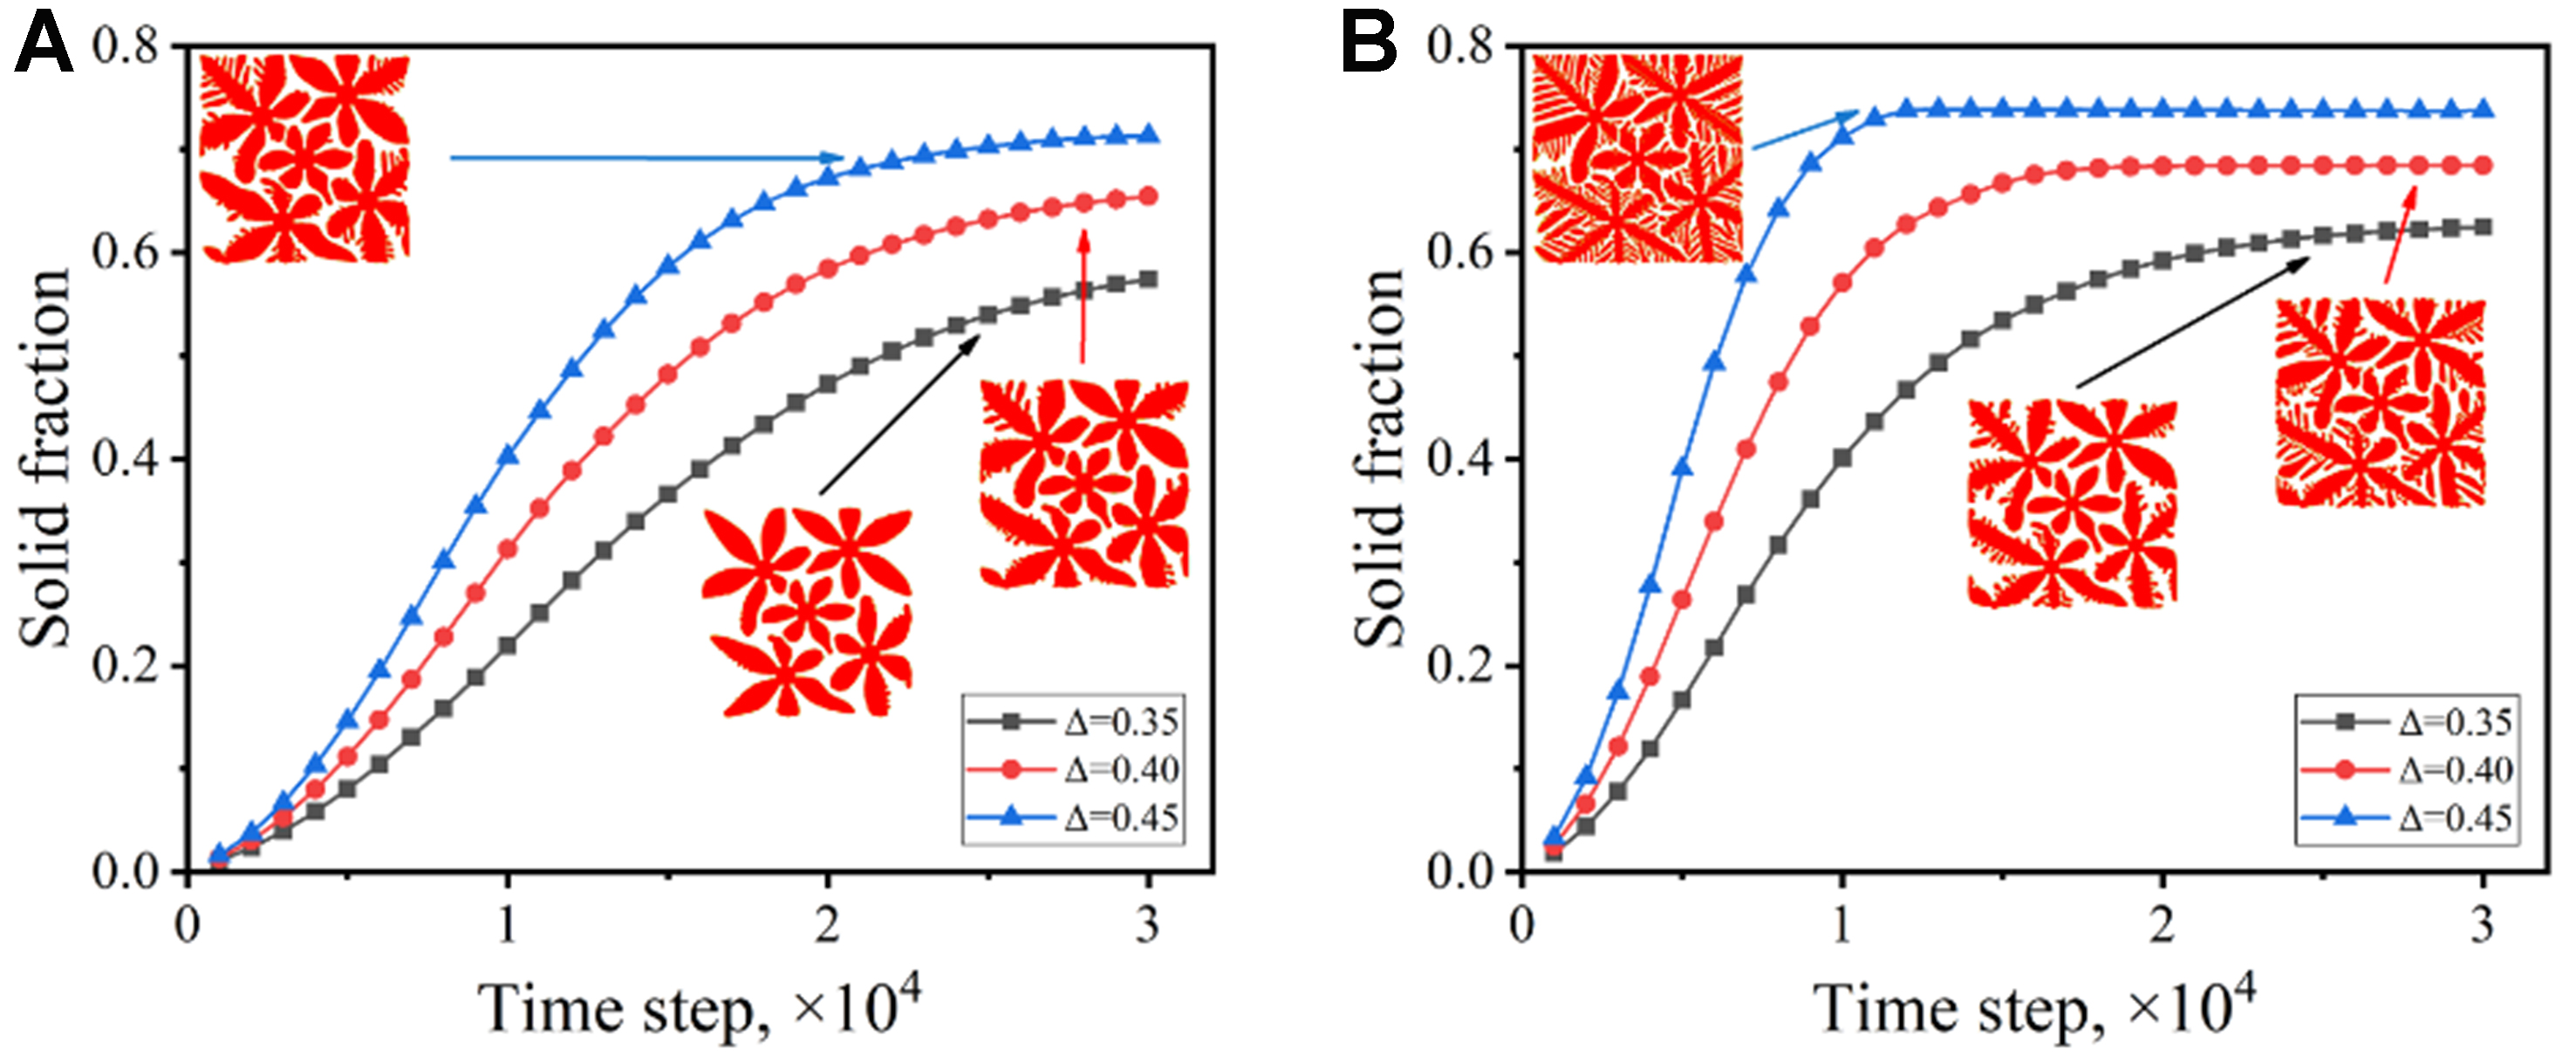
Figure 11. Variation of solid fraction with time under different undercoolings: (A) solute trapping with solute drag; (B) solute trapping without solute drag.
The increased undercooling elevates the solidification driving force, promoting the formation of more secondary dendrite arms and leading to higher growth rate of the solid fraction. This change indicates that the effect of undercooling on single dendrite growth can also be applied to multiple dendrite systems. However, the competitive growth between multiple dendrites hinders further growth of dendrites. When the undercooling is fixed, the zero drag condition exhibits a faster solidification velocity and a larger steady-state solid fraction, which corresponds to more developed dendrite morphology shown in the insets in Figures 11.
Effect of cooling rate
The cooling rate is another critical factor influencing dendrite growth. Distinct from undercooling which acts as thermodynamic driving force, the cooling rate is considered as kinetic parameter that directly governs the solidification time scale by affecting the duration of solute diffusion and the velocity of interface migration. Figure 12 shows the equiaxed dendrite morphology and the solute distribution under different cooling rates, all obtained at 8,000 dt. The solute drag increases the stability of the interface, and the dendrite morphology does not change significantly with the cooling rate, with only few secondary dendrite arms generated [Figure 12D]. As a comparison, the dendrite under the zero drag condition is more sensitive to the cooling rate, and the growth velocity is also higher. With the increase of the cooling rate, the secondary dendrite arms are more developed, and the tertiary dendrite arms can be triggered under the zero drag condition, as shown in Figure 12H. The different growth behavior induced by the consideration of the solute drag further indicates the strong dependence of the dendrite pattern on the growth dynamics.
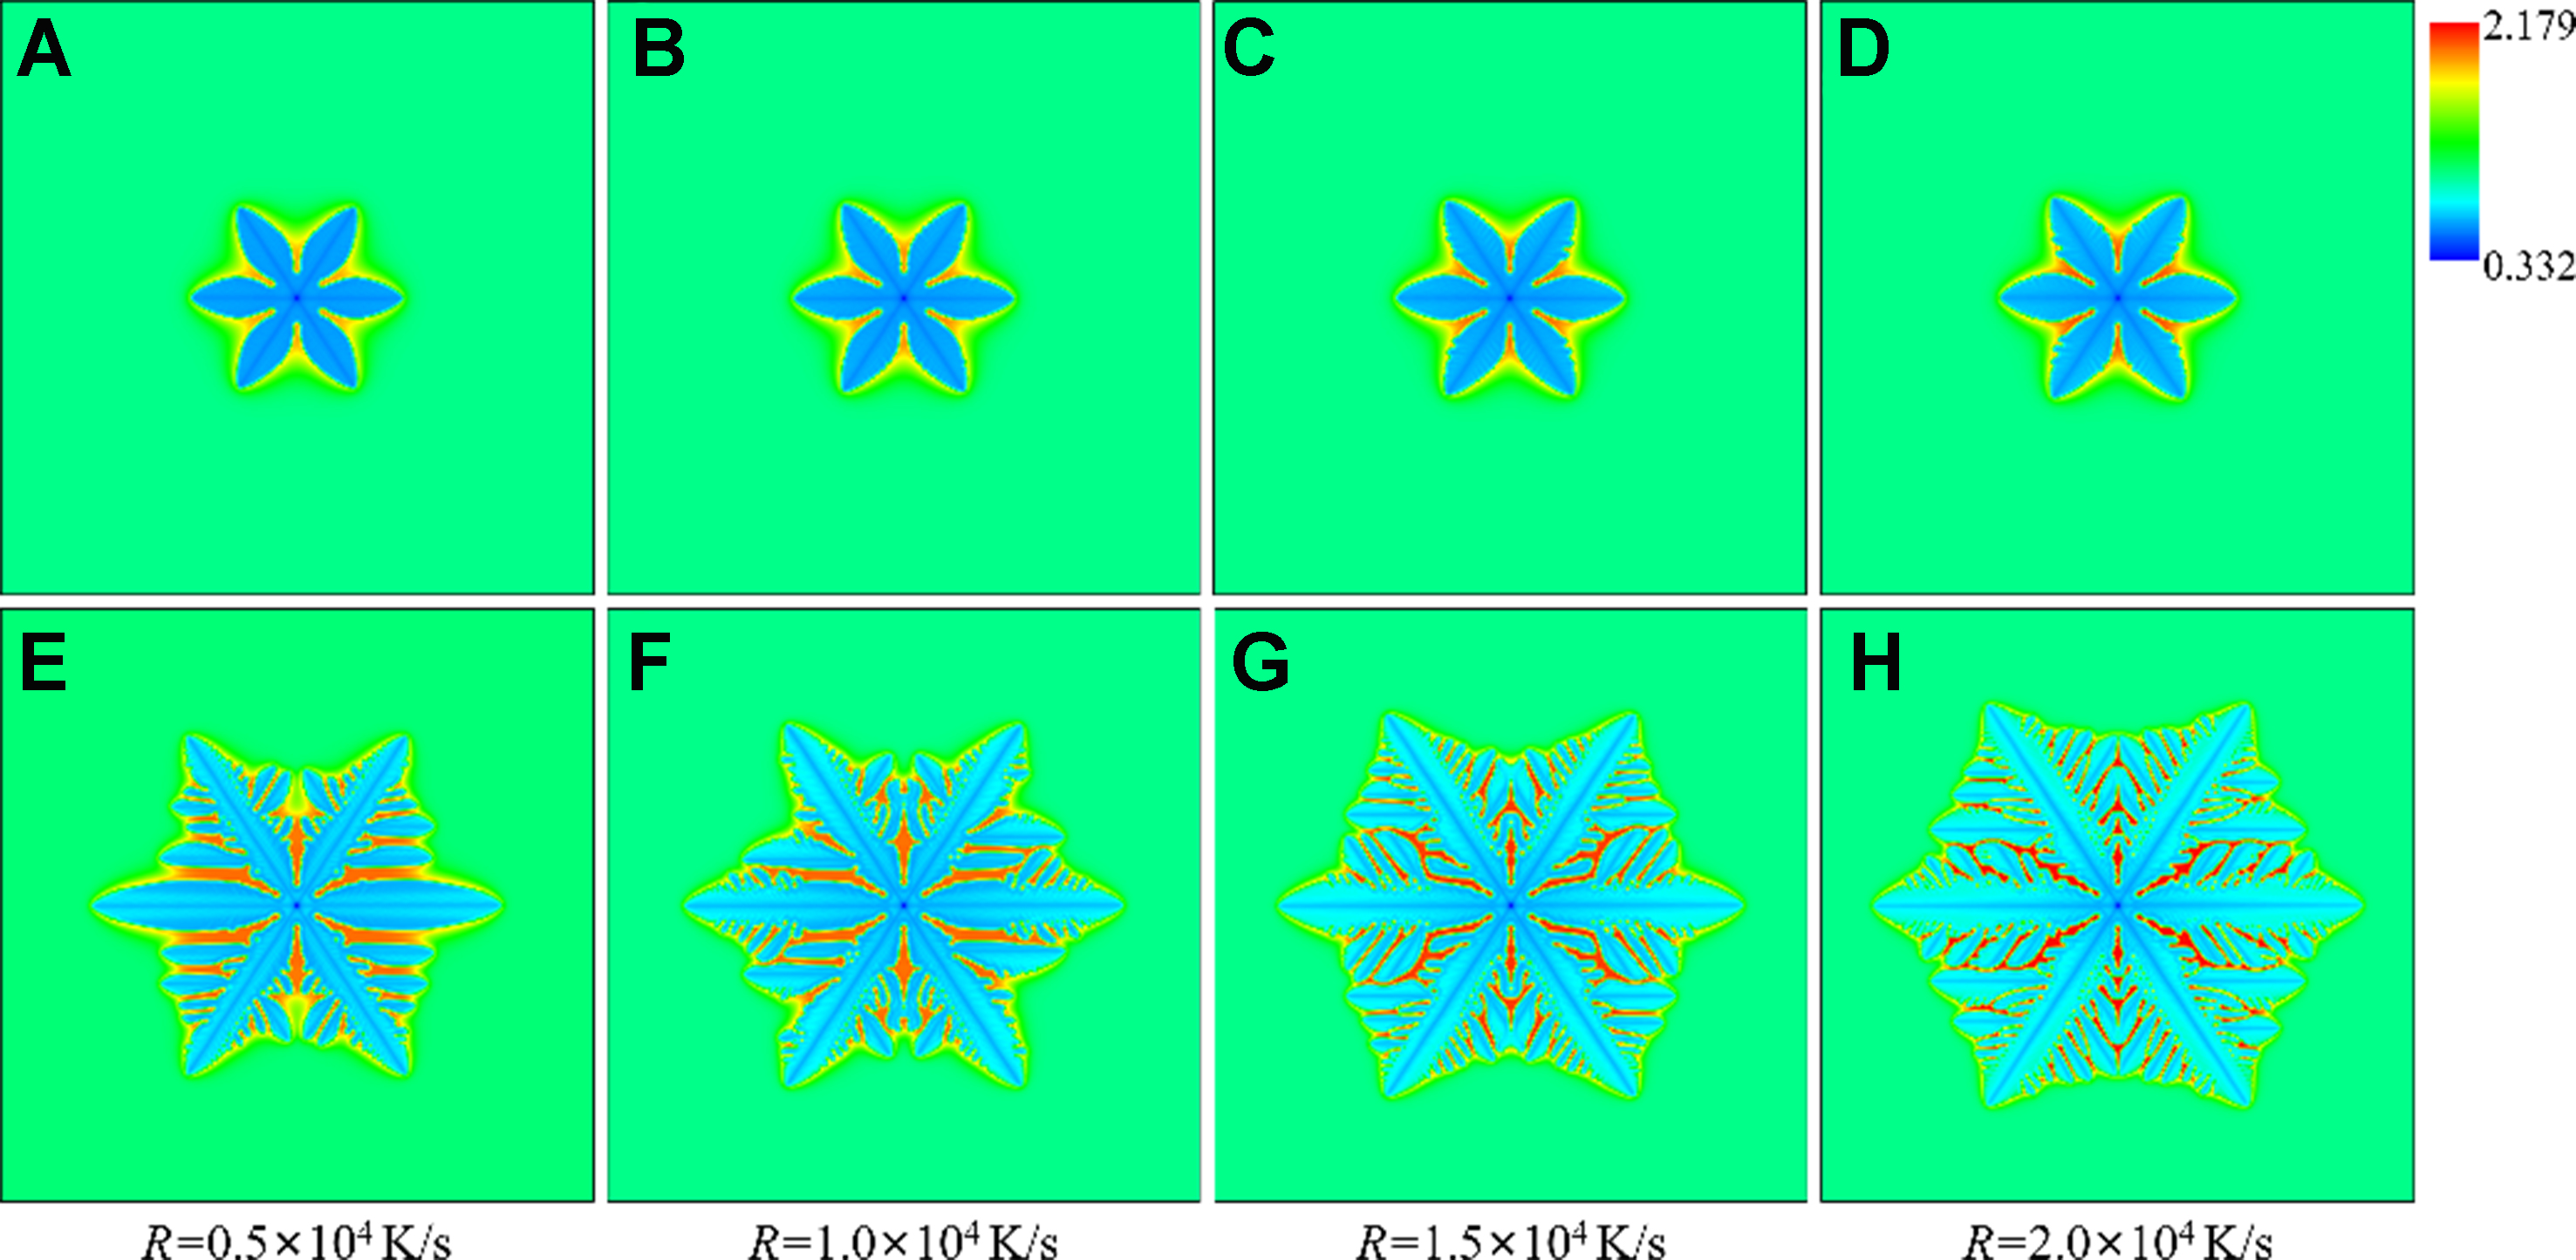
Figure 12. Morphology and solute distribution of equiaxed dendrites under different cooling rates: (A-D) solute trapping with solute drag; (E-H) solute trapping without solute drag.
Figure 13 shows the width of the solute diffusion layer under different cooling rates. The width of the solute diffusion layer decreases with the increase of the cooling rate. The difference of the layer width is small under the full drag condition, since the dendrite morphology changes little. When the solute drag is not considered, the width of the diffusion layer is significantly smaller, which indicates that the alloy solute near the solid-liquid interface becomes more concentrated. This leads to a larger concentration gradient, causing intensified constitutional undercooling and thus developed dendritic structure. Figure 14 shows the variation of the solid fraction with the solidification time under different cooling rates. The increase of the cooling rate accelerates the solidification velocity, promotes the development of dendrite arms, and increases the solid fraction. The final solid fraction is close to 100% at 2 × 10⁴ K/s under the zero drag condition.
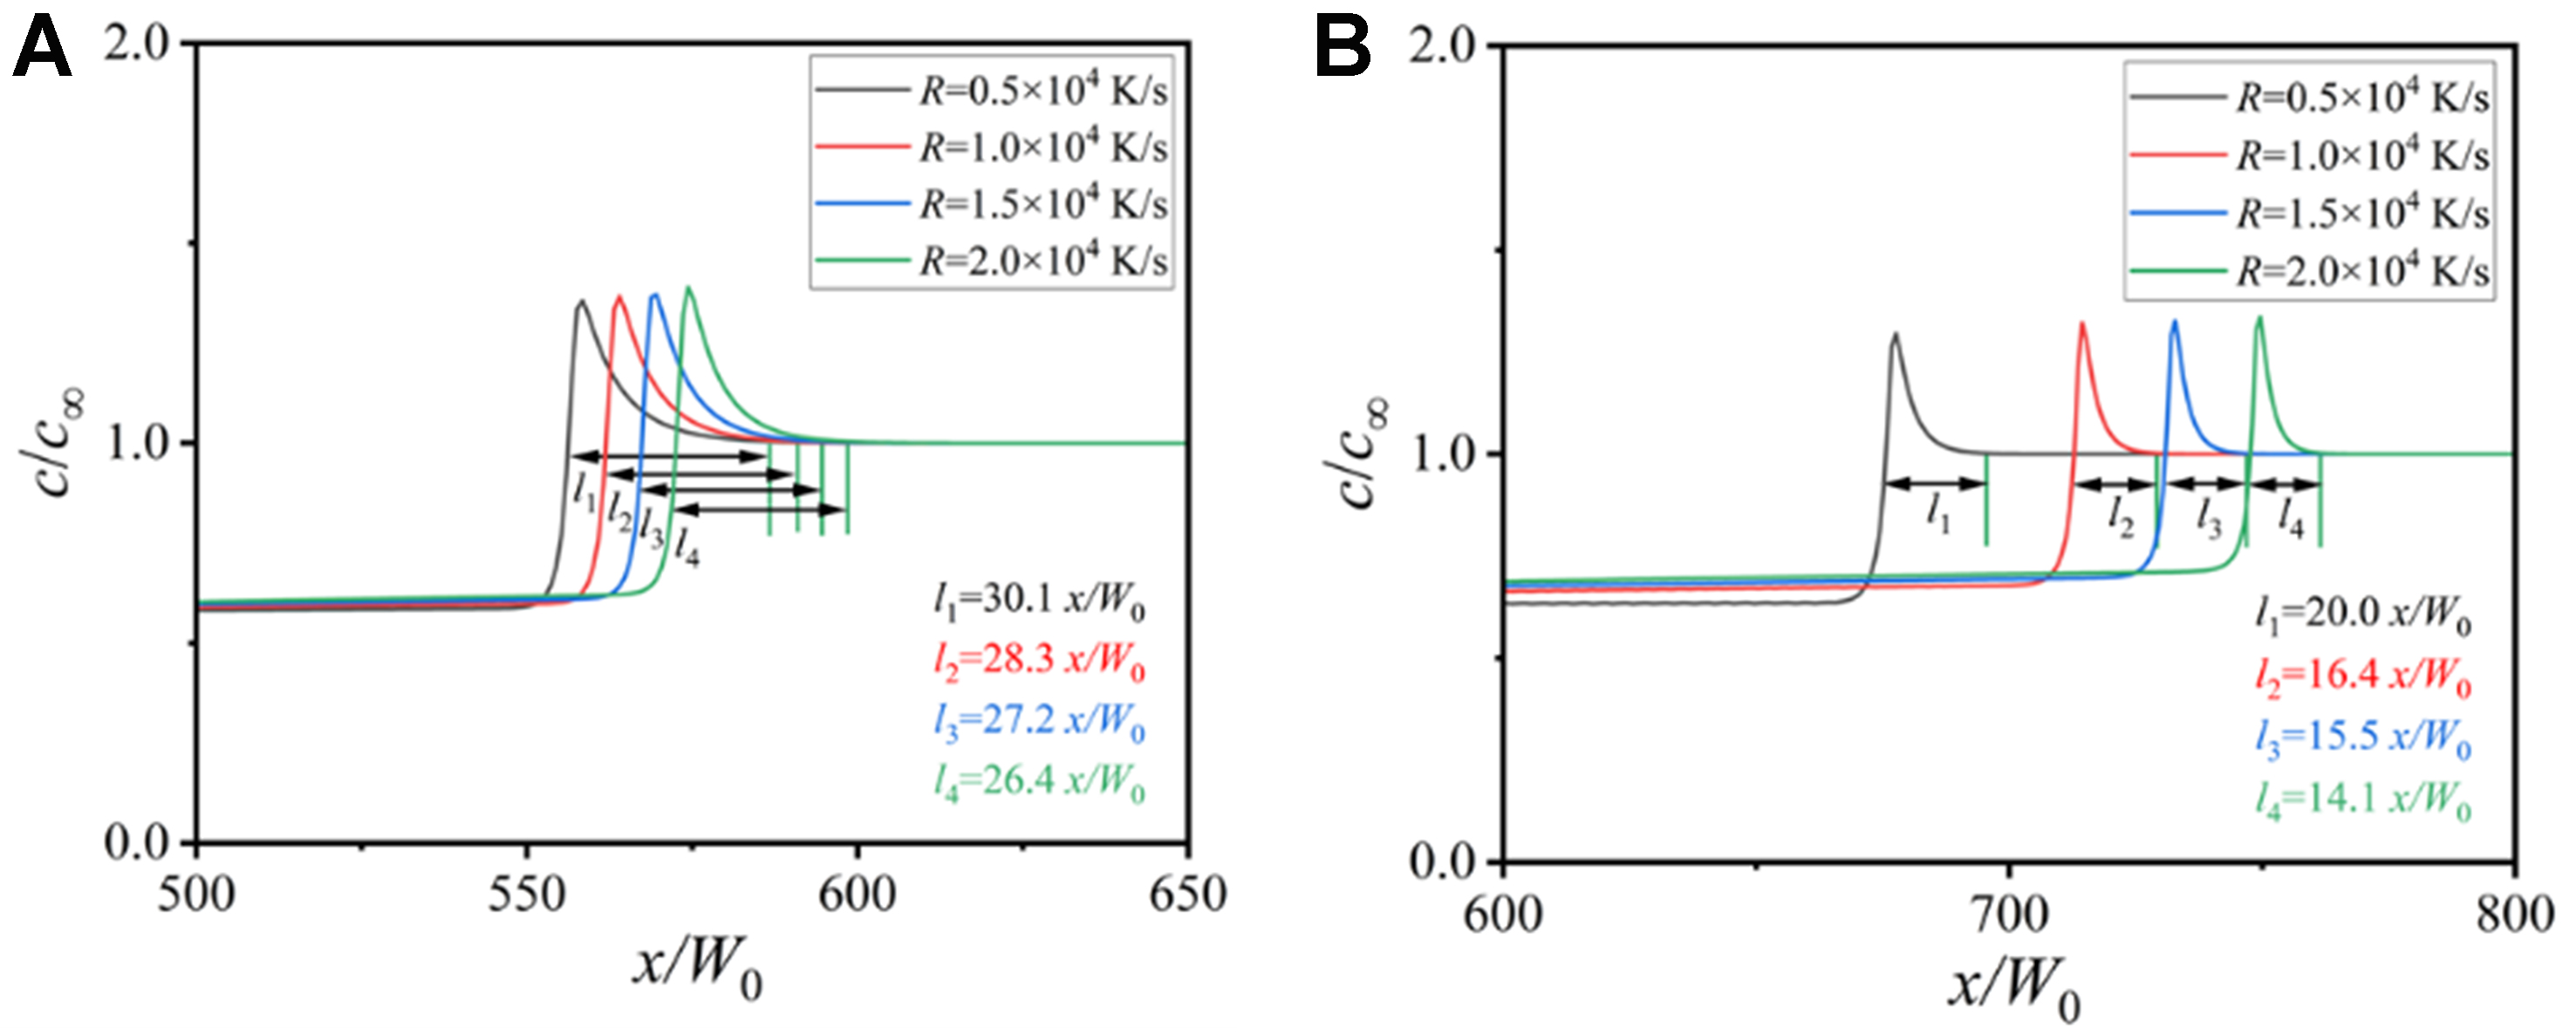
Figure 13. Change of solute concentration along the domain horizontal centerlines under different cooling rates: (A) solute trapping with solute drag; (B) solute trapping without solute drag.
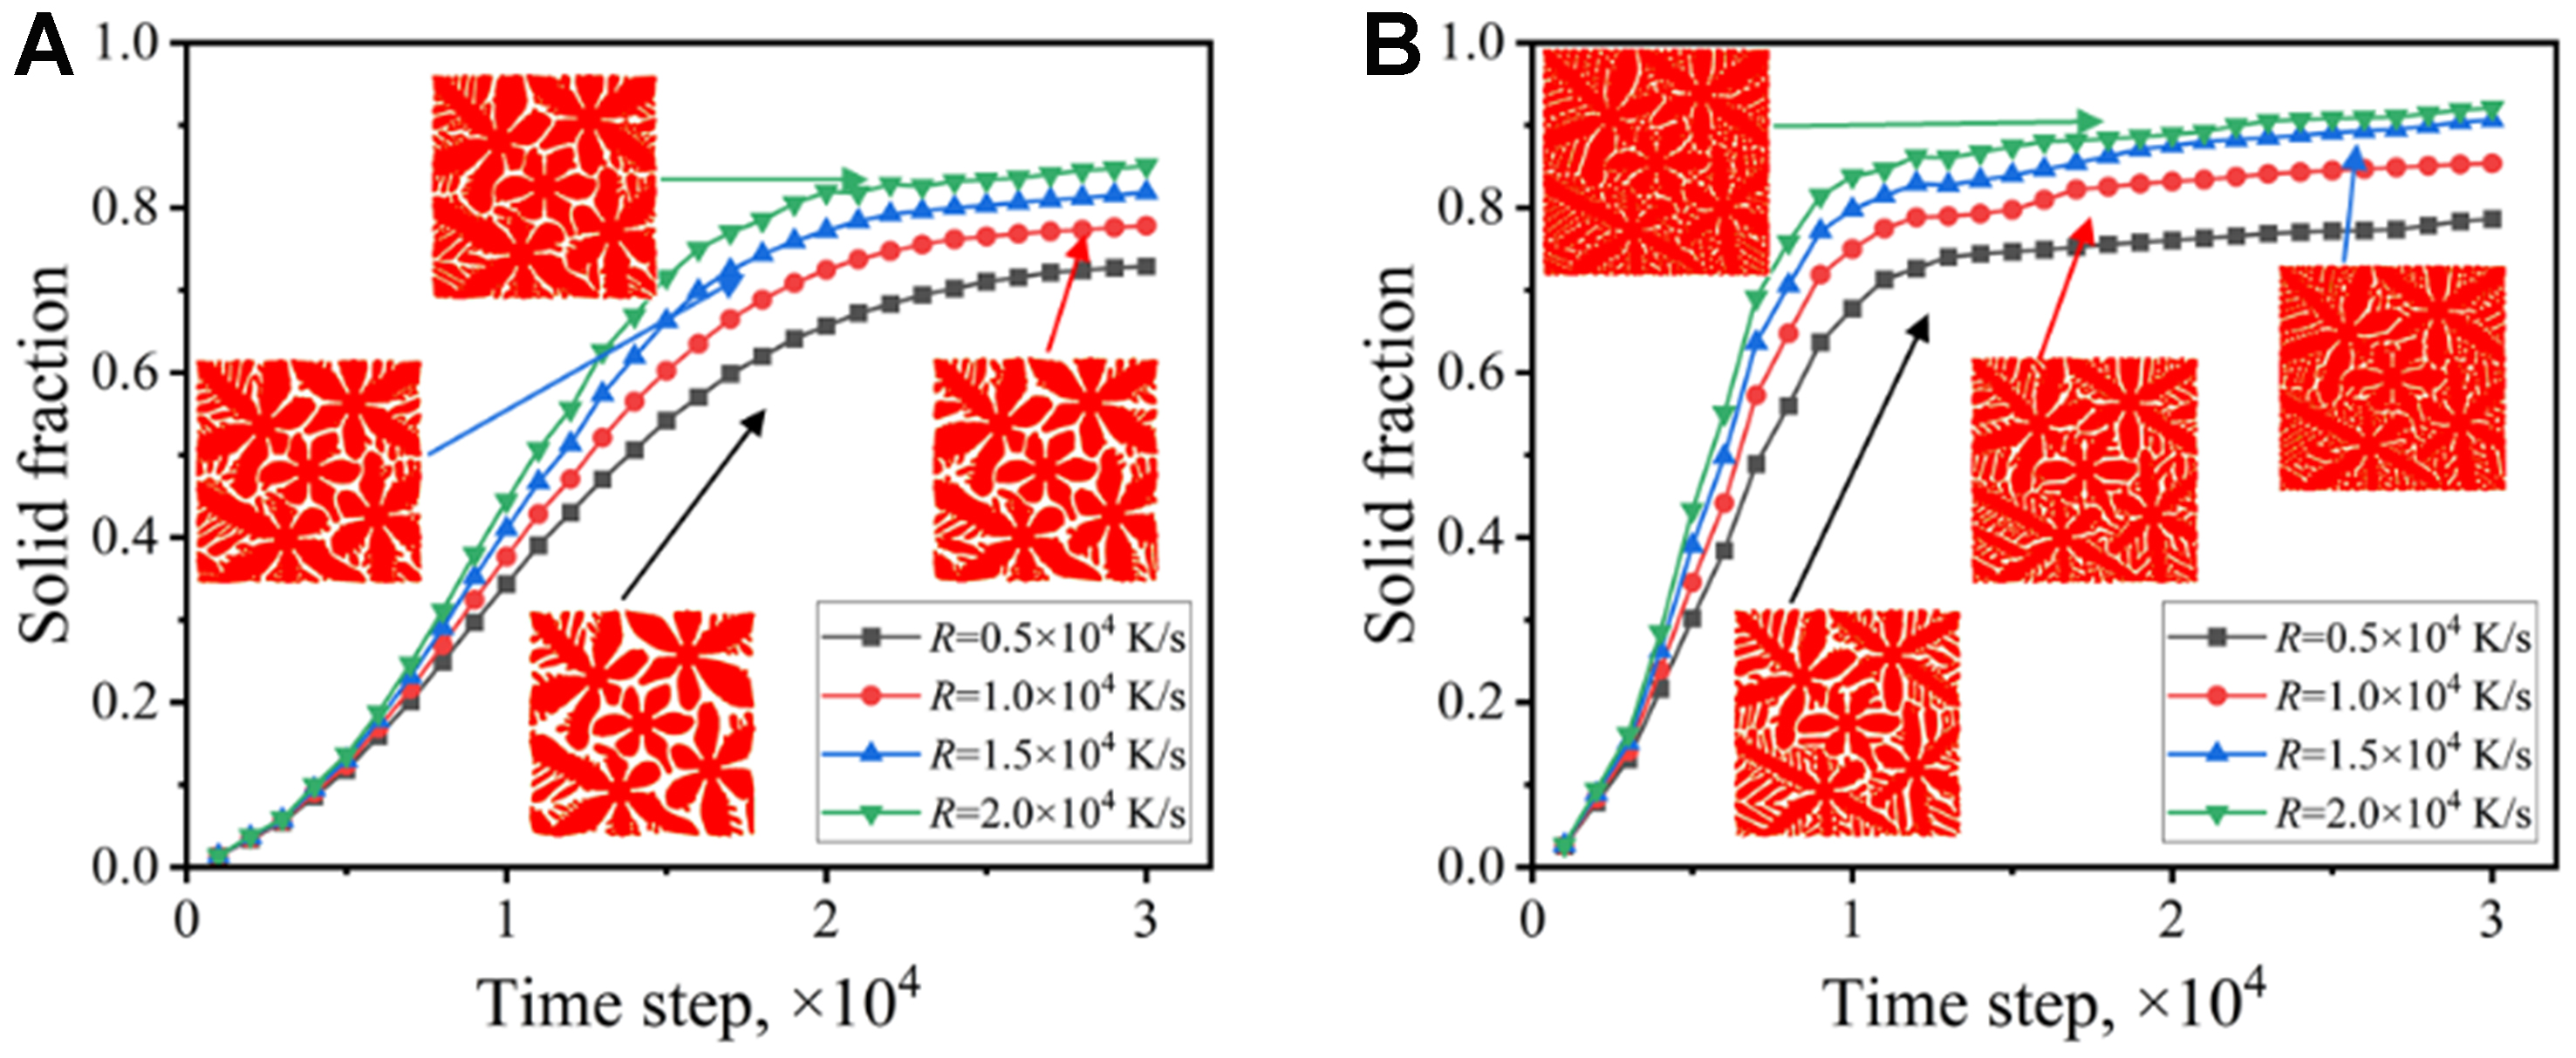
Figure 14. Variation of solid fraction with time under different cooling rates: (A) solute trapping with solute drag; (B) solute trapping without solute drag.
Based on the numerical studies of different non-equilibrium effects (with and without solute drag), the dendrite pattern under the zero drag condition is more sensitive to the temperature conditions, including undercooling and cooling rate, in which an increase in driving force is more easily to be converted into the power for dendrite growth. The dendrite morphology under the full drag condition changes less noticeably, as the interface maintains high stability even under strong growth driving force.
Effect of orientation angle
In the quasi-rapid solidification process such as die casting, the synergistic effect of local temperature gradient and unidirectional heat flow may lead to the formation of columnar crystals. The growth behavior of columnar crystals in directional solidification is highly dependent on the synergy of crystal orientation and heat flow direction, that is, it is affected by the angle between the preferred growth direction and the heat flow direction, which is usually referred to as the orientation angle ψ0[26-28]. Theoretically, the columnar crystal has the maximum growth velocity when the preferred orientation is consistent with the direction of heat flow. However, the actual directional solidification process is restricted by a variety of solidification conditions and external disturbances, and there is often a deviation between the orientation angle and the direction of heat flow.
Figure 15 shows the morphology and solute distribution under different orientation angles, 0, π/18, π/12, and π/6. With the increase of the orientation angle, the dendrite array becomes sparse with augmented arm spacing. The lateral branches of the primary dendrite arms show asymmetric growth mode, but the trunk width of the primary dendrite arm keeps unchanged. The preferred lateral branches develop, grow close to the primary dendrite arms in height, and even produce tertiary dendrite arms. When the orientation angle reaches the maximum ψ0 = π/6, the columnar dendrite array develops into the double-primary dendrite structure. The influence of non-equilibrium effects on the primary dendritic structure is not affected by the orientation angle, and the primary dendritic arms are thinner under the zero drag condition.
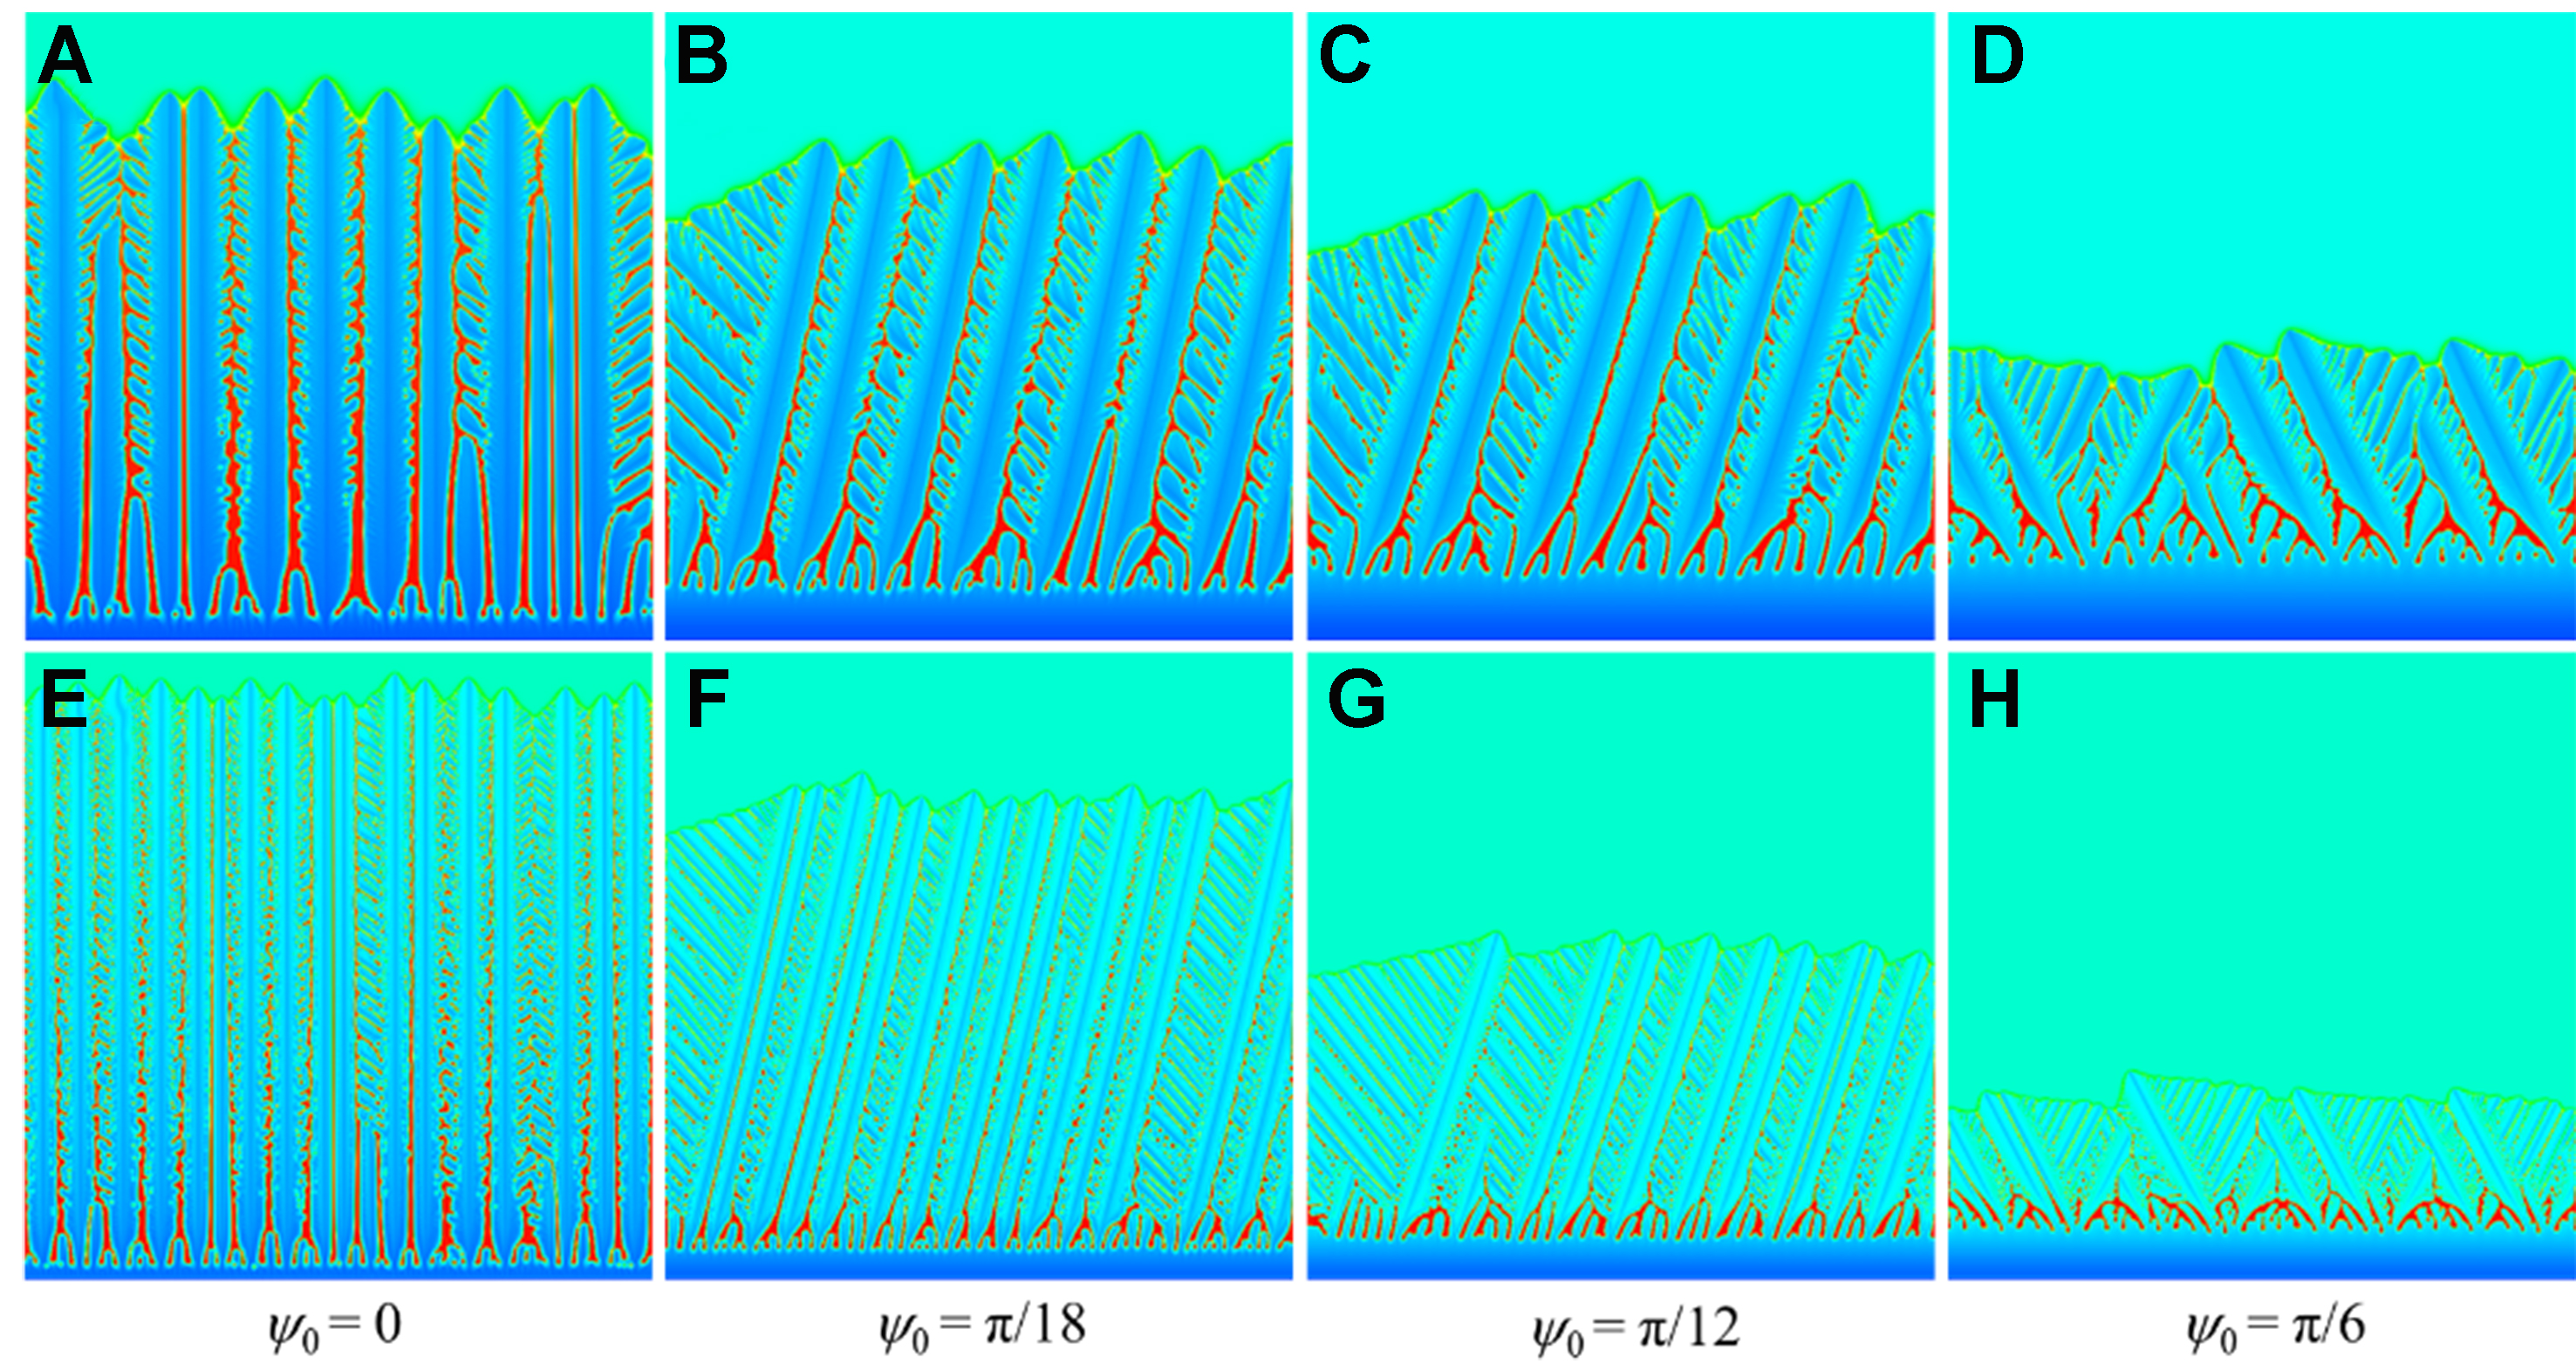
Figure 15. Morphology and solute distribution under different orientation angles ψ0 for columnar dendrites: (A-D) solute trapping with solute drag; (E-H) solute trapping without solute drag.
Figure 16 shows the interface position and PDAS vs. time under different orientation angles. When the orientation angle is 0, the preferred orientation of the columnar dendrites is consistent with the direction of the heat flow, and few columnar crystals are inhibited during the growth process. The interface movement velocity is the fastest, and the change of PDAS at each height is less obvious. With the increase of the orientation angle, the angle between the unilateral secondary dendrite arms and the direction of the heat flow decreases, which promotes the growth of the side arms. The columnar dendrites at the inferior position are eliminated continuously, especially at the early stage, and the PDAS increases with height. When the orientation angle reaches the maximum π/6, the secondary dendrite arms between the neighboring primary arms become rather developed, and the PDAS is much higher than the others due to the formation of the double-primary dendrite structure [Figure 15D and H]. Under the full drag condition, the primary dendrite arms are thicker and the PDAS is larger. When the solute drag is not considered, the columnar dendrites grow faster, with thinner and more densely distributed primary dendrite arms, forming stable dominant columnar dendrites in the early solidification stage and thus exhibiting more stable PDAS.
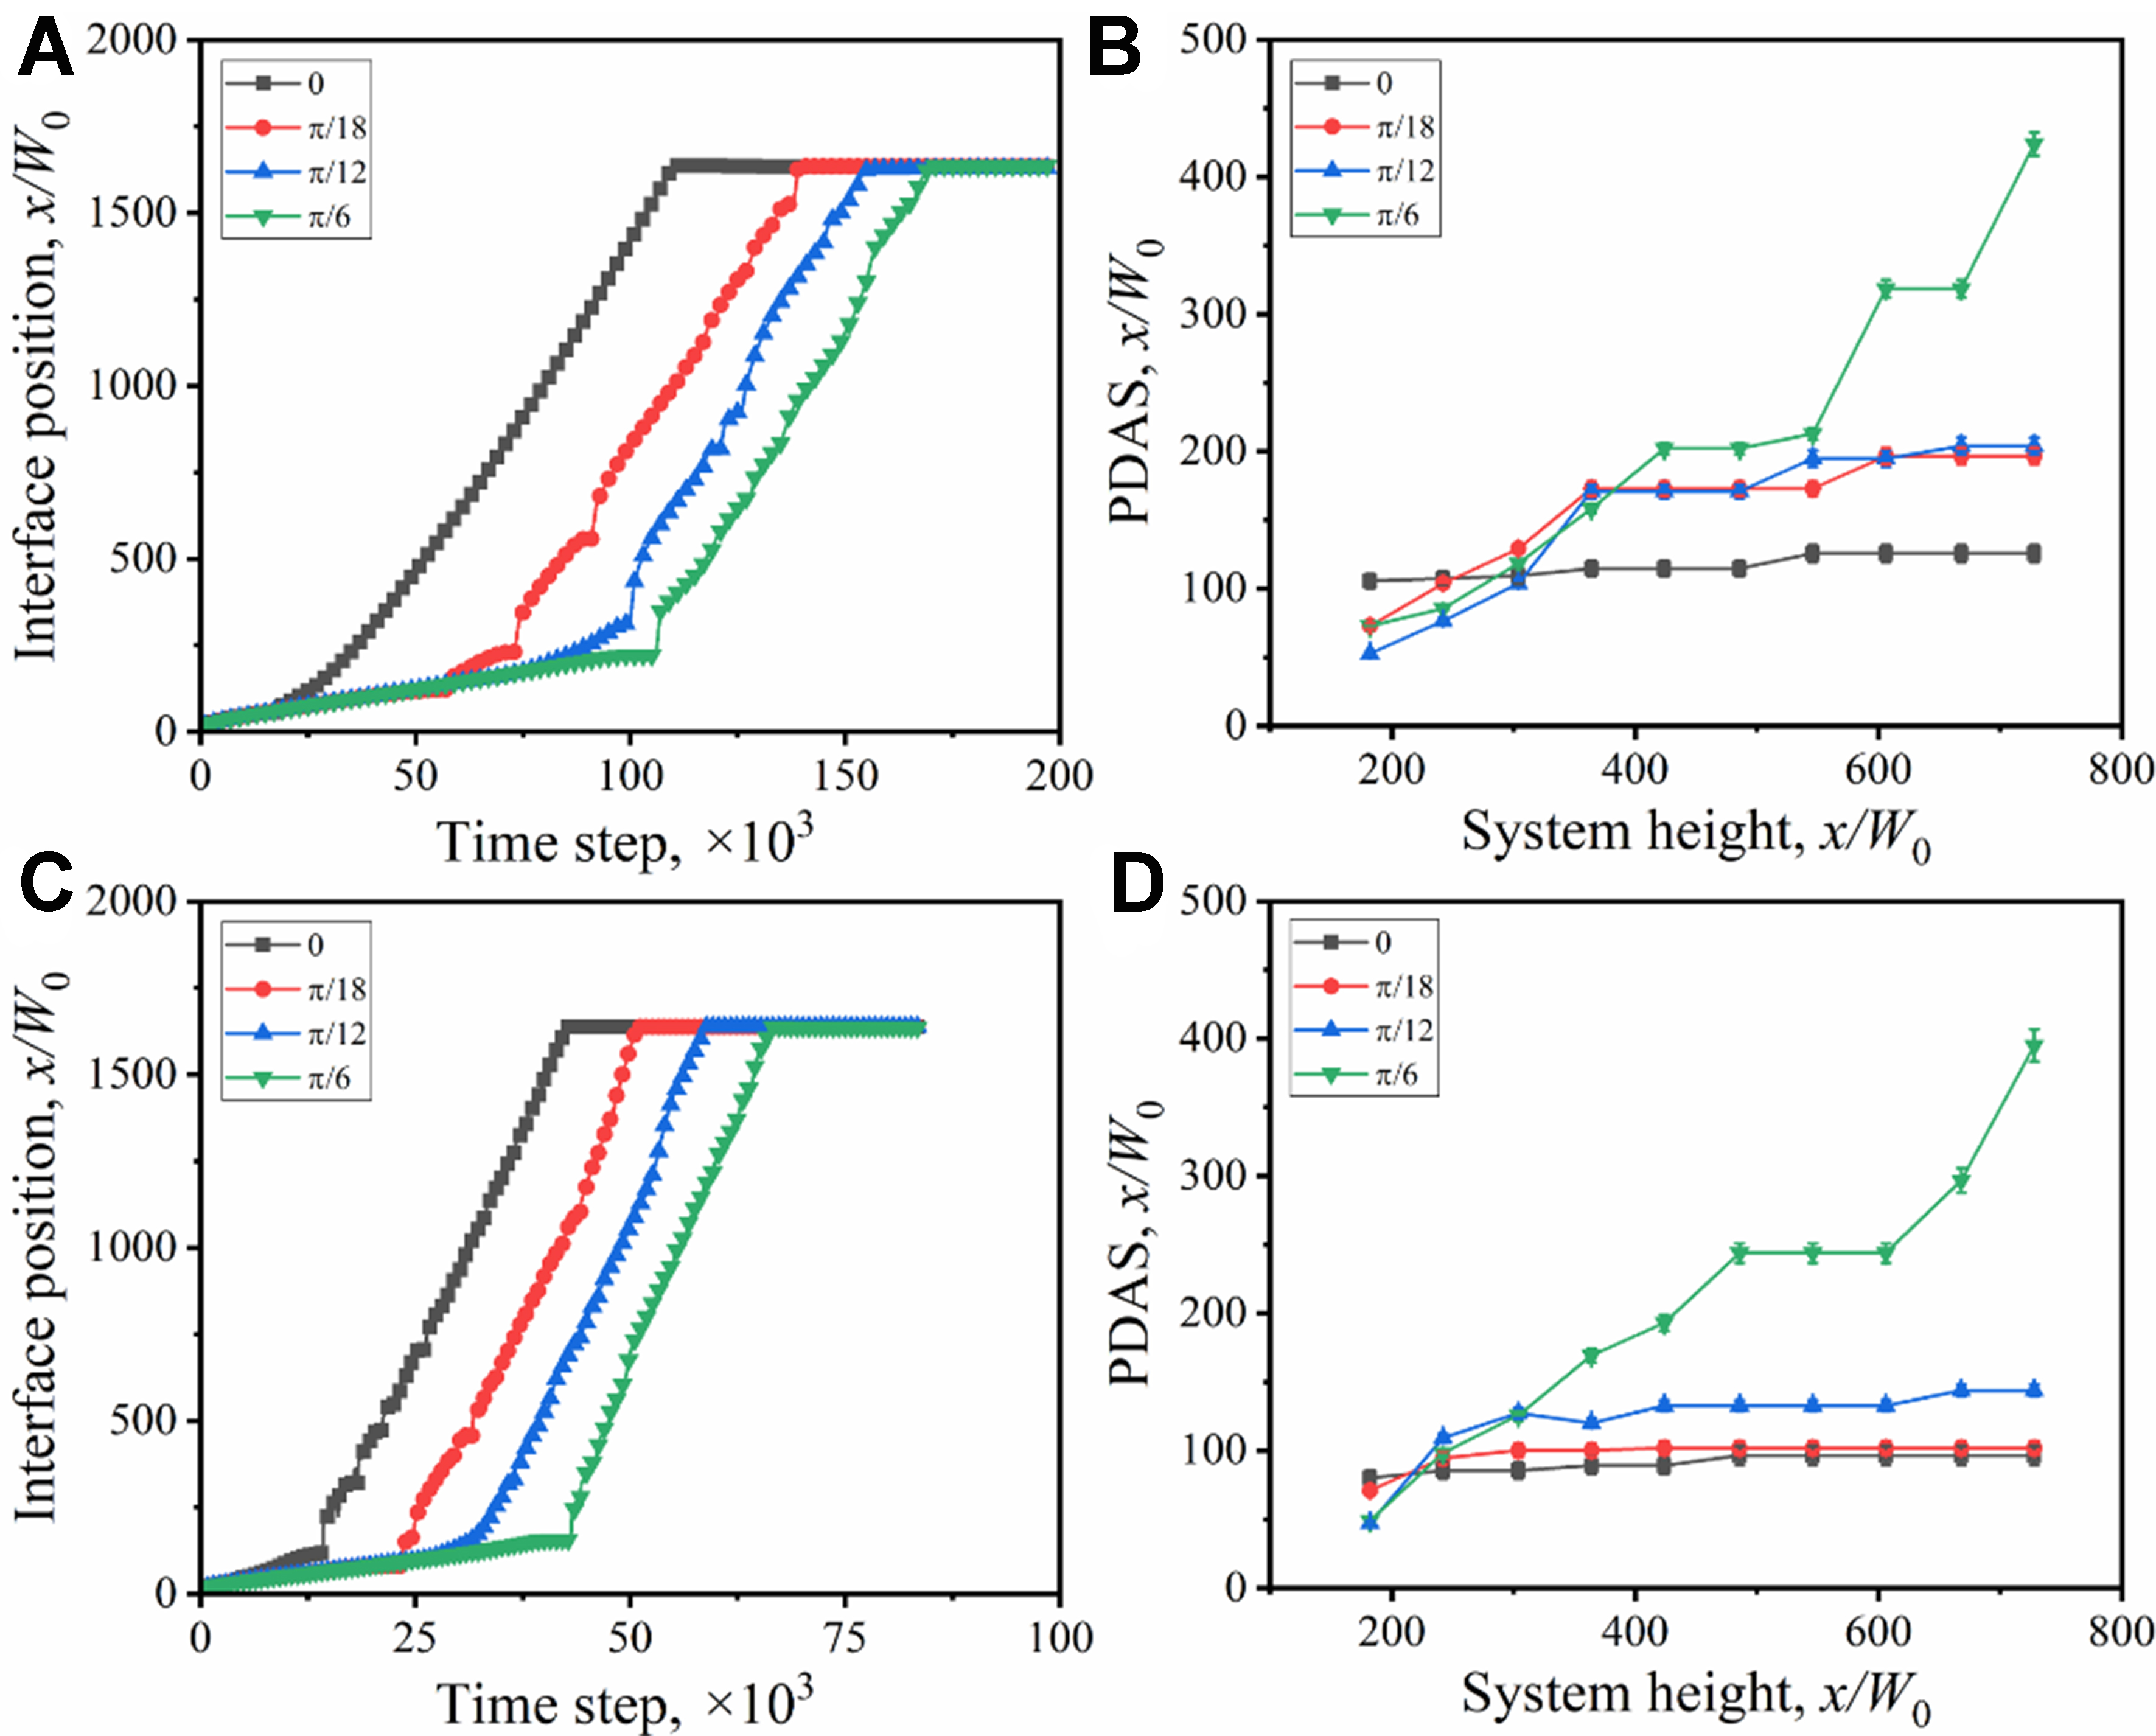
Figure 16. Variation of interface position and PDAS with time under different orientation angles: (A and B) solute trapping with solute drag; (C and D) solute trapping without solute drag. PDAS: Primary dendrite arm spacing.
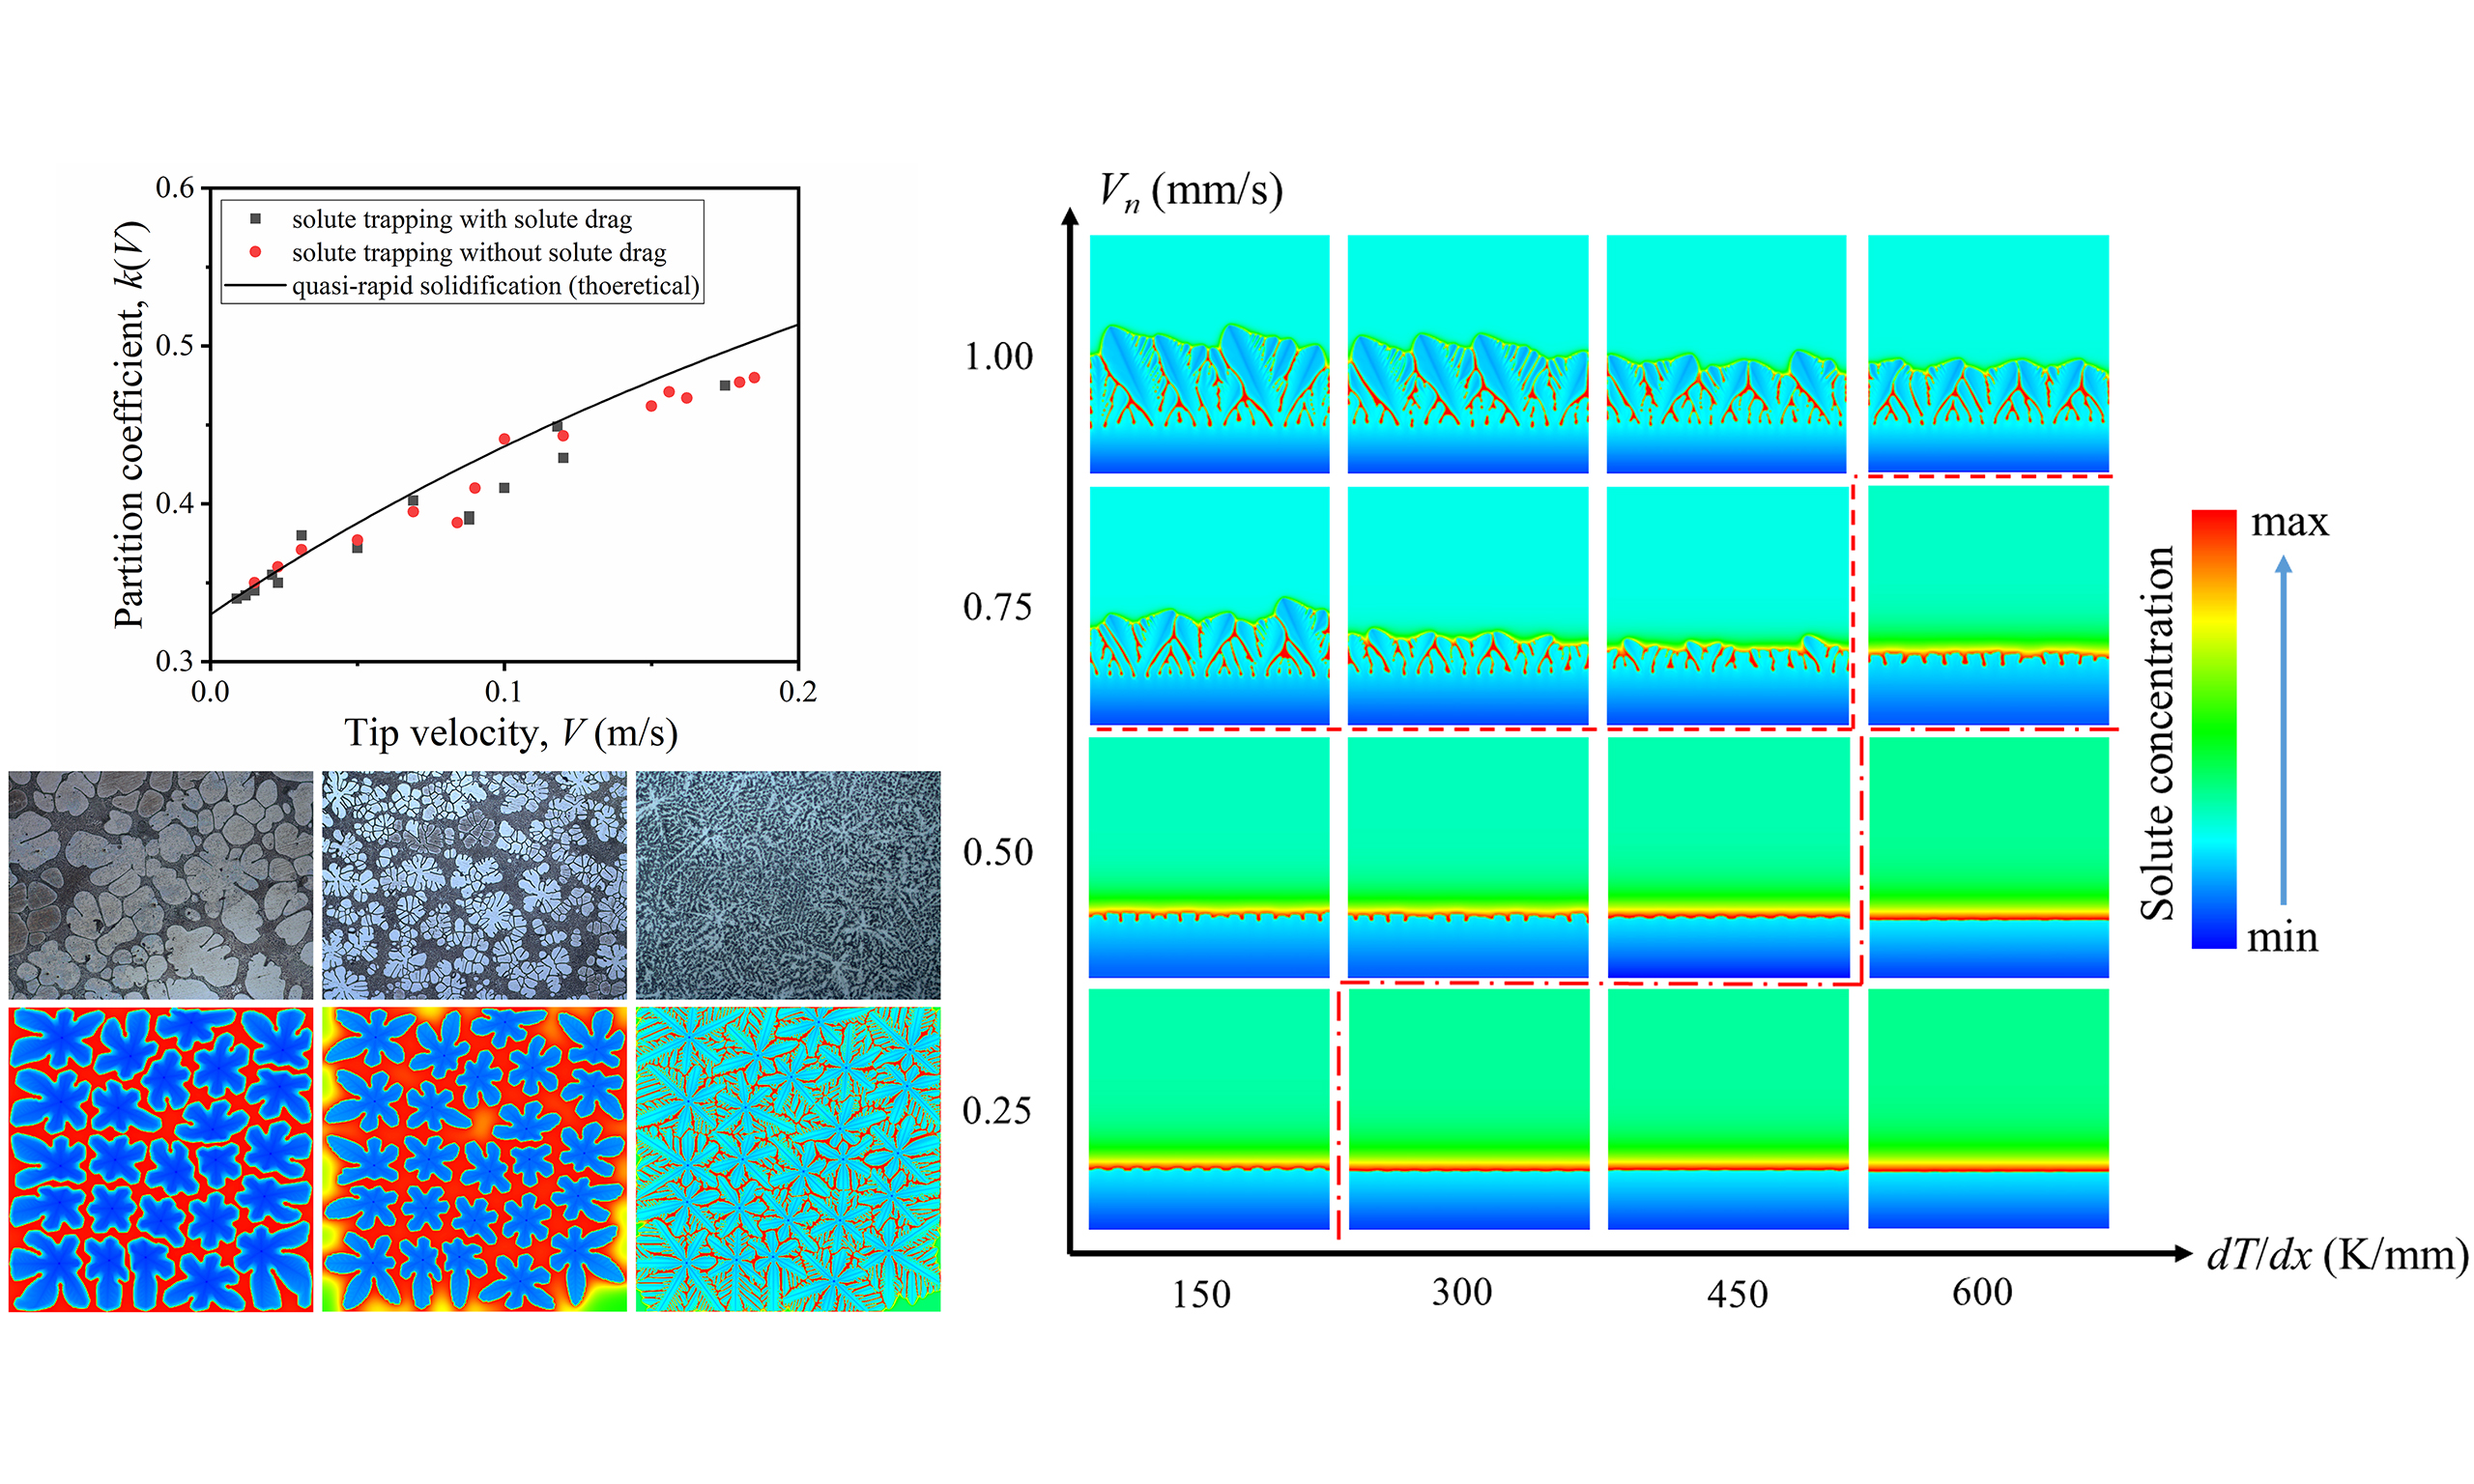
Morphological transition
The columnar crystals have different interface growth modes including planar interface growth, cellular growth, and dendritic growth, which are affected by the synergistic effect of temperature gradient (G = dT/dx) and growth rate (Vn). Figure 17 shows the morphology of columnar crystals under different growth conditions. At a large temperature gradient but low growth velocity, the solute can diffuse fully, and there is a small undercooling zone near the solid-liquid interface. The solid-liquid interface advances in the form of planar interface. At Vn = 0.5 mm/s, the instability of the plane front intensifies when the temperature gradient decreases from 600 to 450 K/mm. The planar equilibrium is disrupted, and the solid-liquid interface is disturbed to produce protrusions, indicating morphological transition to cellular growth. After the solidification velocity is increased to 0.75 mm/s, the tips of the cellular crystals tend to be unstable when the temperature gradient decreases from 600 to 450 K/mm. The cellular tips are split into two symmetrical branches, forming the double-primary dendrite structure, indicating morphological transition from cellular growth to dendritic growth.
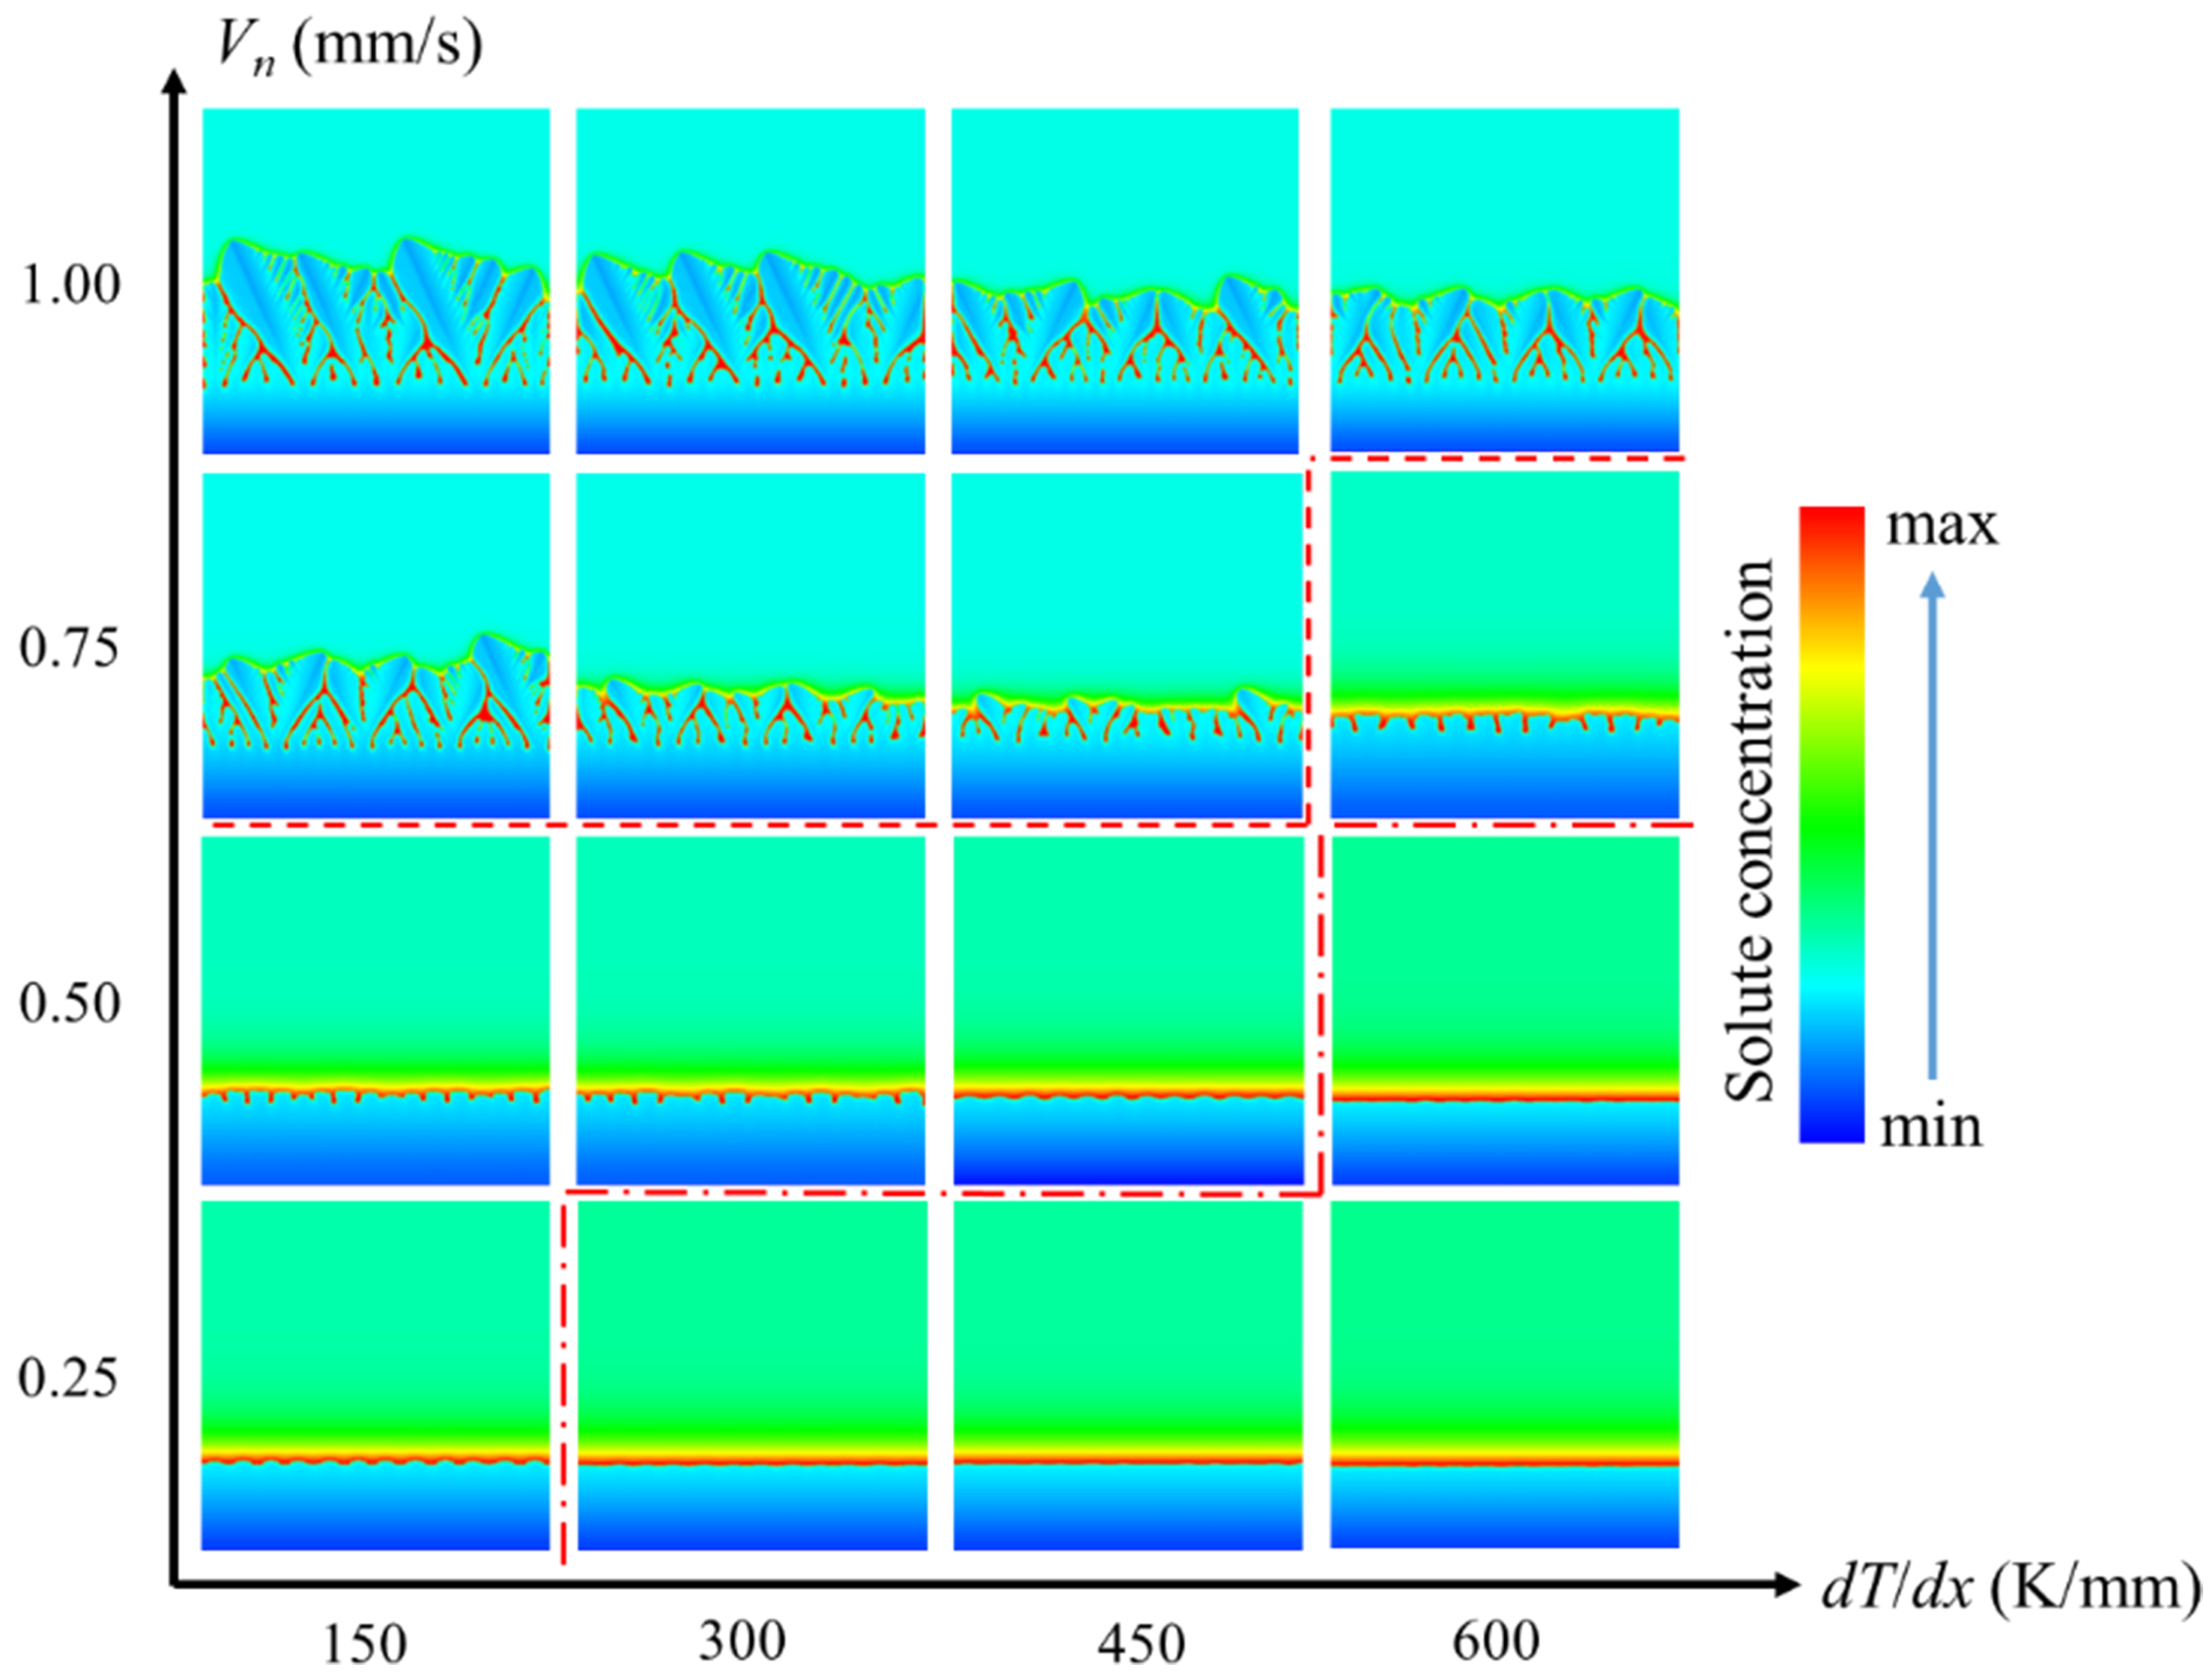
Figure 17. Interface morphology under different temperature gradients G and growth velocities Vn.
The solidification mode during directional solidification can be theoretically predicted by the ratio of the temperature gradient to the growth velocity. According to the selection theory of solidification pattern, the condition criterion of planar interface transition is[29]:
Substituting the thermo-physical parameters in Table 1 into Equation (8), the theoretical critical value G/Vn of Mg-6Al alloy is 1.48 × 10¹⁰ K·s/m2, that is, when the G/Vn is lower than the critical value, the stability of the planar interface cannot be maintained and the transition to cellular growth occurs. For the cellular and dendritic structures, the essential difference lies in whether there are significant lateral branches. This transition is a continuous process from periodic cellular fluctuation to bifurcation instability of interface disturbance, rather than a sudden critical point, so there is no accurate theoretical critical value for the cellular-dendritic transition. According to the above simulation results, the critical G/Vn values for the transition from planar growth to cellular growth and from cellular growth to dendritic growth can be estimated to be 1.2 × 10⁹ and 8 × 10⁸ K·s/m2, respectively. The solute drag not only reduces the growth velocity, but also reduces the level of constitutional undercooling by reducing the concentration gradient at the solid-liquid interface, so the simulated critical value G/Vn of the planar-cellular interface transition is much lower than the theoretical value.
Extension to partial solute drag condition
The above quasi-rapid solidification simulations focus on two extreme conditions including full solute drag and zero solute drag, because the quasi-rapid solidification model is based on the CGM kinetic theory which only considers the two typical conditions. For actual solidification process, the degree of solute drag is often between the two extreme conditions due to different solidification velocities, which can be termed as the partial drag condition. However, few phase-field models can accurately simulate the growth behavior under the partial drag condition. This is mainly because accurate simulation of the partial solute drag requires more elaborate and complex model framework, e.g., capturing the continuous change of solute-related parameters under different solidification conditions.
The solidification behavior is not only controlled by kinetic factors such as interface migration velocity and solute diffusion, but also closely related to the thermodynamic characteristics of the alloy system. Therefore, the combination of kinetics and thermodynamics can expand the analysis of partial drag condition and further elucidate the intrinsic mechanism of microstructure evolution.
From the kinetic perspective, high cooling rate shortens the diffusion time of solute atoms, leading to the deviation of solute distribution from equilibrium by enhancing the solute trapping. This results in a decrease in the interface stability, promoting the development of dendrite arms. In contrast, the solute drag transfers solute atoms at the interface into the liquid phase, balancing the concentration gradient at the interface and reducing local undercooling. The interface movement is impeded, and the stability of the interface front is enhanced. The partial drag condition is in the middle of the two extreme conditions, and the solute trapping and the solute drag are mutually balanced. From the point of view of solute partitioning, the partial drag condition makes the solute partitioning deviate from the equilibrium, but the degree of deviation is less than that under the zero drag condition. In terms of the stability of the interface front, the solute drag improves the stability of the interface, partially offsetting the decrease in stability caused by solute trapping, so that the interface front is not as unstable as the zero drag condition, nor as excessively stable as the full drag condition. This makes the dendrites have a relatively high growth driving force, enabling the formation of secondary dendrite arms, yet without the excessive development and density of dendrite arms as those under the zero drag condition.
Thermodynamic point focuses on the change of Gibbs free energy caused by non-equilibrium effects. The interface moves continuously and consumes energy, which is called the interface migration Gibbs free energy ΔGM. A part of the solute is desorbed from the interface and returned to the liquid phase while consuming energy, which is called the trans-interface diffusion Gibbs free energy ΔGD. The total free energy consumption is the sum of the two Gibbs free energy ΔGtotal = ΔGM + ΔGD. The free energy consumed by the solute drag ΔGD is the largest under the full drag condition, while that is zero under the zero drag condition. With the increase of the driving force for solidification, the solute trapping strengthens and the solute drag is suppressed, causing ΔGD to decrease while ΔGM increases continuously. With the total consumed Gibbs free energy remaining constant, this process is equivalent to continuously transferring the energy consumed by the solute drag to the interface migration, thereby promoting interface movement and developed dendrite pattern.
The model is anchored in the CGM kinetic framework, which only formally describes two idealized scenarios (full solute drag and zero solute drag). Such limitation results from the following assumptions. (1) The model uses a fixed trapping parameter (A) to control solute trapping intensity, meaning it cannot adapt to dynamic changes in solidification conditions that drive the partial solute drag; (2) The solute trapping/drag is assumed independent of interface shape, which fails to account for the fact that the solute drag is more pronounced at curved interfaces than at planar interfaces; (3) Only solute diffusion is considered during simulation, which neglects the multi-field effects affecting solute redistribution at the solid-liquid interface.
Accordingly, apart from the kinetic and thermodynamic points, the current model can be extended to capture the intermediate state by integrating dynamic parameter, multi-physics coupling, and advanced validation.
First, a dynamic balance between solute trapping (accelerating interface velocity) and solute drag (slowing it) can be established, which depends on local cooling rate, undercooling, and solute diffusion kinetics. Thus, a dynamic, condition-dependent trapping parameter needs to be set to adapt to local solidification conditions. The trapping parameter can be coupled with local cooling rate and undercooling by deriving a constitutive relation for A as a function of cooling rate and undercooling. Besides, the trapping parameter can be modified to include a term for interface curvature, as the curved interfaces (e.g., dendrite tips) exhibit higher trapping efficiency. Through setting dynamic A, the model can be enabled to simulate spatial variations in non-equilibrium intensity (e.g., higher trapping at dendrite tips and higher drag in interdendritic regions) and transient changes (e.g., fluctuating cooling rates in die casting).
Second, the melt flow and the thermal stress can be coupled in this model, since the intermediate state is strongly influenced by multi-physical effects. The melt flow can modulate solute transport at the interface (e.g., advecting solute away from tips, reducing drag), while the stress gradient can alter interface migration kinetics by modifying solute-interface binding energy (a key driver of solute drag). Taking the die casting for instance, on the one hand, the flow-driven shear at the mold surface increases local cooling rate, shifting the non-equilibrium balance toward zero drag, while the stagnant regions in the center have lower cooling rate, favoring partial drag. On the other hand, the compressive stress at the interface reduces the solute binding energy, lowering the drag intensity, which affects the formation of the intermediate state. Coupling melt flow and thermal stress would capture these spatial variations.
Third, in-situ high-resolution characterization techniques, e.g., in-situ synchrotron X-ray imaging and in-situ transmission electron microscopy, can be leveraged to capture the intermediate state and possible metastable phase formation at the solid-liquid interface, which can calibrate dynamic A and validate numerical predictions. For example, the real-time solute distribution, interface velocity, and dendrite morphology can be recorded during solidification, which provides critical input for the non-equilibrium simulations.
Comparative experiments
Figure 18 shows the microstructures of the Mg-6Al alloy under three cooling conditions. The cooling rates measured via the data acquisition system are 0.07 K/s (furnace cooling), 2.9 K/s (air cooling), and 181 K/s (water cooling). Under the furnace cooling, the extremely low cooling rate allows sufficient solute diffusion, resulting in coarse and sparsely distributed dendritic trunks with thick secondary arms and wide spacings. Under the air cooling, the elevated cooling rate increases nucleation density and refines the grain size significantly, yielding a more compact grain distribution than those under the furnace cooling. The solute diffusion is restricted, shortening the primary dendrite trunks and increasing the number of secondary arms, and the dendrite arms become shorter and more closely spaced. Under the water cooling, the substantial increase in undercooling and nucleation number strongly suppresses dendrite growth, forming fine and dense dendrite structure. The solute diffusion is nearly halted, and the extremely short growth time results in narrow primary arms. The high driving force destabilizes the solid-liquid interface, promoting prolific secondary arms, and typical six-fold symmetry dendrite structure can be identified from the refined equiaxed grains. Besides, the grain size is measured according to the average length of intercepts across grain boundaries. The statistical results are shown in Figure 18G-I. The average grain sizes are 132.6, 69.8, and
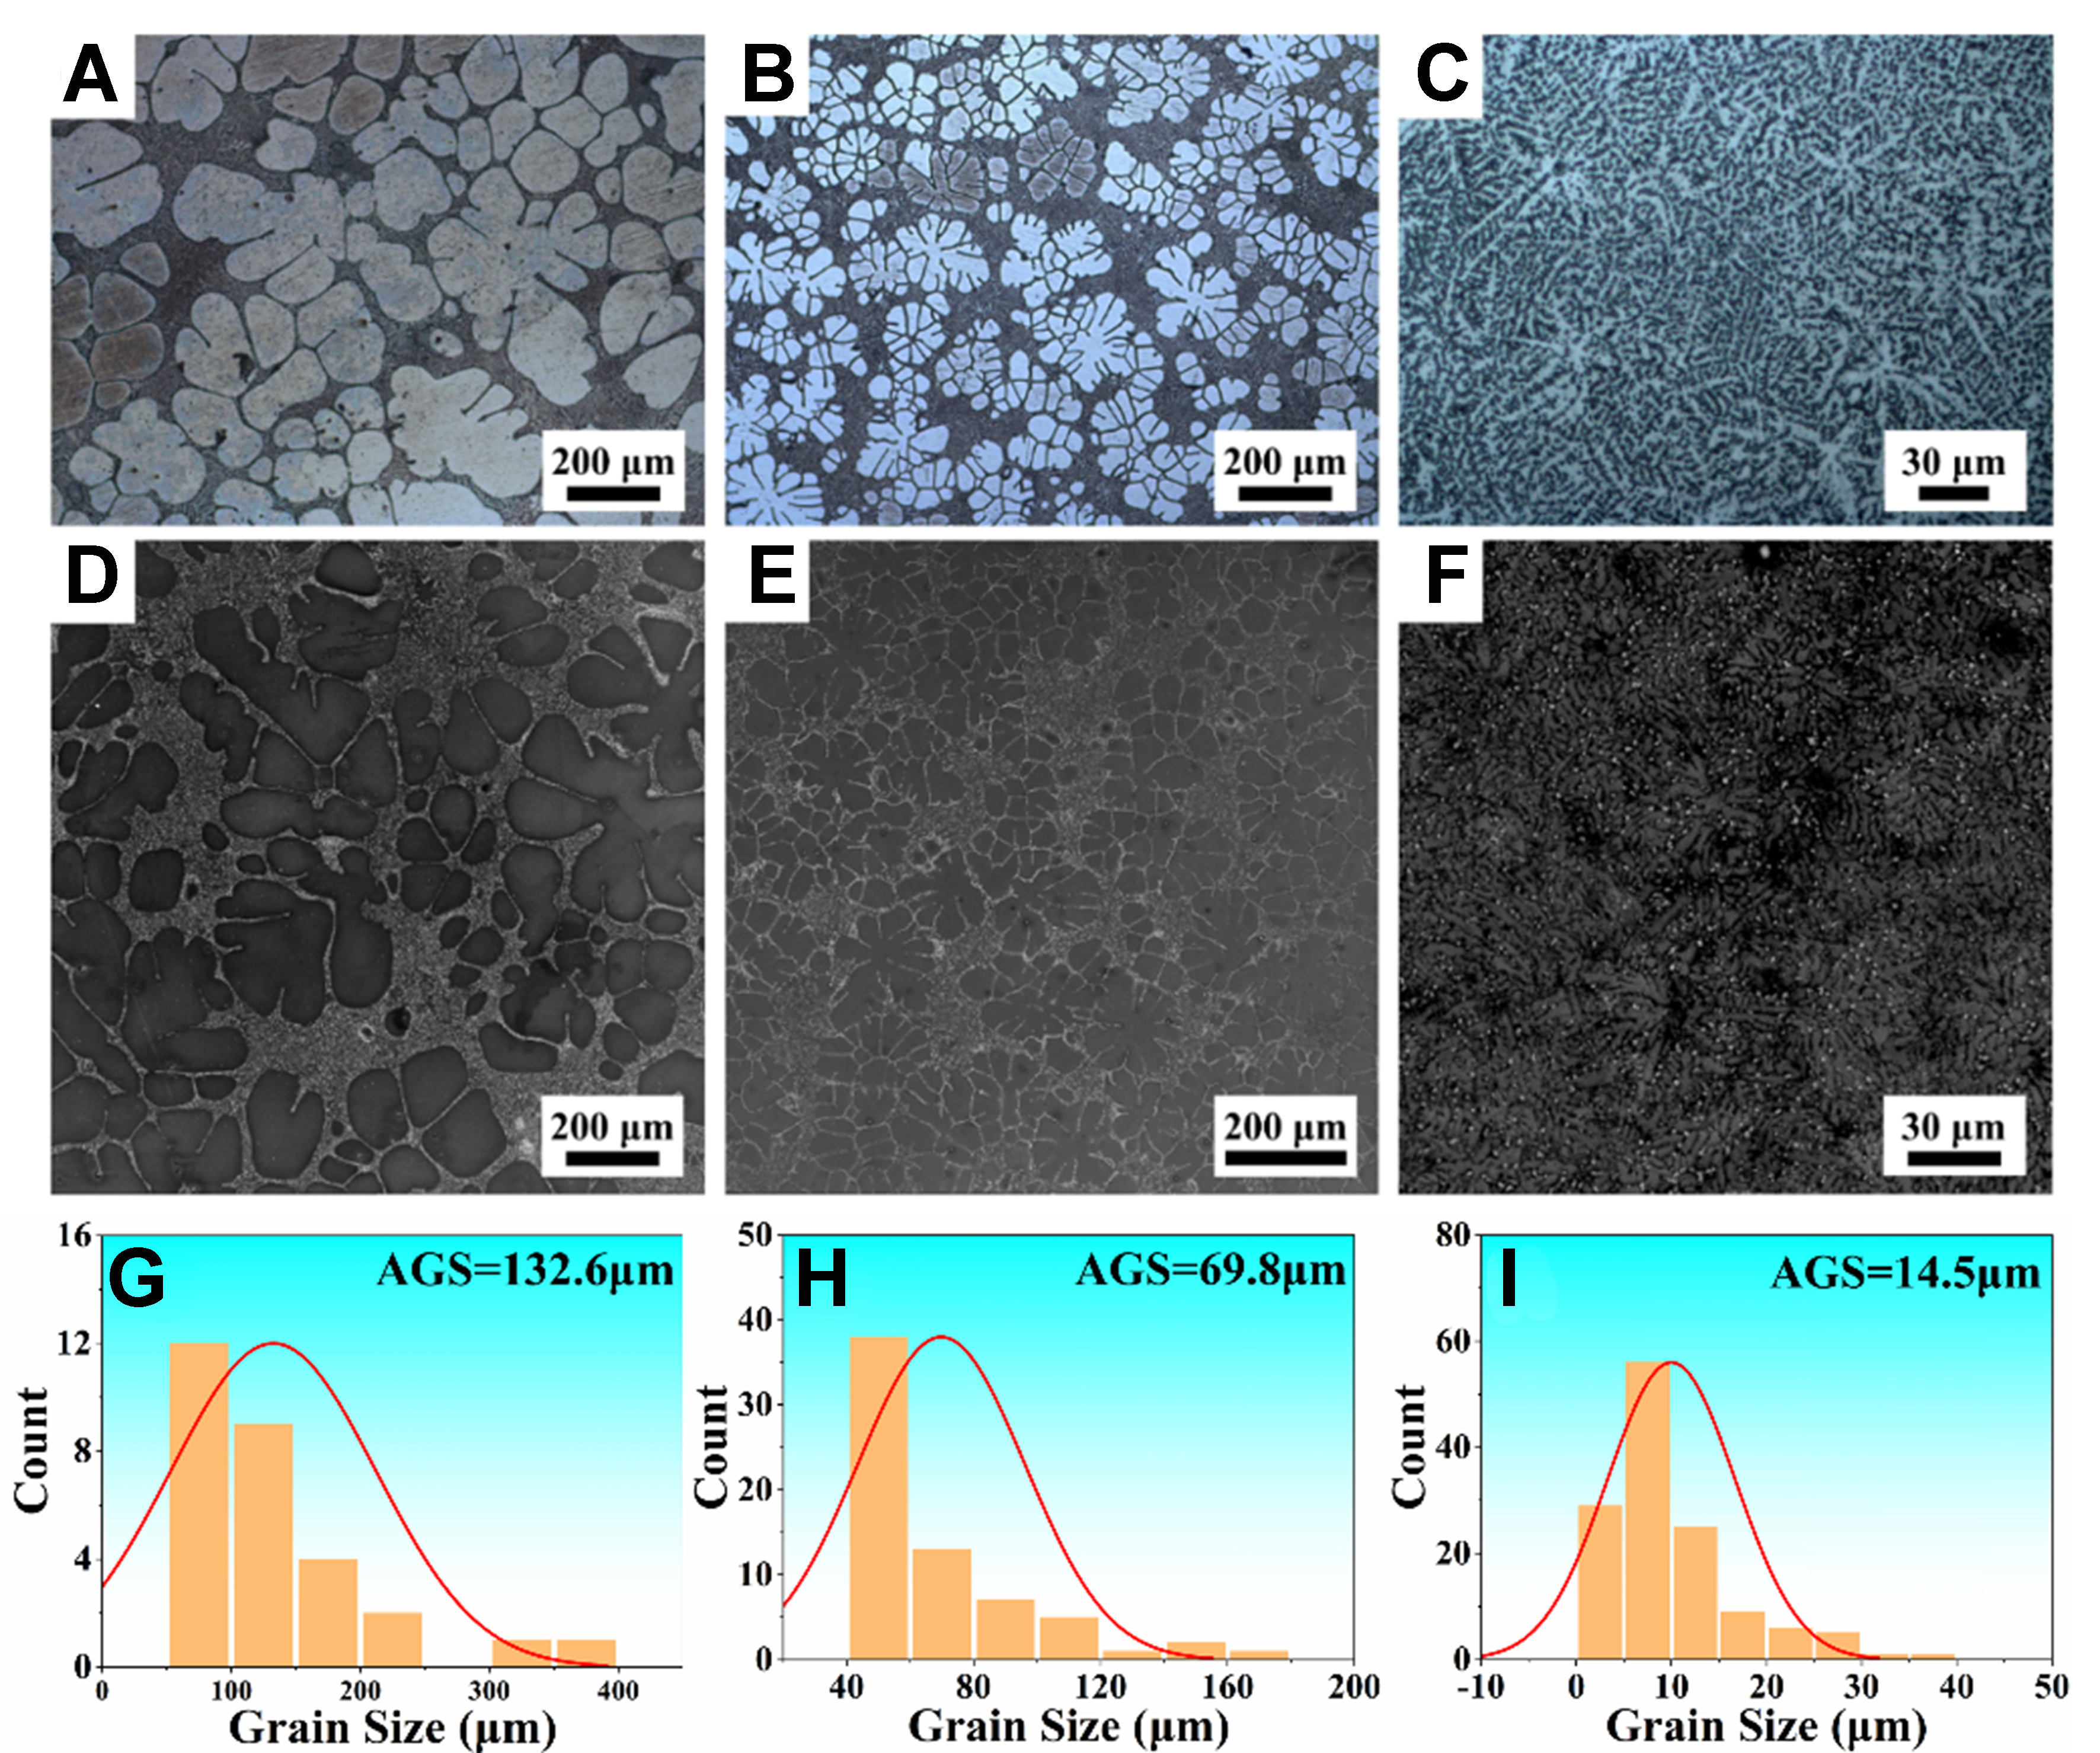
Figure 18. OM and SEM images of Mg-6Al alloy: (A, D, G) furnace cooling; (B, E, H) air cooling; (C, F, I) water cooling. OM: Optical microscopy; SEM: scanning electron microscope; AGS: average grain size.
Figure 19 shows the simulated microstructures of the Mg-6Al alloy under the three cooling conditions. In the furnace cooling simulation, the dendrite growth rate is slow with severe coarsening, resulting in cluster-like morphology. Under the air cooling, the primary dendrite trunks are smaller than those under the furnace cooling, while the secondary arms are longer. Under the water cooling, the dendrite arms are slender and densely populated with numerous secondary branches, exhibiting distinct six-fold symmetry. The phase-field simulation results are consistent with the experimental observations in Figure 18.
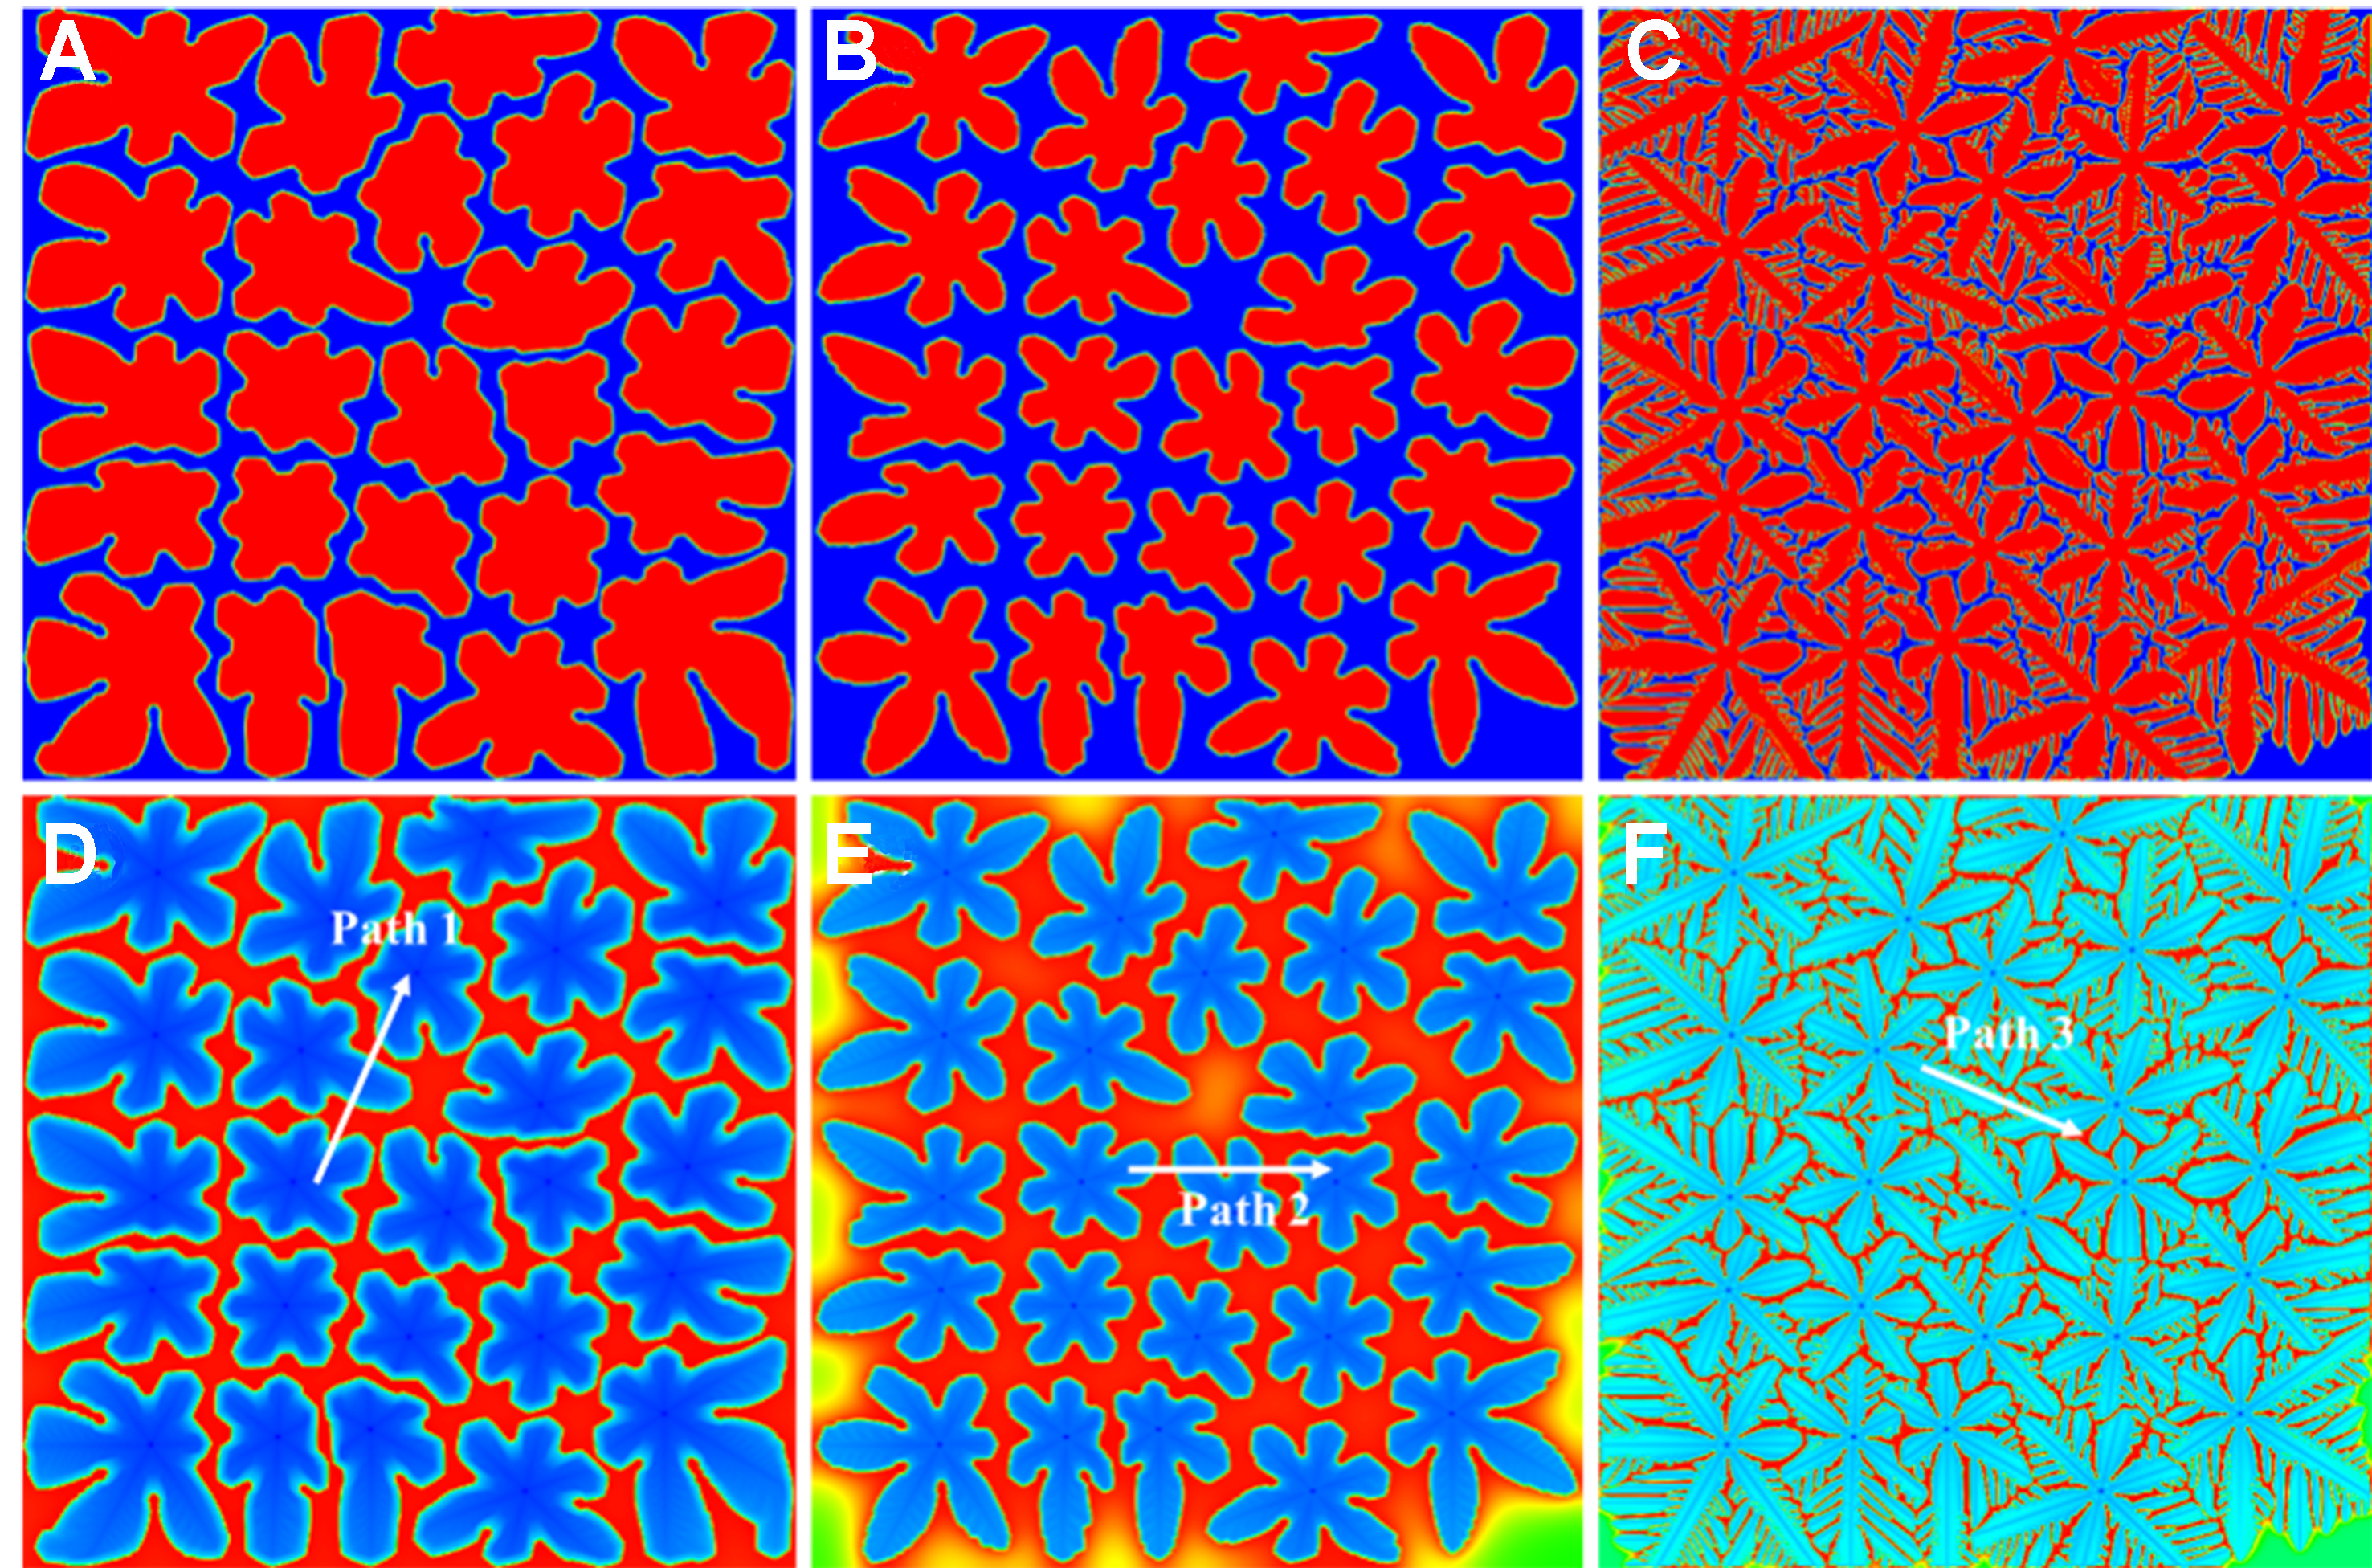
Figure 19. Dendrite morphology and solute distribution of Mg-6Al alloy simulated by PFM: (A and D) furnace cooling; (B and E) air cooling; (C and F) water cooling. PFM: Phase-field method.
Based on Figures 18 and 19, the PDAS is measured and compared, as listed in Table 2. For experiments, 30-50 random regions (each 20 × 20 μm2) are analyzed per cooling condition to ensure representativeness; for simulations, the PDAS is extracted from 10 independent domains to avoid finite-size effects. Under all three cooling conditions, the simulated PDAS values are consistent with the experimental results, with relative errors less than 9%, confirming the model accurately captures dendrite refinement/coarsening trends driven by the cooling rate.
Quantitative comparison of PDAS between experiments and simulations
| Cooling condition | Experimental PDAS (μm) ± Std. Dev.1 | Simulated PDAS2 | Relative error |
| Furnace cooling (0.07 K/s) | 45 ± 4.2 | 48.6 | 8.0% |
| Air cooling (2.9 K/s) | 19 ± 2.3 | 17.3 | 8.9% |
| Water cooling (181 K/s) | 5.5 ± 0.7 | 5.9 | 7.3% |
Figure 20 presents the solute distribution of the Mg-6Al alloy under the three cooling conditions. The results indicate that the effect of cooling rate on solute distribution is closely related to diffusion mechanisms. Under the furnace cooling, the solute atoms diffuse sufficiently, leading to distinct compositional difference between the Mg matrix and the interdendritic regions [Figure 20A-C]. This occurs because slow cooling follows an equilibrium solidification mode, where Al rejected by growing dendrites diffuses and accumulates in the liquid phase, forming severe microsegregation. Under the air cooling, the solute diffusion is restricted, reducing Al segregation and improving the distribution uniformity of Mg and Al. Under the water cooling, the extremely high cooling rate greatly shortens solute diffusion time, and the solidification approaches a diffusionless state. Consequently, Al distributes more uniformly in the matrix, and the microsegregation is significantly mitigated. The phenomena align with the solute field distribution from phase-field simulations [Figure 19D-F]. In the furnace cooling simulation, the solute diffuses sufficiently, resulting in uniform solute distribution in the liquid phase. In the air cooling simulation, the increased cooling rate limits solute diffusion, leading to non-uniform solute distribution. In the water cooling simulation, the high cooling rate suppresses diffusion entirely, increasing solid concentration and confining Al enrichment to interdendritic regions.
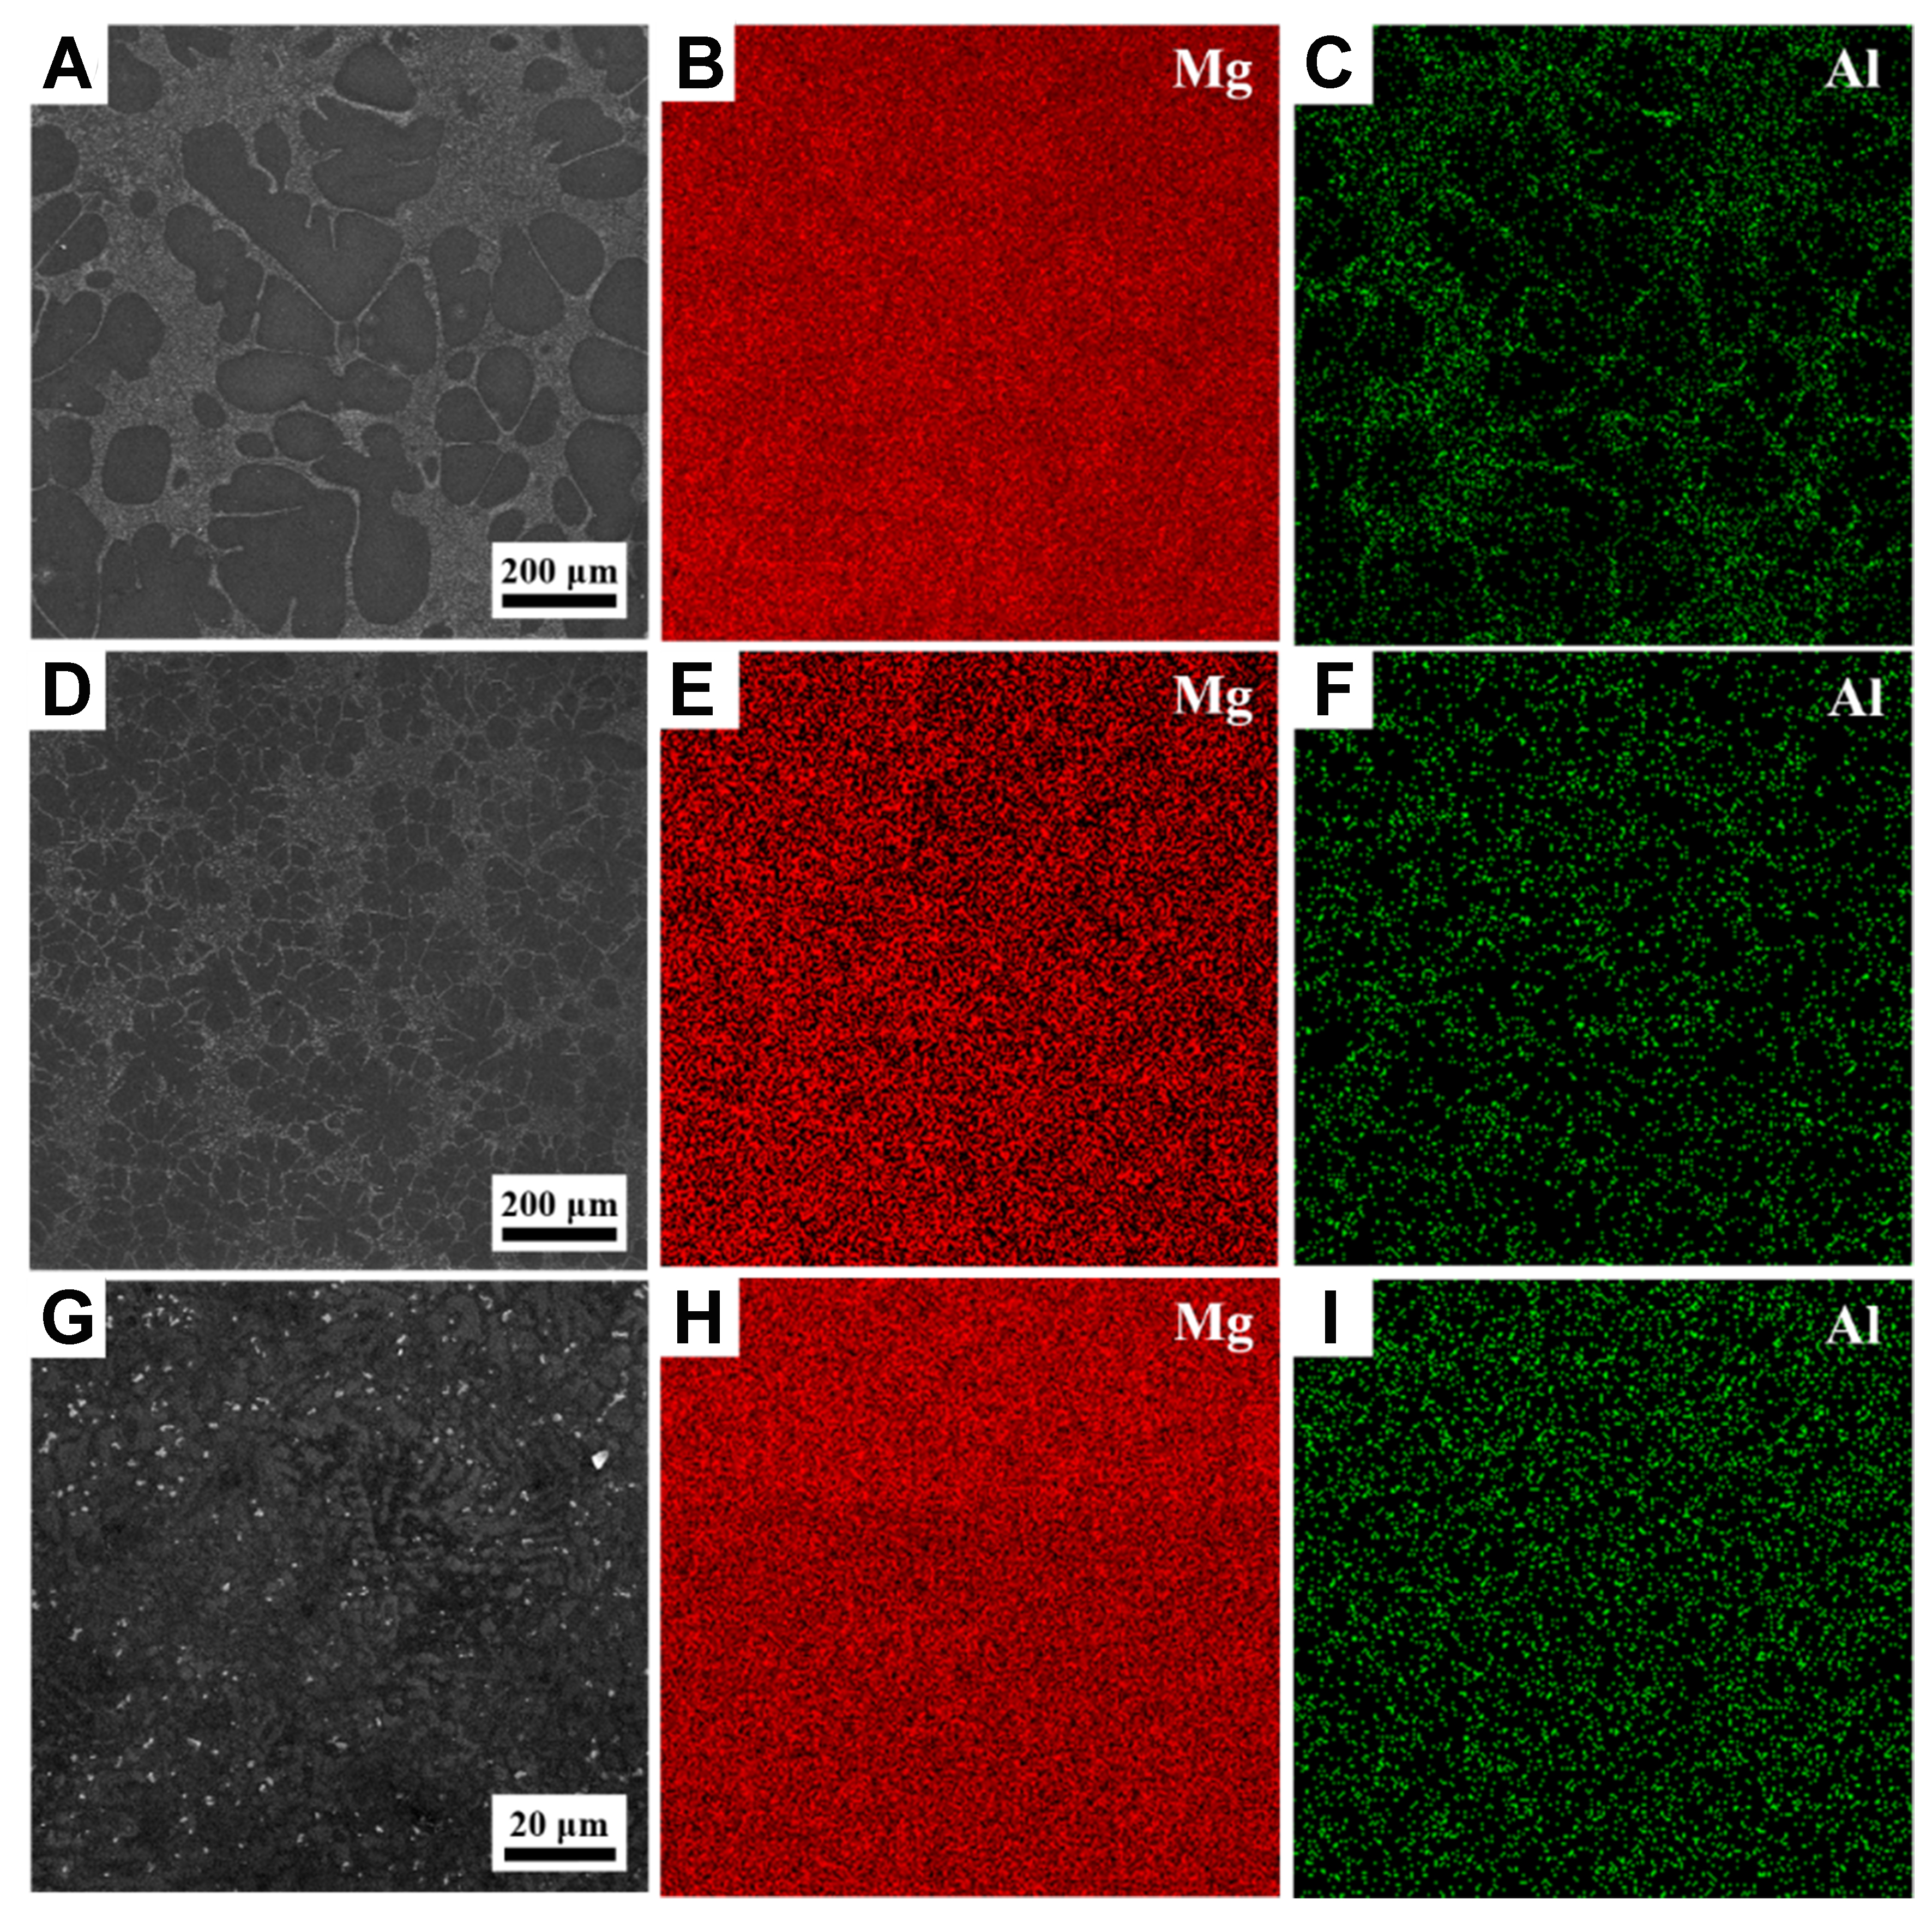
Figure 20. Solute distribution of Mg-6Al alloy: (A-C) furnace cooling; (D-F) air cooling; (G-I) water cooling.
Figure 21 shows the EDS line scan results. Under the furnace cooling, the Al intensity along Path 4 exhibits significant peaks at interdendritic regions (A, B), indicating pronounced Al enrichment. This is because Al atoms rejected by dendrite growth diffuse sufficiently and accumulate between dendrites, forming severe microsegregation. Conversely, Mg intensity shows inverse fluctuations, reflecting compositional differences between the matrix and interdendritic regions. Under the air cooling, the amplitude of Al intensity variation along Path 5 decreases, indicating reduced segregation due to restricted solute diffusion at elevated cooling rates. Under the water cooling, Al and Mg intensity profiles along Path 6 show small fluctuations, suggesting uniform element distribution, as the extremely rapid cooling approaches a diffusionless solidification state. Collectively, the line scan results confirm that the cooling rate influences the solidification process by regulating solute diffusion kinetics.
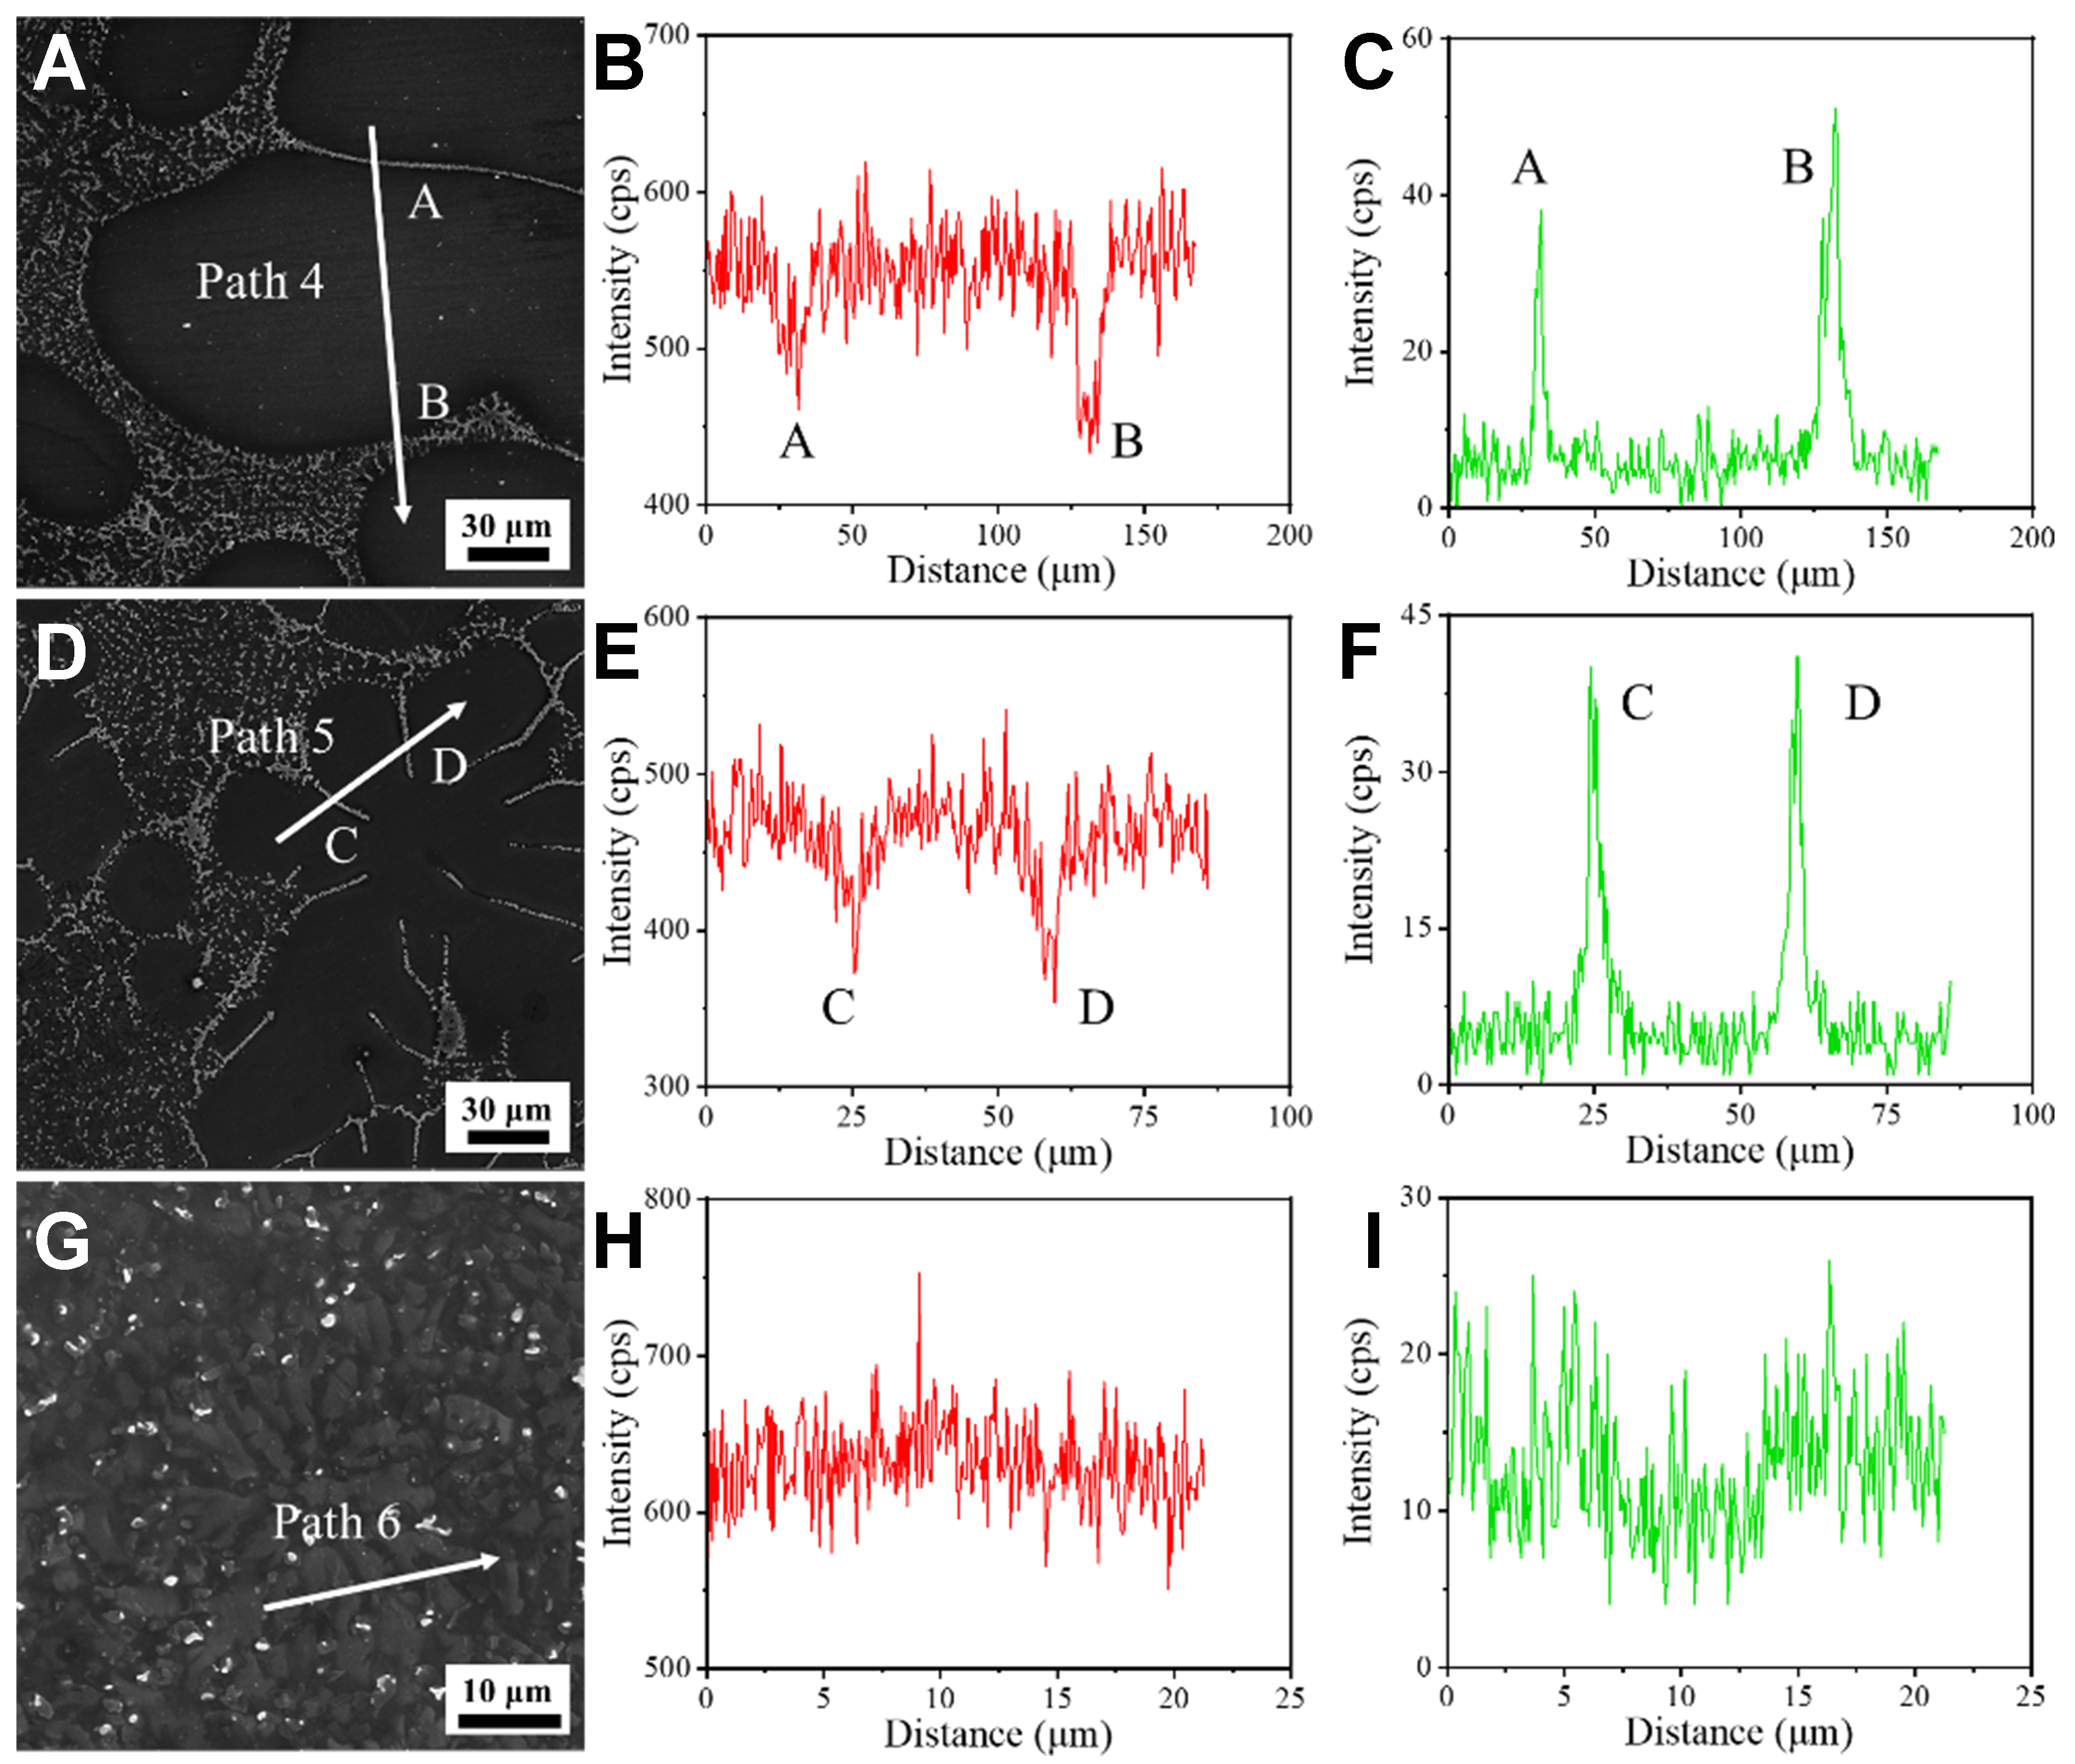
Figure 21. EDS line scan results of Mg-6Al alloy: (A-C) furnace cooling; (D-F) air cooling; (G-I) water cooling. EDS: Energy dispersive spectrometer.
The phase-field simulation results [Figure 22] further confirm this behavior. Al solute is less distributed within dendrites but primarily enriched in the interdendritic liquid region. With the increase of cooling rate, the average solute concentration in the solid phase rises from 2.83 wt.% to 4.07 wt.%, demonstrating enhanced solute trapping effects that retain more solute atoms in the solid phase.
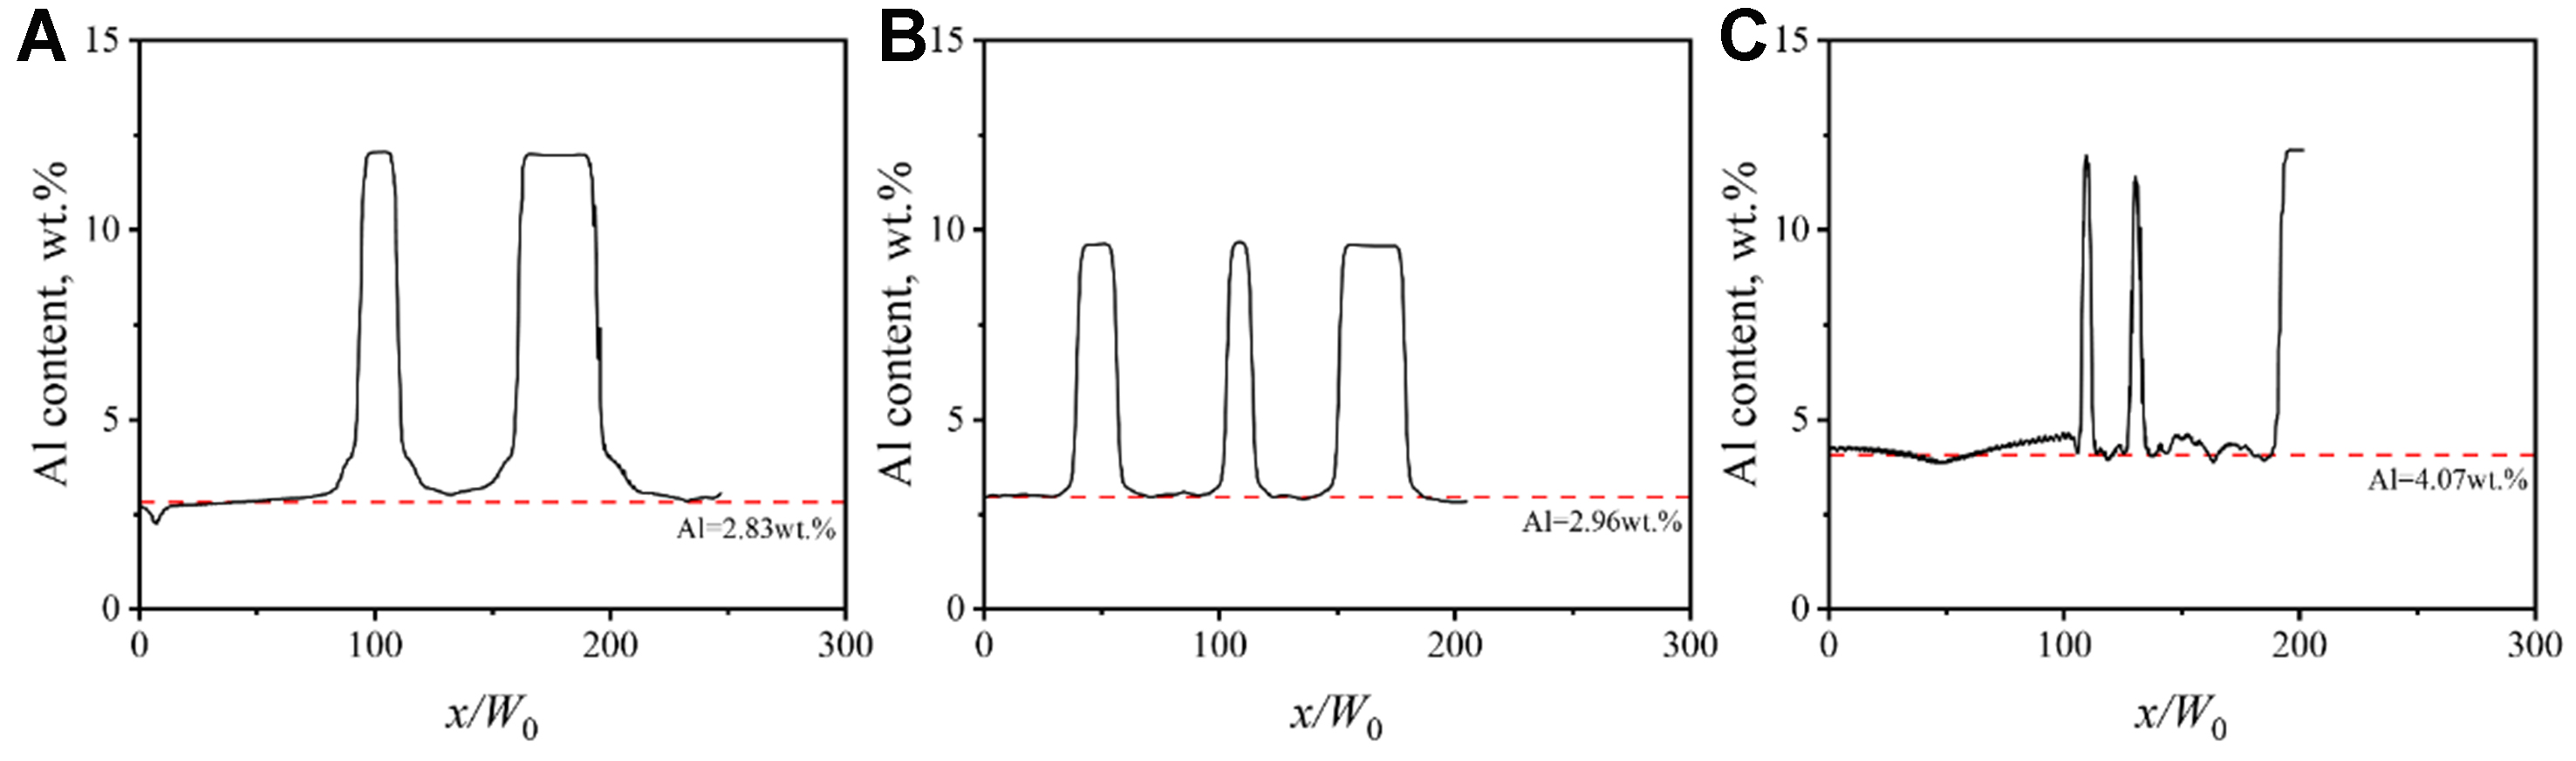
Figure 22. Solute-distance curves of Mg-6Al alloy simulated by PFM: (A) Path 1 in Figure 19D; (B) Path 2 in Figure 19E; (C) Path 3 in Figure 19F. PFM: Phase-field method.
Figure 23 shows the point scan results of the Mg-6Al alloy. Under the furnace cooling, the Al content in matrix regions (Point 1, 2) is only 2.23 wt.% and 3.01 wt.%, slightly higher than the equilibrium solid-phase solute concentration (cs = kec∞ = 1.96 wt.%). In the precipitate regions (Point 3, 4), the Al content rises to 10.63 wt.% and 7.32 wt.%. This occurs because slow furnace cooling allows sufficient solute diffusion, leading to significant Al enrichment between dendrites, i.e., severe microsegregation. Under the air cooling, the Al content within dendrites (Point 1) increases, attributed to the solute trapping. Under the water cooling, the difference in Al content across positions is drastically reduced: the Al content difference between Point 1 (5.45 wt.%) and Point 3 (8.54 wt.%) is significantly lower than that under the furnace cooling. The extremely rapid cooling restricts solute diffusion, making solidification approach a diffusionless state. The Al content within dendrites (5.45 wt.%, 5.29 wt.%) approaches the initial concentration (5.94 wt.%). These results indicate that the cooling conditions regulate solute diffusion during solidification by influencing the degree of non-equilibrium effects, thereby affecting the solidification behavior.
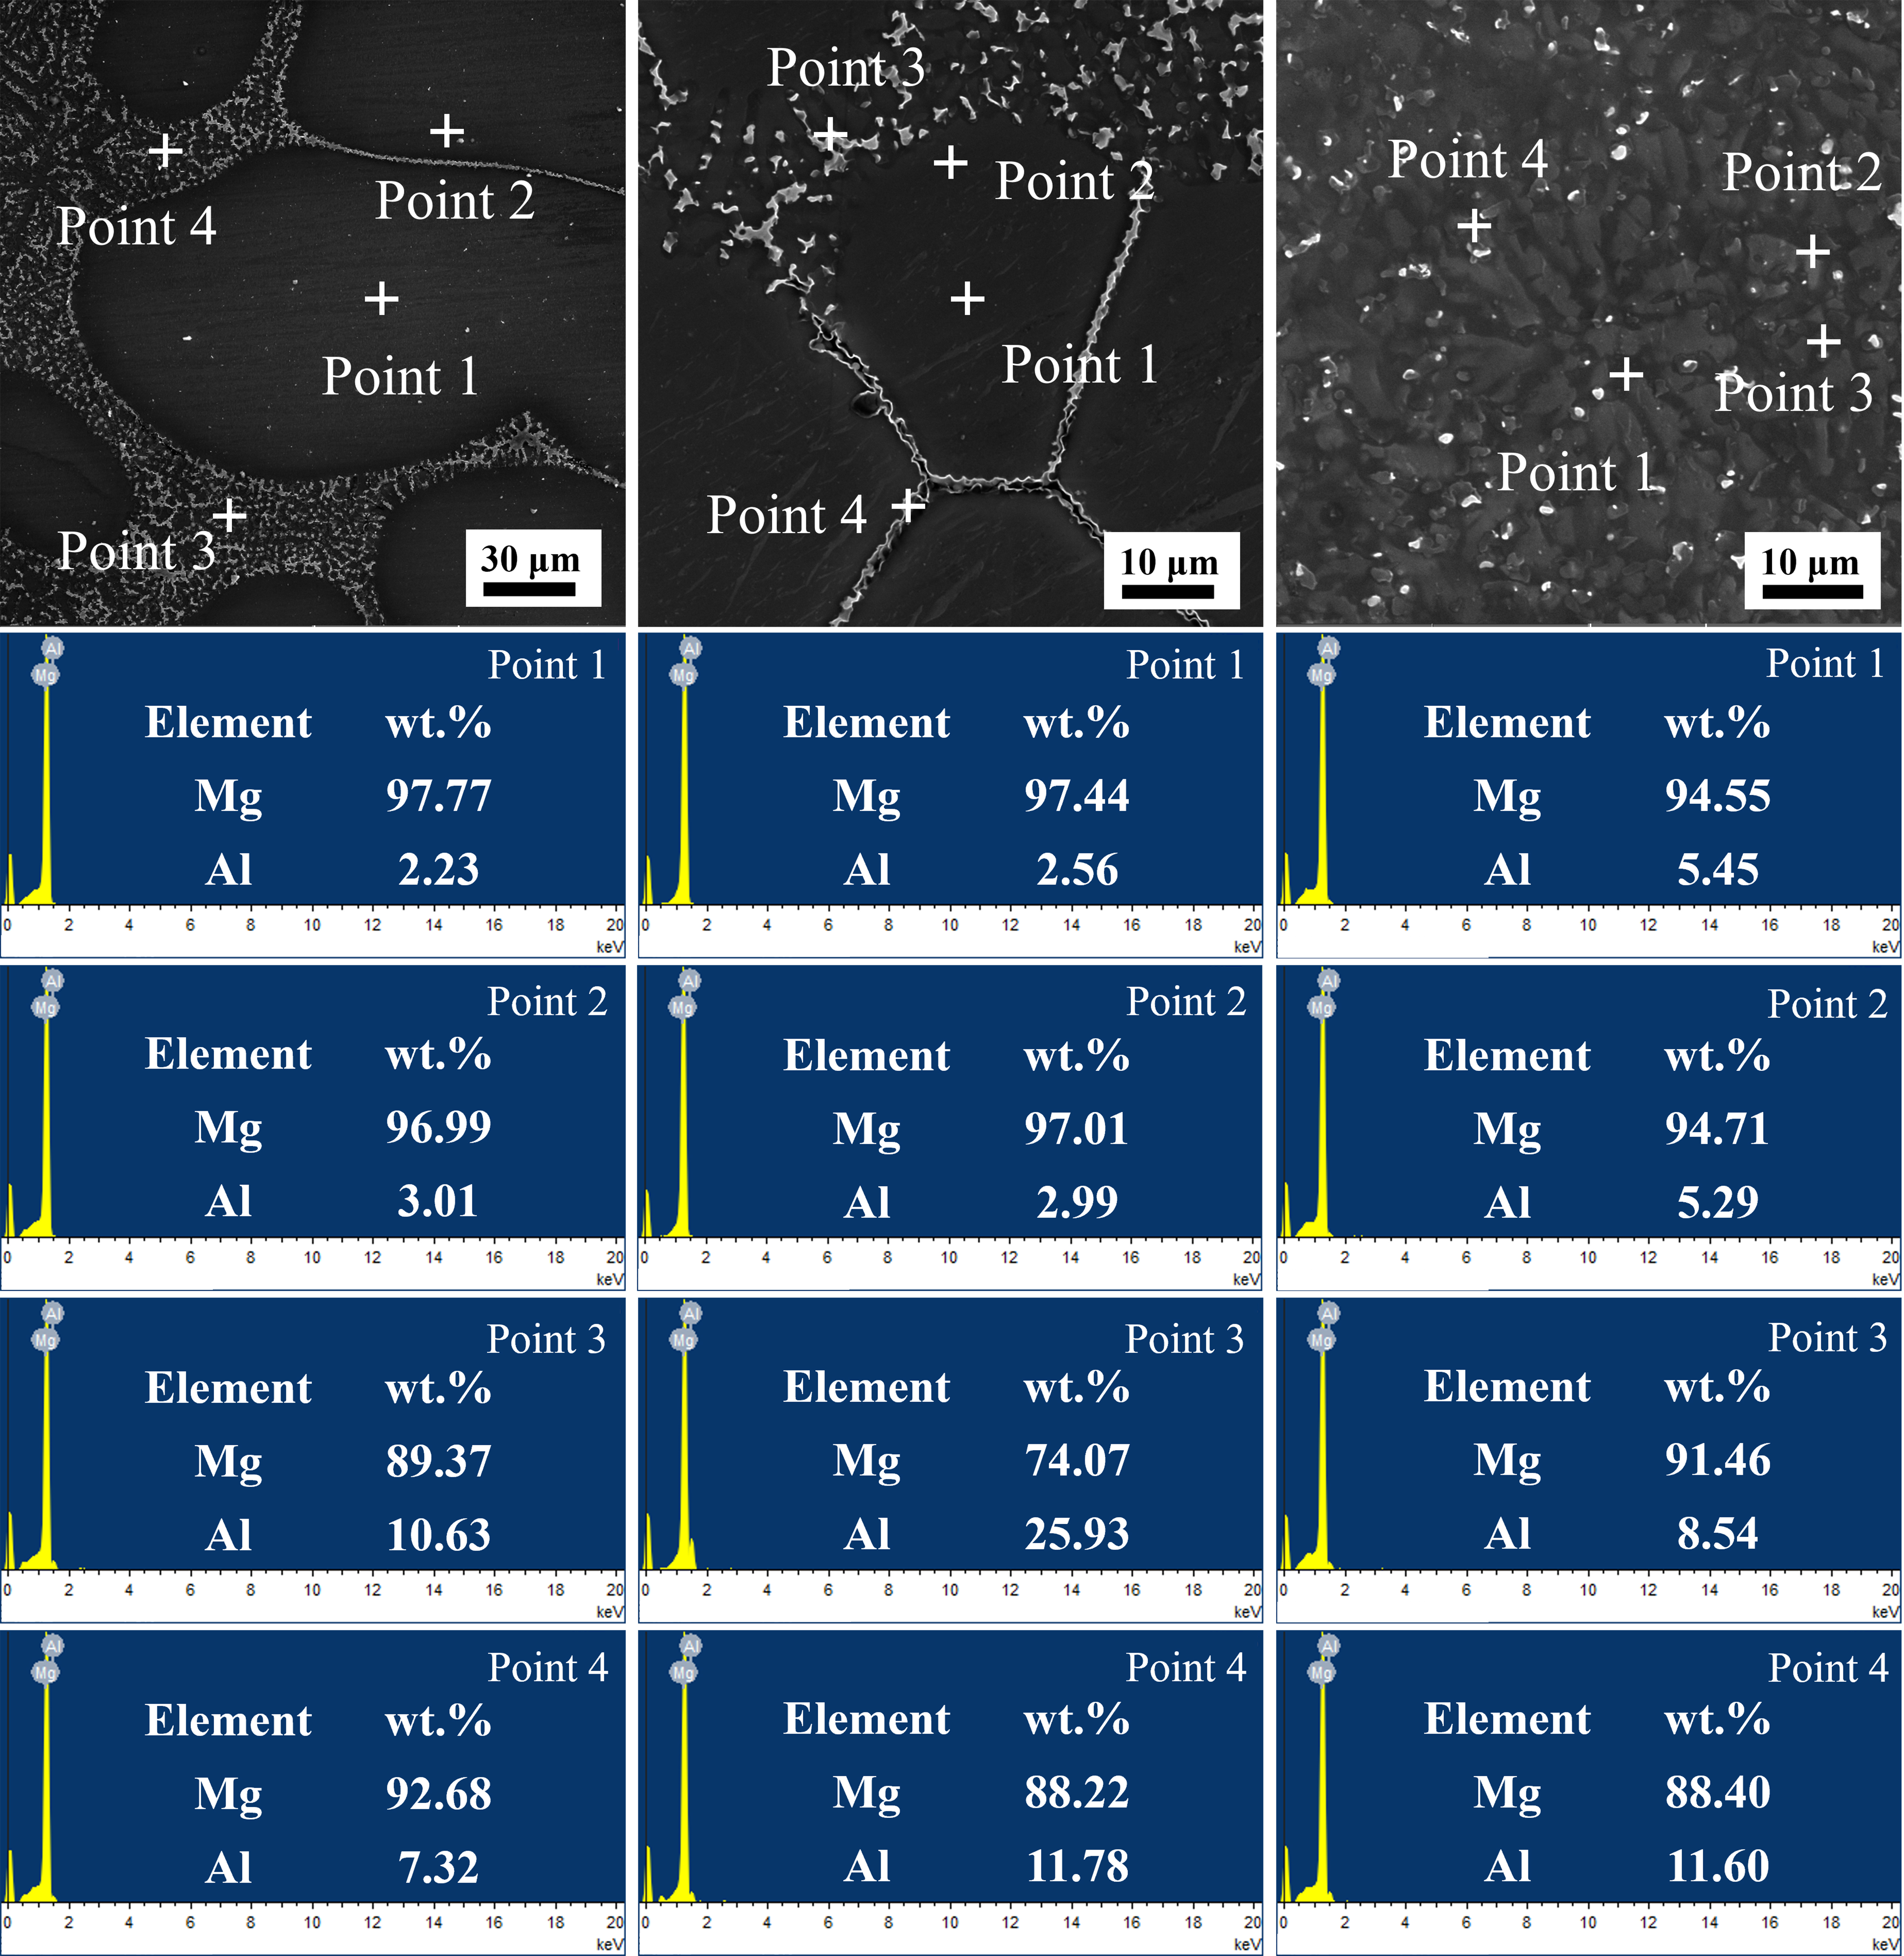
Figure 23. EDS point scan results of Mg-6Al alloy: (A-C) furnace cooling, air cooling, and water cooling. EDS: Energy dispersive spectrometer.
A quantitative matching can be performed in terms of the solid-phase solute concentration which is a marker of solute trapping. Extracted from EDS point scans [Figure 23] and simulated solute field outputs [Figure 22], Table 3 shows the quantitative comparison of the solid-phase solute concentration. The simulated concentration values align well with the experimental results, validating the ability of the model to reproduce the non-equilibrium solute trapping (i.e., increased solid concentration with cooling rate). The larger relative error at 181 K/s can be attributed to that the EDS point scan (spatial resolution ~1 μm) cannot distinguish between “Al in the supersaturated matrix” and “Al in metastable precipitates”, resulting in overestimated experimental values of matrix solid-phase concentration. Additionally, rapid quenching induces slight surface oxidation or microcracks, further interfering with local EDS signal accuracy.
Quantitative comparison of solid-phase solute concentration between experiments and simulations
| Cooling condition | Experimental value (wt.% Al) ± Std. Dev.1 | Simulated value (wt.% Al)2 | Relative error |
| Furnace cooling (0.07 K/s) | 2.6 ± 0.22 | 2.83 | 8.8% |
| Air cooling (2.9 K/s) | 3.0 ± 0.19 | 2.96 | 1.3% |
| Water cooling (181 K/s) | 5.4 ± 0.26 | 4.07 | 24.6% |
Although the solute partition coefficient is the focus of this study, the adopted experimental methods struggle to meet this core requirement. The solute partition coefficient k is defined as the ratio of the solute concentration in the solid phase to that in the liquid phase just at the solid-liquid interface. Its measurement requires accurate capture of instantaneous concentration at the interface. The following three challenges limit accurate characterization of the solute partition coefficient.
(1) Non-direct observability of interface concentration: Neither OM, SEM, nor EDS can directly observe the instantaneous concentration at the solid-liquid interface. The compositions measured by EDS (e.g., line scan and point scan results) are essentially the average concentrations in specific regions of the solidified sample, rather than the concentrations at the interface during solidification.
(2) Non-equilibrium interference under quasi-rapid solidification: This study focuses on quasi-rapid solidification with high cooling rates. In this case, the solid-liquid interface migrates dynamically, accompanied by significant solute trapping and solute drag effects. During experiments, the diffusion, enrichment, and trapping of solute atoms at the interface are instantaneous dynamic processes, while the sample preparation (e.g., quenching) freezes these processes. As a result, the measured composition is actually a frozen product of non-equilibrium states.
(3) Insufficient spatiotemporal resolution of experimental techniques: The measurement of the solute partition coefficient requires accurate matching with the dynamic evolution of the solid-liquid interface in both time and space scales. However, the adopted experimental techniques cannot overcome the limitations of spatiotemporal resolution. The interface region measured in experiments usually includes the transition zone and adjacent solid-liquid regions, leading to the averaging of concentration data and the inability to obtain extract concentrations at the interface.
Although the experiments are not used to directly validate the simulated solute partition coefficient k, the reliability is indirectly ensured through theoretical self-consistency and macroscale experimental validation, specifically reflected in theoretical matching between the PFM and the CGM [Figure 4B] and consistency between macroscale experimental results and simulations. The dendrites are finer, and the solute distribution is more uniform under water cooling in experiments [Figures 18C and 20G-I], which is consistent with the enhanced solute trapping and increased k in simulations under high cooling rates, leading to improved solid solubility. With increasing cooling rate in experiments, the composition difference between dendrite trunks and interdendritic regions decreases [Figures 21 and 23], which fully aligns with the trend in simulations where k increases (enhanced solute trapping) with increasing cooling rate. These macroscale consistencies indicate that the setting of the solute partition coefficient k in the model can correctly reflect the solute partition law under quasi-rapid solidification.
By matching the phase-field simulation with the CGM theory, the challenge of experimental measurement of the concentrations at the interface is avoided and reliable validation of k is achieved. Meanwhile, the consistency between experimental and simulated dendrite morphology and solute distribution further indirectly supports the rationality of k, forming a complete logical closed loop of “theory-simulation-experiment”.
Furthermore, the die casting, typical quasi-rapid solidification process, is a commonly used casting process for Mg-Al alloys. The simulated results are also used to compare with the die-casting microstructures. Because of non-uniform cooling rates, the die-casting microstructure is divided into three regions: central zone, transition zone, and surface zone. Figure 24A and B show the overall microstructure characteristics of die-casting AM60 alloy. The grains show a change from fine and dense to coarse and loose gradually from the surface zone to the central zone. The results of using three typical cooling rates as the input for the phase-field simulation are shown in Figure 24C-E. At 10 K/s, the dendrites are coarse and irregular in shape. At 104 K/s, the grains are fine and dense. The simulation results are also in good agreement with the experimental results.
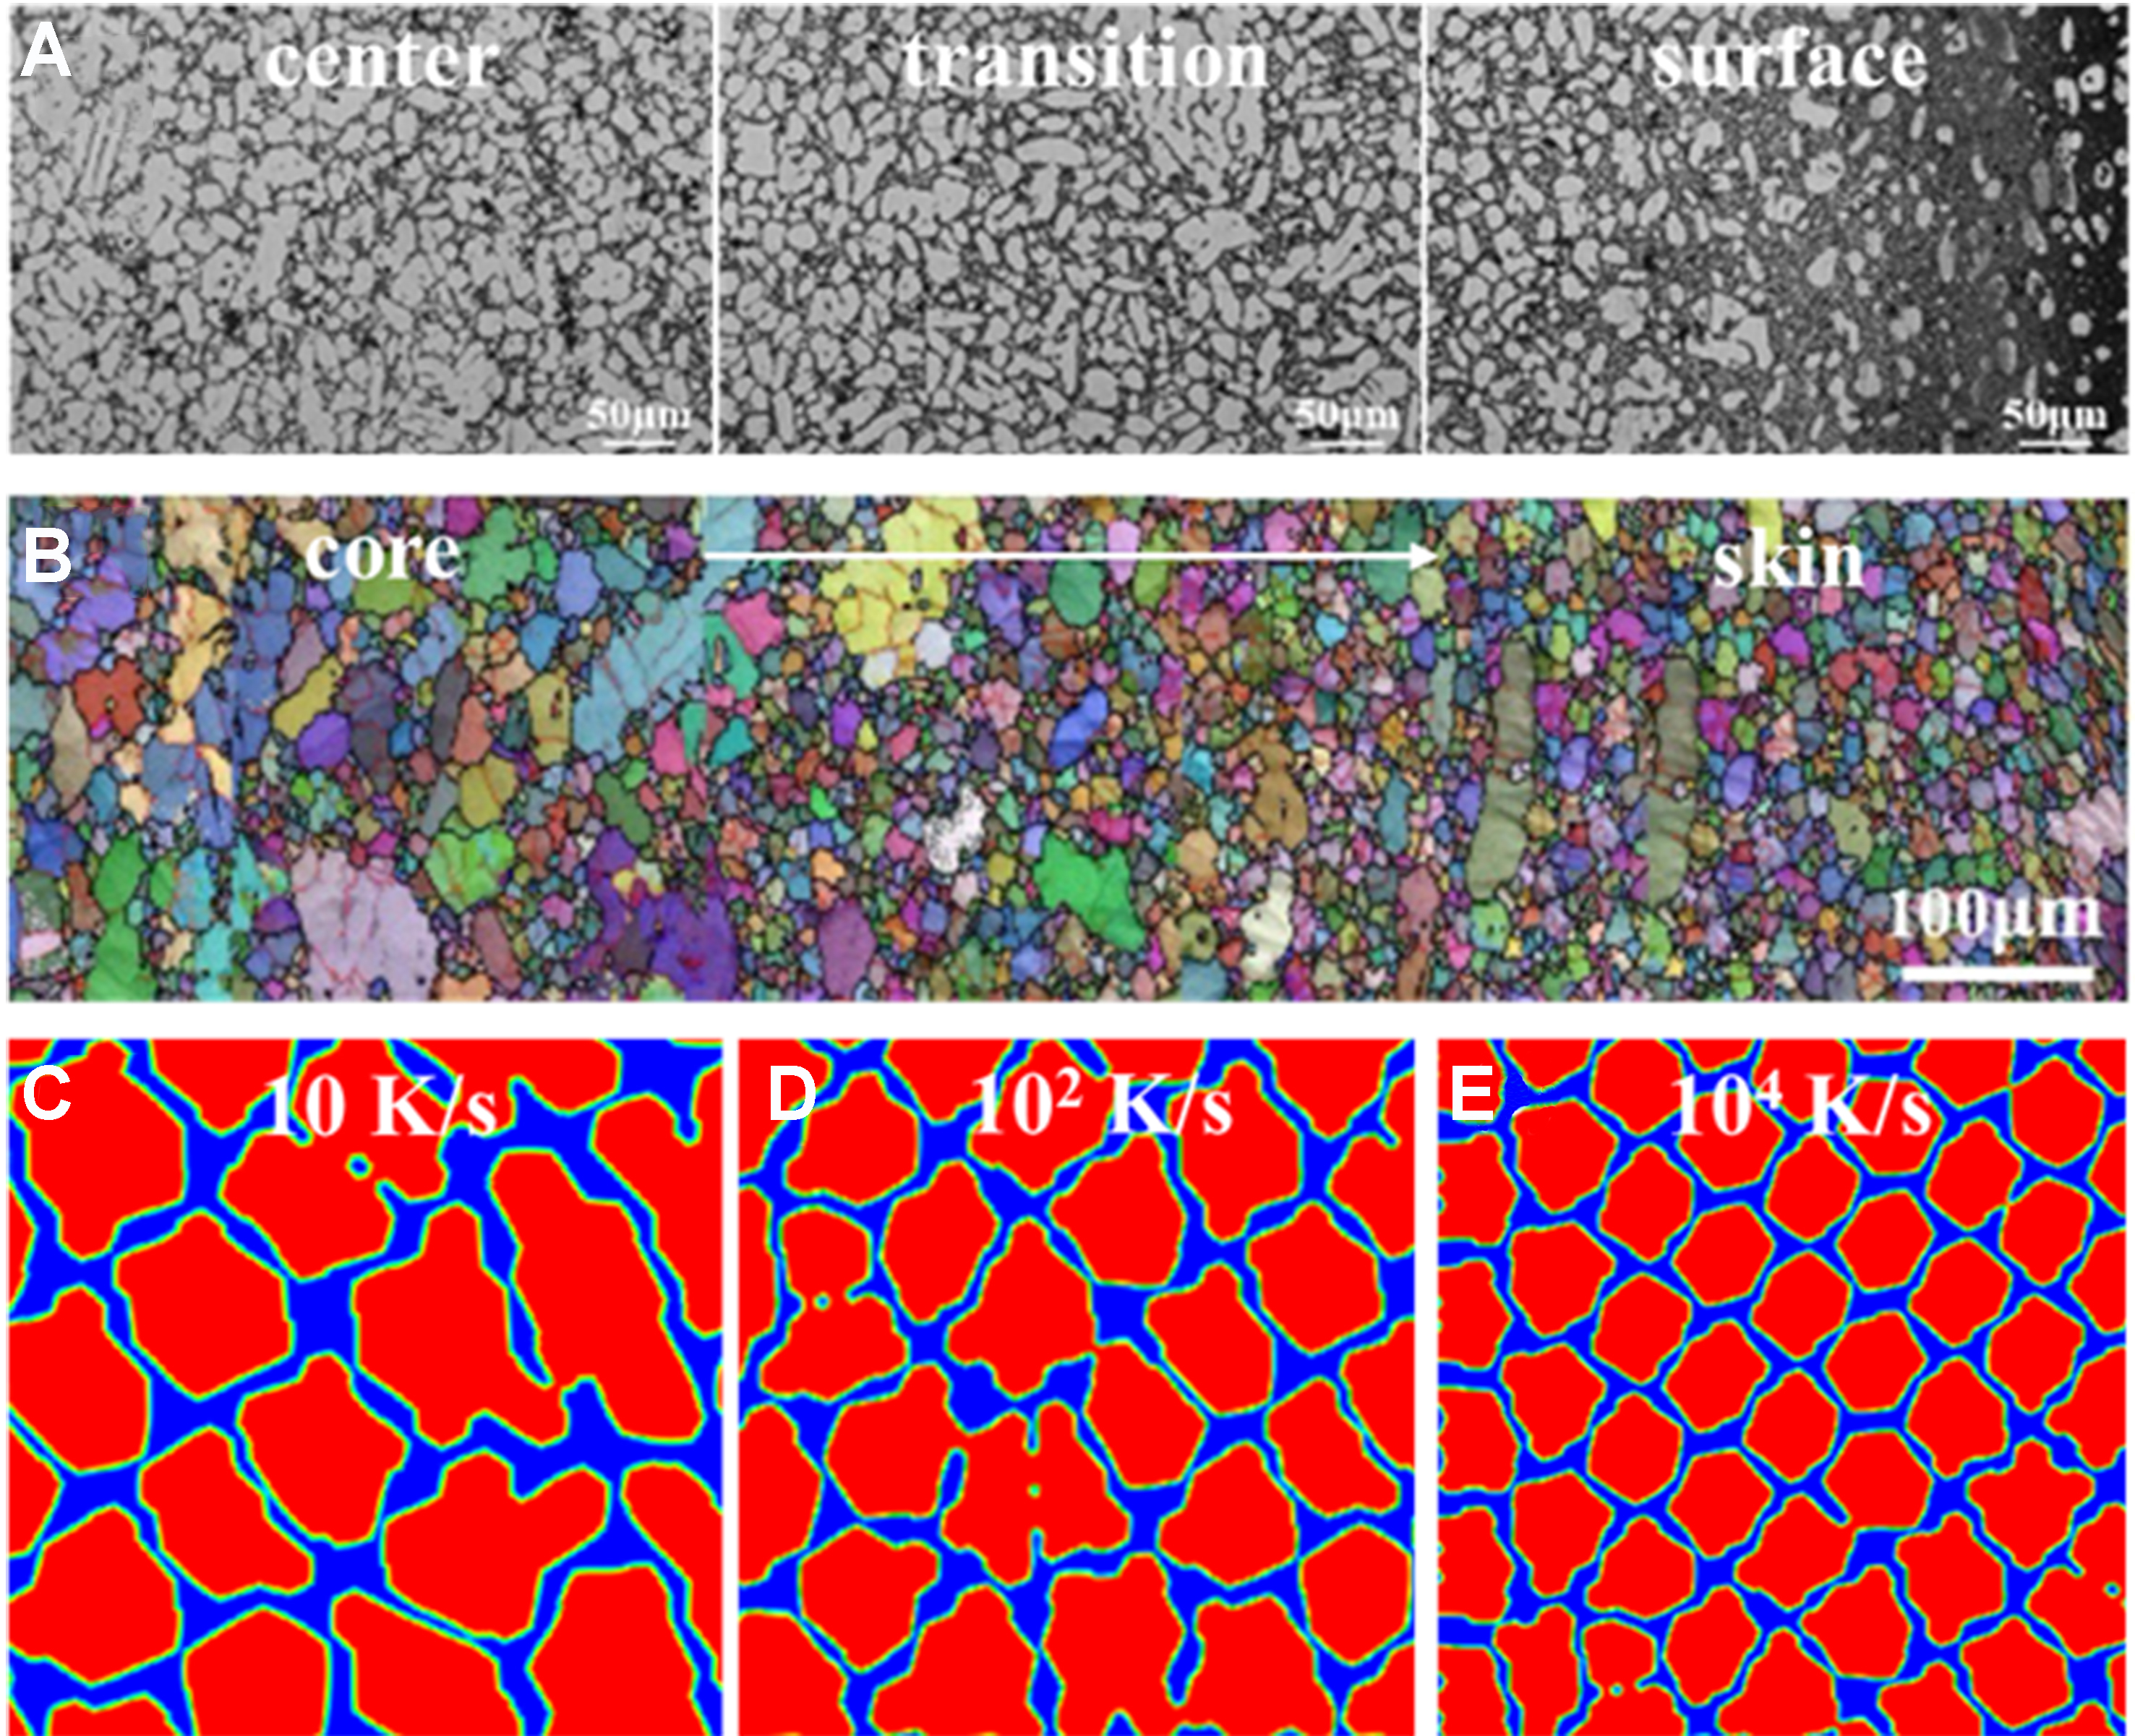
Figure 24. (A) Microstructure of die-casting AM60 alloy; (B) EBSD results of die-casting AM60 alloy; (C-E) Phase-field simulated dendrite morphology of die-casting Mg-6Al alloy. EBSD: Electron backscattered diffraction.
Hcp structure-specific physical mechanisms of solute trapping/drag
The hcp crystal structure differs fundamentally from face-centered cubic (fcc) or body-centered cubic (bcc) structures in lattice symmetry, slip systems, and atomic diffusion paths, all of which directly modulate the non-equilibrium effects of solute trapping and solute drag during quasi-rapid solidification.
The solute trapping occurs when the solute (Al) diffusion lags behind the solid-liquid interface migration. In hcp Mg, Al atoms exhibit highly directional diffusion, which conforms to the six-fold symmetry. Besides, Mg has only 3 independent slip systems at room temperature, resulting in higher interface rigidity than cubic structural metals. During rapid interface migration, the rigid hcp interface cannot accommodate solute-induced lattice distortions as flexibly as fcc or bcc interfaces. This further inhibits Al atom expulsion from the solid phase, increasing the likelihood of solute being “frozen” in the matrix.
The current simulations focus on the growth behavior on the 2D level, i.e., in the basal plane. If extended to the 3D level, the difference between the basal plane and the prismatic plane can further complicate the structure-specific physical mechanisms of solute trapping/drag. For example, the anisotropic energy can modulate the solute drag strength spatially. Along the c-axis, the interface is dominated by the prismatic planes with high energy, i.e., the Al segregation here is less stable, so the solute drag is weaker. In the basal plane, the low interface energy can stabilize the Al segregation, enhancing drag.
CONCLUSION
To investigate the non-equilibrium dendrite evolution of Mg-6wt.%Al alloy (a core candidate for Mg alloy gigacastings) during quasi-rapid solidification, a quantitative phase-field model is employed. This model is validated by matching the simulated partition coefficients with the CGM, where the non-equilibrium partition coefficient k(V) under quasi-rapid solidification shows a consistent increasing trend with the dendrite tip velocity compared to the theoretical CGM curve. This study systematically analyzes the effects of key solidification parameters (undercooling, cooling rate, orientation angle) on the dendrite growth, extends the analysis of partial solute drag conditions via thermo-kinetic coupling, and further validates the simulation results with experimental data. Critical conclusions, together with direct implications for gigacasting process control and mechanical property optimization, are as follows:
Competitive mechanisms of solute trapping and solute drag: guiding gigacasting cooling rate window design
The solute trapping significantly enhances the dendrite tip growth velocity (0.4 m/s under zero drag vs.
Implication: For gigacasting where large components suffer from uneven cooling, this finding defines an optimal cooling rate window. In the surface zones (high cooling rate), the solute trapping is prioritized to refine dendrites, enhancing tensile strength via grain refinement strengthening and solid solution strengthening. In the central zones (low cooling rate), the solute drag is moderated to avoid excessive dendrite coarsening and mitigate microsegregation, ensuring uniform elongation. This window prevents both “over-quenching” (surface cracking from extreme cooling) and “under-quenching” (central zone brittleness from coarse dendrites), directly informing gigacasting mold design (e.g., localized water-cooling channels for surface zones) and process parameter tuning (e.g., melt pouring temperature to adjust cooling rate gradients).
Effects of undercooling and cooling rate on equiaxed dendrites: optimizing gigacasting microstructure uniformity
The undercooling (Δ = 28-36 K) accelerates dendrite growth and narrows the solute diffusion layer: at Δ = 0.45 (36 K), the diffusion layer width under zero drag is 20.5 x/W0, which is narrower than that at Δ = 0.35 (28 K, 32.8 x/W0). This promotes secondary branching and dendrite refinement. The cooling restricts the solute diffusion, increasing the interfacial concentration gradient. At 181 K/s, the solute concentration gradient under zero drag is higher than that at 0.07 K/s, enhancing constitutional undercooling. Experimentally, the PDAS decreases from ~45 ± 4.2 μm (0.07 K/s, furnace cooling) to ~5.5 ± 0.7 μm (181 K/s, water cooling), with simulated PDAS values showing relative errors less than 9%, confirming the ability of the model to capture dendrite refinement trends.
Implication: This quantifies how to reduce “size effect” of gigacasting, i.e., microstructure variation across thick/thin sections by adjusting temperature. For thin-walled regions (faster cooling), control undercooling to avoid excessive tertiary branching (which causes porosity); for thick-walled regions, increase undercooling to refine coarse equiaxed grains. The correlation between cooling rate and PDAS enables pre-design of gigacasting component mechanical properties, e.g., targeting a PDAS of ~10-15 μm balances yield strength (> 180 MPa) and elongation (> 10%) for automotive crash-resistant parts.
Effects of orientation angle on columnar dendrites: mitigating gigacasting anisotropy
The orientation angle (ψ0 = 0-π/6) induces asymmetric growth of lateral branches. At ψ0 = π/6 (maximum deviation), a double-primary dendrite structure forms, leading to a remarkable increase in PDAS compared to ψ0 = 0. For the planar-to-cellular interface transition, the simulated critical G/Vn ratio (1.2 × 10⁹ K·s/m2) is an order of magnitude lower than the equilibrium theoretical value (1.48 × 10¹⁰ K·s/m2), attributed to the solute drag-induced reduction in undercooling under quasi-rapid solidification.
Implication: The columnar dendrite anisotropy (common in thick gigacast parts) causes direction-dependent mechanical properties. By adjusting the temperature gradient via mold preheating, the planar-to-cellular transition is delayed, reducing columnar dendrite formation and improving property isotropy. For parts requiring high fatigue resistance (e.g., chassis components), align the preferred dendrite orientation with the main stress direction via controlled heat flow in the mold, avoiding stress concentration at misoriented dendrite boundaries.
Partial solute drag condition and energy transfer: tailoring gigacasting defect control
As the solidification driving force increases, the free energy consumption shifts from trans-interface diffusion (ΔGD) to interface migration (ΔGM). Under full solute drag, ΔGD accounts for a high proportion of the total free energy (ΔGtotal), while under zero drag, ΔGD drops to 0, and ΔGM contributes 100% of ΔGtotal. Microstructurally, the partial drag condition results in the intermediate features: the PDAS is between full drag and zero drag, and the solid-phase Al concentration is higher than full drag but lower than zero drag.
Implication: The partial drag is the dominant state in transition zones of gigacast parts. By tuning cooling rate to maintain the partial drag, the solute segregation can be decreased (e.g., Al concentration difference between dendrite trunks and interdendrites), reducing the formation of brittle interdendritic phases (e.g., Mg17Al12). This directly lowers the risk of hot tearing (a major gigacasting defect) and improves impact toughness.
Experimental validation of simulation results: scaling to gigacasting production
The experiments under three cooling rates (0.07, 2.9, 181 K/s) confirm the simulation trends. Under water cooling (181 K/s), the Al concentration difference between dendrite trunks and interdendritic regions is significantly lower than that under furnace cooling (0.07 K/s), indicating significantly suppressed segregation. The PDAS relative errors are less than 9%, validating the model reliability. Additionally, the simulations of die-casting cooling rates match the microstructures of industrial die-cast AM60 alloy, where the surface zone shows fine dendrites which are consistent with the water-cooled simulation results.
Implication: The model enables predictive engineering of gigacast microstructures. For example, simulating the cooling rate of a gigacast Mg-6Al automotive subframe can guide how to form a surface zone tensile strength of ~220 MPa and central zone elongation of ~12%, aligning with industrial performance requirements.
This work establishes a quantitative link between non-equilibrium effects (mainly solute trapping and solute drag) and microstructure evolution, directly informing gigacasting process control (cooling rate, temperature gradient, and mold design) and mechanical property optimization. By translating simulation-experiment insights to industrial gigacasting, it enables the production of large, high-performance Mg-Al alloy structural components with uniform microstructures and tailored mechanical properties. Future research will integrate melt flow and thermal stress into the phase-field model to explore dendrite growth mechanisms under multi-physical field coupling, e.g., addressing gigacasting-specific challenges.
DECLARATIONS
Authors’ contributions
Conceptualization, investigation, data collection, writing - original draft: Zhang, A.
Data analysis, writing - original draft: Tang, Y.
Data analysis, data reduction, revision: Yang, M.; Jiang, T.
Reviewing and editing, revision: He, F.; Wang, J.; Dong, Z.
Supervision, funding acquisition: Jiang, B.
Availability of data and materials
Data can be available from the corresponding author upon reasonable request.
AI and AI-assisted tools statement
Not applicable.
Financial support and sponsorship
This work is financially supported by the National Key Research and Development Program of China (grant number 2021YFB3701000), National Natural Science Foundation of China (grant numbers 52471118 and 52275390), New Chongqing Youth Innovation Talent Project (grant number CSTB2025YITP-QCRCX0043), Xiaomi Young Talents Program/Xiaomi Foundation, the State Key Laboratory of Solidification Processing in NPU (grant number SKLSP202521), and Young Elite Scientists Sponsorship Program by CAST (grant number 2022QNRC001).
Conflicts of interest
All authors declared that there are no conflicts of interest.
Ethical approval and consent to participate
Not applicable.
Consent for publication
Not applicable.
Copyright
© The Author(s) 2026.
Supplementary Materials
REFERENCES
1. Zheng, Z.; Dong, Z.; Wang, C.; et al. Improved mechanical properties of highly alloyed Mg-10Gd-5Y-5Er-xZn alloys via tailoring LPSO phase structure. Trans. Mater. Res. 2025, 1, 100007.
2. Ramalingam, V. V.; Ramasamy, P.; Kovukkal, M. D.; Myilsamy, G. Research and development in magnesium alloys for industrial and biomedical applications: a review. Met. Mater. Int. 2019, 26, 409-30.
3. Chen, W.; Yang, J.; Yu, W.; et al. One developed finite element model used in nano-layered flaky Ti2AlC MAX ceramic particles reinforced magnesium composite. J. Magnes. Alloys. 2024, 12, 4219-28.
4. Jiang, B.; Dong, Z.; Zhang, A.; Song, J.; Pan, F. Recent advances in micro-alloyed wrought magnesium alloys: theory and design. Trans. Nonferrous. Met. Soc. China. 2022, 32, 1741-80.
5. Mo, N.; Tan, Q.; Bermingham, M.; et al. Current development of creep-resistant magnesium cast alloys: a review. Mater. Design. 2018, 155, 422-42.
6. Li, T.; Song, J.; Zhang, A.; et al. Progress and prospects in Mg-alloy super-sized high pressure die casting for automotive structural components. J. Magnes. Alloys. 2023, 11, 4166-80.
7. Weiler, J. P. Exploring the concept of castability in magnesium die-casting alloys. J. Magnes. Alloys. 2021, 9, 102-11.
8. Wu, M.; Xiong, S. Microstructure characteristics of the eutectics of die cast AM60B magnesium alloy. J. Mater. Sci. Technol. 2011, 27, 1150-6.
9. Teng, H.; Zhang, X.; Zhang, Z.; Li, T.; Cockcroft, S. Research on microstructures of sub-rapidly solidified AZ61 magnesium alloy. Mater. Charact. 2009, 60, 482-6.
10. You, G.; Ming, Y.; Yan, P.; et al. Effect of solidification rate on microstructure and mechanical properties of die casting AZ91-1.5Si-0.4Ca magnesium alloy. Rare. Met. Mater. Eng. 2018, 47, 2392-2403. https://caod.oriprobe.com/articles/54985703/Effect_of_Solidification_Rate_on_Microstructure_an.htm. (accessed 9 Apr 2026).
11. Sharifi, P.; Fan, Y.; Anaraki, H. B.; Banerjee, A.; Sadayappan, K.; Wood, J. T. Evaluation of cooling rate effects on the mechanical properties of die cast magnesium alloy AM60. Metall. Mater. Trans. A. 2016, 47, 5159-68.
12. Zhang, W.; Xie, H.; Ma, Z.; Zhao, H.; Ren, L. Graphene oxide-induced substantial strengthening of high-entropy alloy revealed by micropillar compression and molecular dynamics simulation. Research 2022, 2022, 9839403.
13. Qiu, Y.; Li, Y.; Feng, X.; Zhang, A.; Yang, Y. Numerical simulation of microstructure evolution in molten pool of nickel-based superalloy during selective laser melting. Trans. Nonferrous. Met. Soc. China. 2024, 34, 560-75.
15. Wu, M.; Tian, B.; Zhang, A.; Guo, Z.; Xiong, S. Phase-field lattice-Boltzmann study on dendritic growth of hcp metals under gravity-driven natural convection. Trans. Nonferrous. Met. Soc. China. 2023, 33, 1629-43.
16. Gao, X.; Wang, W. Y.; Chen, X.; et al. ProME: an integrated computational platform for material properties at extremes and its application in multicomponent alloy design. Mater. Genome. Eng. Adv. 2025, 3, e70029.
17. Ji, K.; Dorari, E.; Clarke, A. J.; Karma, A. Microstructural pattern formation during far-from-equilibrium alloy solidification. Phys. Rev. Lett. 2023, 130, 026203.
18. Kavousi, S.; Asle Zaeem, M. Quantitative phase-field modeling of solute trapping in rapid solidification. Acta. Mater. 2021, 205, 116562.
19. Pinomaa, T.; Provatas, N. Quantitative phase field modeling of solute trapping and continuous growth kinetics in quasi-rapid solidification. Acta. Mater. 2019, 168, 167-77.
20. Zhang, A.; Du, J.; Yang, J.; et al. General hierarchical structure to solve transport phenomena with dissimilar time scales: application in large-scale three-dimensional thermosolutal phase-field problems. Phys. Rev. E. 2020, 102, 043313.
21. Zhang, A.; Du, J.; Guo, Z.; Wang, Q.; Xiong, S. Conservative phase-field method with a parallel and adaptive-mesh-refinement technique for interface tracking. Phys. Rev. E. 2019, 100, 023305.
22. Aziz, M. J.; Kaplan, T. Continuous growth model for interface motion during alloy solidification. Acta. Metall. 1988, 36, 2335-47.
23. Carré, A.; Böttger, B.; Apel, M. Implementation of an antitrapping current for a multicomponent multiphase-field ansatz. J. Cryst. Growth. 2013, 380, 5-13.
24. Kim, S. G. A phase-field model with antitrapping current for multicomponent alloys with arbitrary thermodynamic properties. Acta. Mater. 2007, 55, 4391-9.
25. Ramirez, J. C.; Beckermann, C.; Karma, A.; Diepers, H. J. Phase-field modeling of binary alloy solidification with coupled heat and solute diffusion. Phys. Rev. E. Stat. Nonlin. Soft. Matter. Phys. 2004, 69, 051607.
26. Wang, Z.; Li, J.; Wang, J.; Zhou, Y. Phase field modeling the selection mechanism of primary dendritic spacing in directional solidification. Acta. Mater. 2012, 60, 1957-64.
27. Amoorezaei, M.; Gurevich, S.; Provatas, N. Spacing characterization in Al–Cu alloys directionally solidified under transient growth conditions. Acta. Mater. 2010, 58, 6115-24.
28. Chen, M.; Hu, X. D.; Ju, D. Y.; Zhao, H. Y. The microstructure prediction of magnesium alloy crystal growth in directional solidification. Comput. Mater. Sci. 2013, 79, 684-90.
Cite This Article
How to Cite
Download Citation
Export Citation File:
Type of Import
Tips on Downloading Citation
Citation Manager File Format
Type of Import
Direct Import: When the Direct Import option is selected (the default state), a dialogue box will give you the option to Save or Open the downloaded citation data. Choosing Open will either launch your citation manager or give you a choice of applications with which to use the metadata. The Save option saves the file locally for later use.
Indirect Import: When the Indirect Import option is selected, the metadata is displayed and may be copied and pasted as needed.
About This Article
Special Topic
Copyright

Data & Comments
Data
0


Comments
Comments must be written in English. Spam, offensive content, impersonation, and private information will not be permitted. If any comment is reported and identified as inappropriate content by OAE staff, the comment will be removed without notice. If you have any queries or need any help, please contact us at [email protected].