


fig10
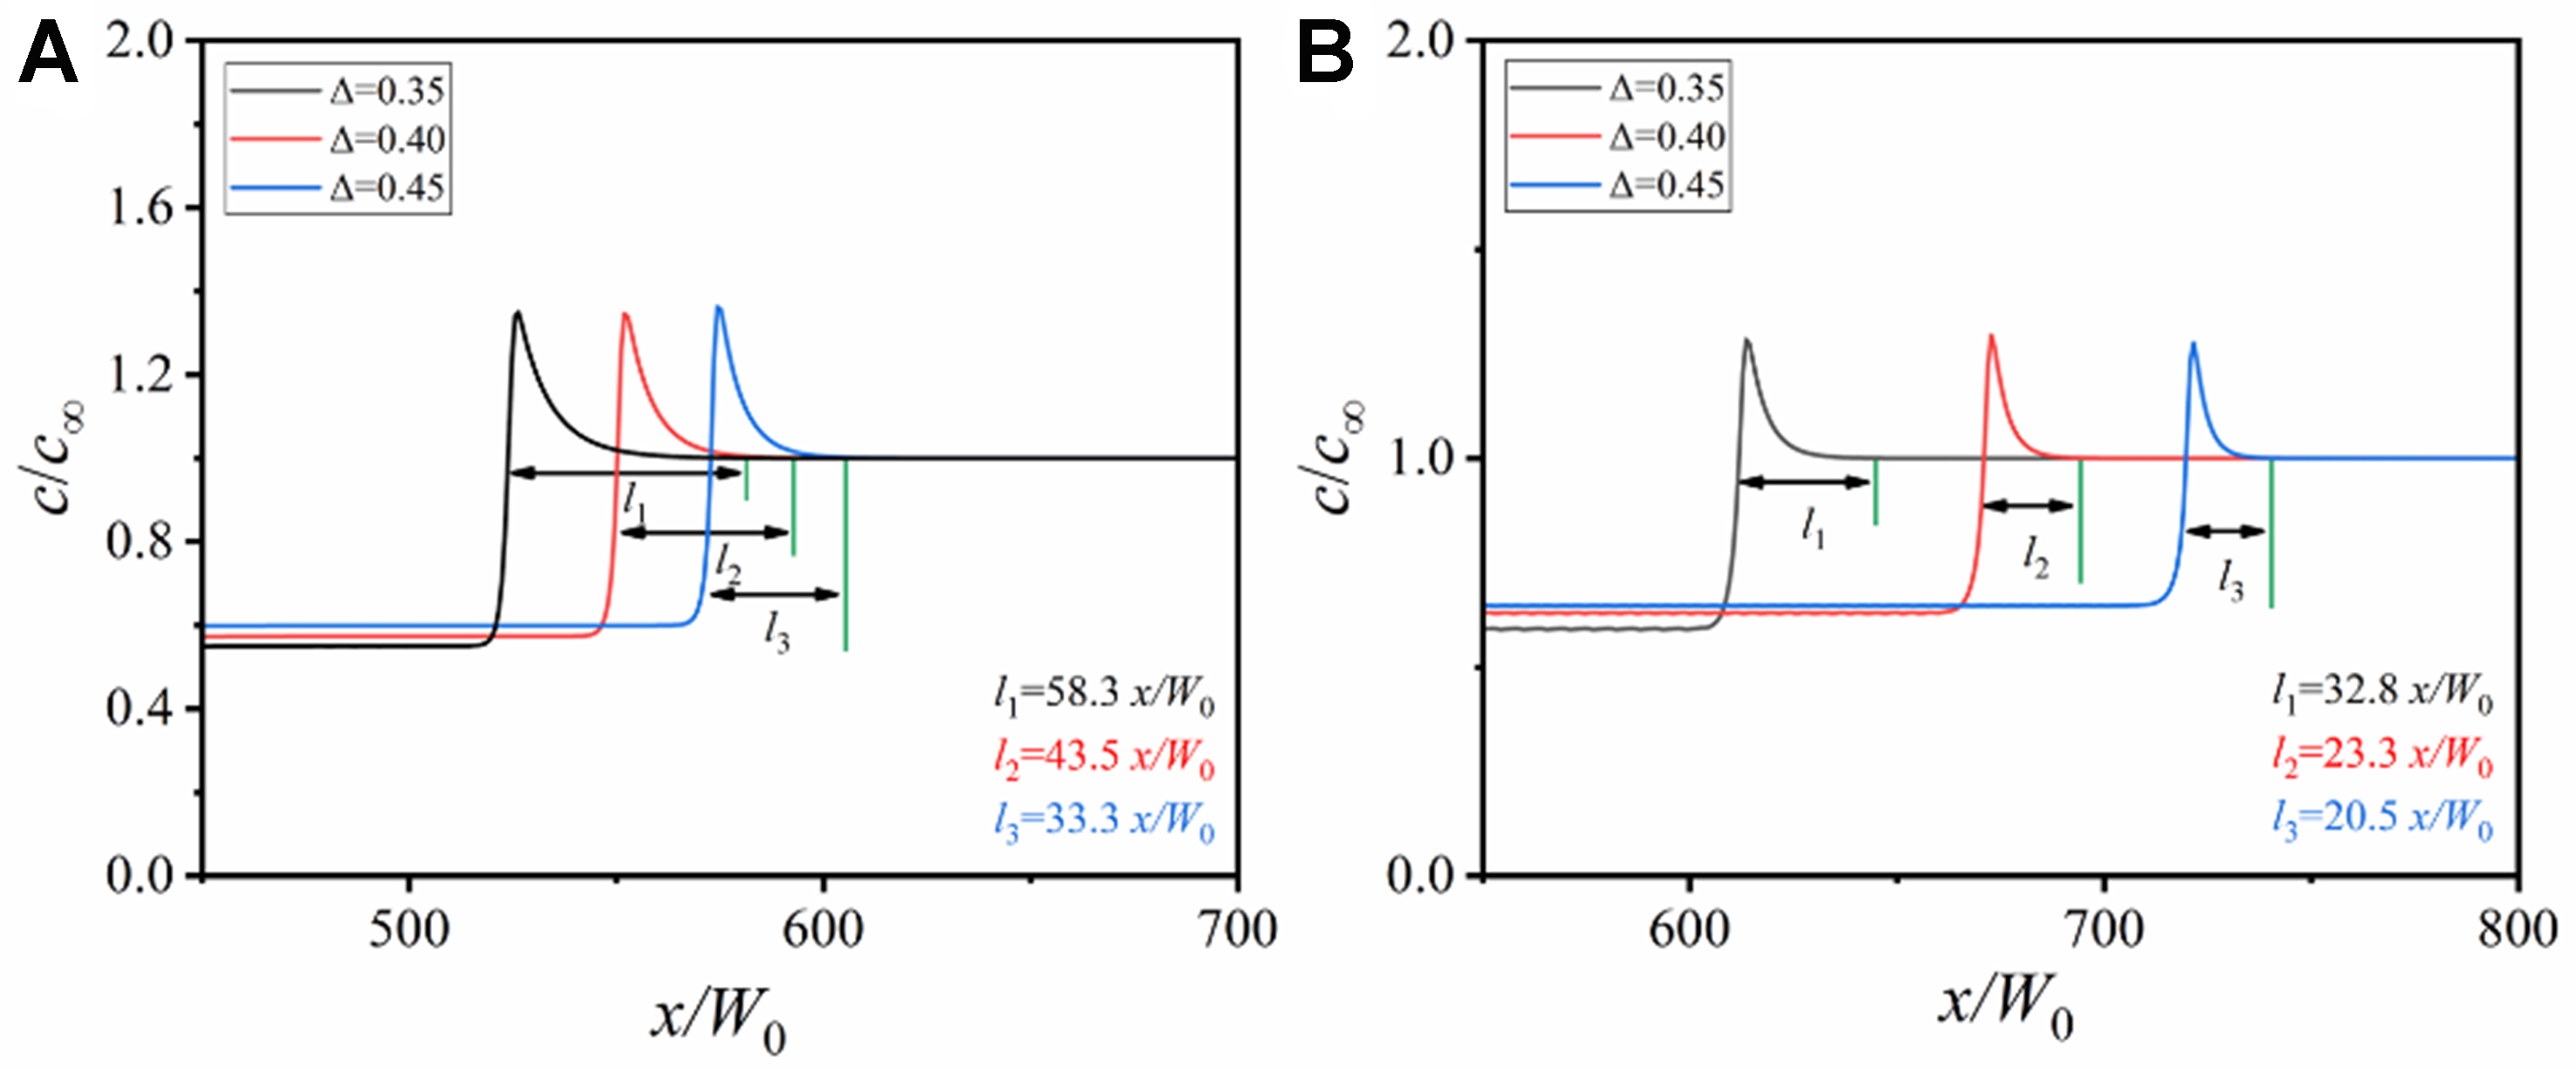
Figure 10. Change of solute concentration along the domain horizontal centerlines in Figure 9 under different undercoolings: (A) solute trapping with solute drag; (B) solute trapping without solute drag.
Figure 10. Change of solute concentration along the domain horizontal centerlines in Figure 9 under different undercoolings: (A) solute trapping with solute drag; (B) solute trapping without solute drag.


All published articles are preserved here permanently:
https://www.portico.org/publishers/oae/


