


Machine learning-enhanced behavioral profiling improves phenotypic screening in a genetic mouse model of autism spectrum disorder
 0
0 
Abstract
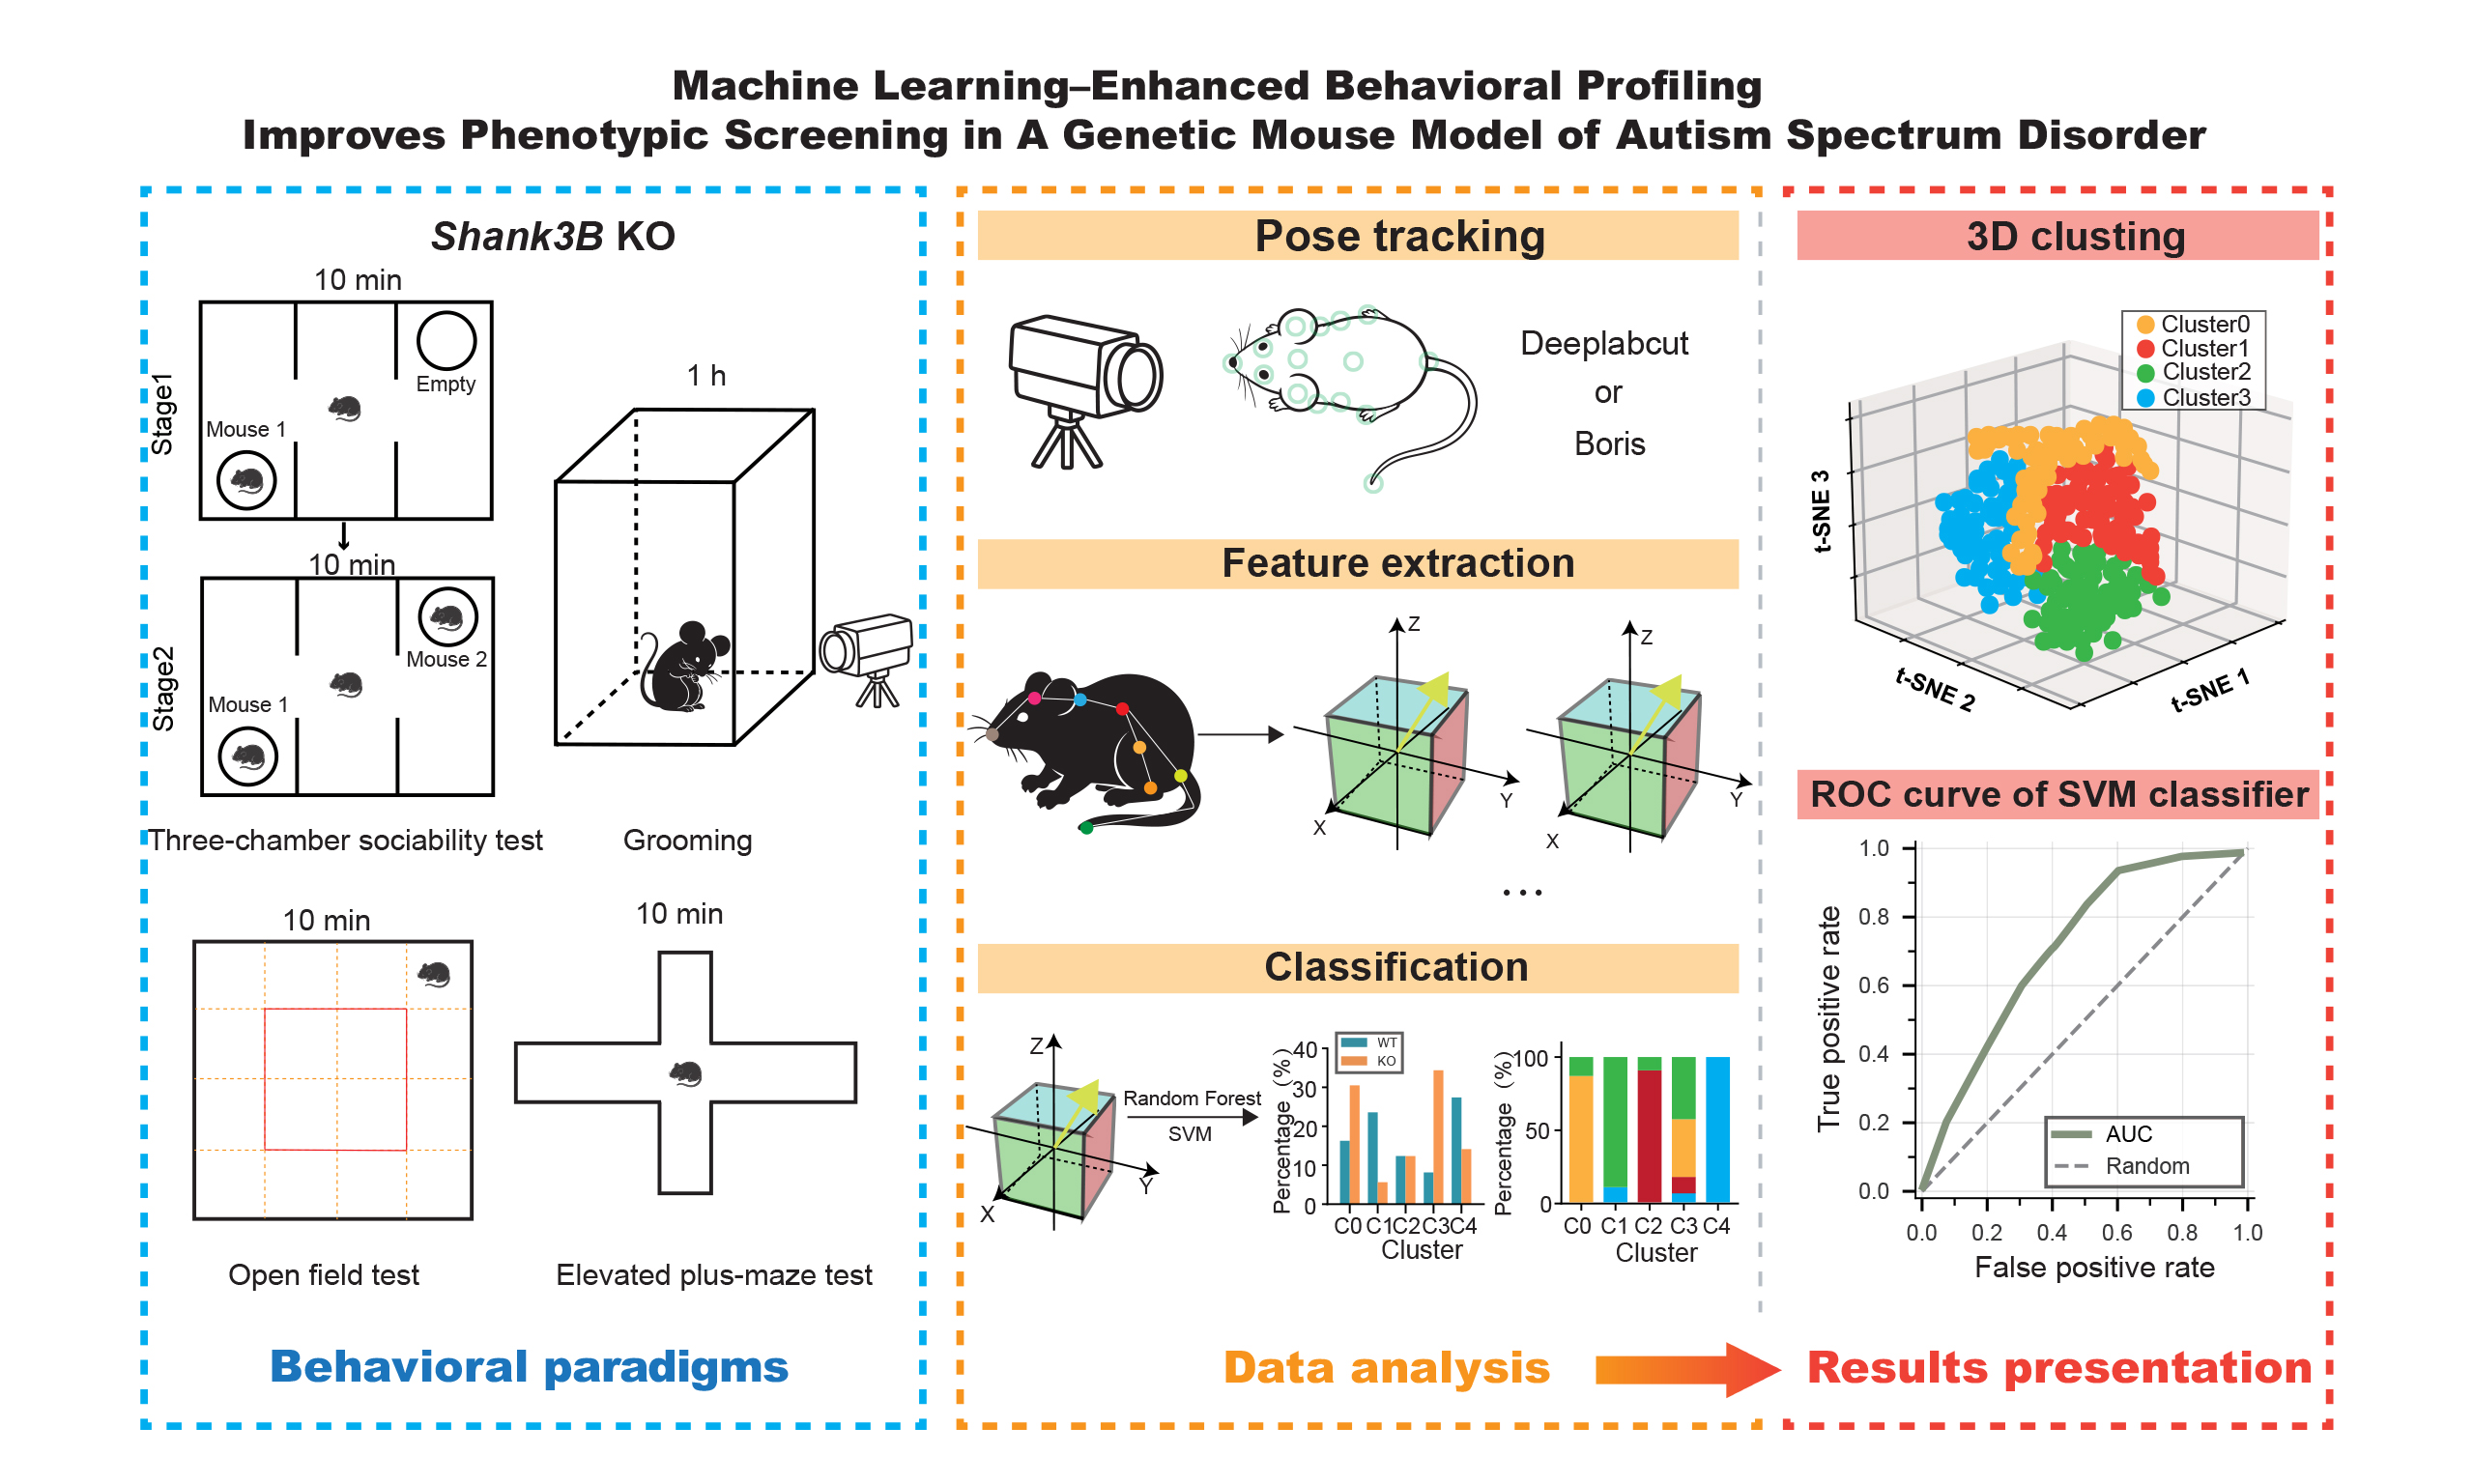
Aim: Genetic factors are major contributors to neurodevelopmental disorders such as autism spectrum disorder. Genetically modified animal models are widely used, yet behavioral phenotyping often relies on coarse metrics that may overlook subtle but meaningful abnormalities. Here, using Shank3B knockout (KO) mice as an example, we developed a machine learning-based behavioral analysis pipeline to enhance sensitivity and precision in genotype-related behavioral screening.
Methods: Adult male knockout and wild-type littermates were tested in standard behavioral paradigms, including the three-chamber social test, grooming assay, open field, and elevated plus maze. Videos were processed using markerless pose estimation to extract high-resolution behavioral features. Multidimensional features were analyzed with dimensionality reduction and unsupervised clustering, and genotype discrimination was evaluated using supervised classifiers.
Results: Shank3B KO mice showed reduced sociability and social novelty preference, increased repetitive grooming, reduced exploration, and elevated anxiety-like behavior. Fine-grained behavioral features revealed altered behavioral structure and transition patterns across tasks. Unsupervised clustering consistently separated genotypes into distinct behavioral states, and machine learning classifiers accurately predicted genotype based on behavioral features.
Conclusion: This study demonstrates that fine-scale, machine learning-assisted analysis applied to conventional behavioral tests facilitates the detection of genotype-specific phenotypes. The proposed pipeline provides a scalable framework for more precise behavioral screening of genetically modified models and supports translational studies of neurodevelopmental disorders.
Keywords
INTRODUCTION
Genetic defects are major etiological contributors to many neurological and psychiatric disorders[1-5]. Their heterogeneous clinical manifestations form the basis for diagnosis, subtype classification, and targeted therapeutic strategies. To elucidate the molecular and circuit mechanisms linking genetic variation to pathological phenotypes, genetically modified mouse models carrying disease-related mutations have become essential preclinical platforms[6,7].
SHANK3 encodes a core postsynaptic density scaffold protein that regulates synapse formation and glutamate receptor trafficking. Mutations in human SHANK3 are well-established high-risk factors for autism spectrum disorder (ASD)[7,8], and are strongly associated with core symptoms[9], including social deficits[10], abnormal tactile processing[11-14], and repetitive behaviors[15]. Accordingly, Shank3 mutant mice are widely used for target discovery, drug validation, and intervention development for ASD. However, precise characterization of disease-relevant phenotypes, particularly subtle and context-dependent behavioral abnormalities, remains challenging, which limits the translational utility of these genetic models.
Accurate behavioral quantification is critical not only for validating disease models but also for linking neural activity to behavioral outputs[16,17]. Video recording combined with classical behavioral paradigms provides a practical and widely adopted framework for animal behavior assessment. Conventional video-based analysis methods mainly focus on locomotor trajectories and region-based measurements, yielding summary metrics such as time spent in predefined zones. While these measures are robust and well validated, they offer limited resolution for distinguishing fine-grained behavioral structure and subtype-specific behavioral patterns[16]. For example, grooming analysis is often limited to total duration and frequency[17], without capturing fine motor dynamics such as limb coordination and action sequences that may reflect pathological severity. Such low-resolution metrics reduce sensitivity to subtle behavioral alterations and constrain mechanistic interpretation as well as therapeutic evaluation in genetic disease models.
Recent advances in machine learning have provided powerful solutions to these limitations. DeepLabCut[18], a markerless pose estimation tool based on deep neural networks, stands out for its exceptional performance, which enables high-precision tracking with minimal manual annotation through transfer learning[19,20]. Complementing DeepLabCut, Keypoint-MoSeq[21] can automatically discover latent behavioral states and their dynamic changes, providing a more objective and comprehensive characterization of behavioral repertoires[22]. Additional tools further expand analytical resolution. B-SOiD[23] applies unsupervised learning to achieve millisecond-scale behavioral segmentation and quantify limb kinematics that are difficult to capture with traditional approaches[24]. A-SOiD[25] incorporates active learning to markedly reduce labeling requirements while improving performance in social behavior classification. Together, these approaches integrate high-resolution pose tracking with dynamic behavioral parsing, enabling fine-grained phenotyping in genetic disease models. Despite these methodological advances, most studies apply machine learning-based behavioral tools in isolation or restrict analysis to single behavioral paradigms. Systematic validation across multiple classical behavioral tests and genetically modified mouse models remains limited.
To address these challenges, we established a fine-grained behavioral analysis framework built upon widely used classical behavioral paradigms and enhanced by machine learning-based pose tracking and behavioral state parsing. We applied this framework to a Shank3B knockout (KO) mouse model, a well-characterized model of ASD, and systematically analyzed behavior across grooming, elevated plus maze, open field, and three-chamber sociability tests. This strategy enables more sensitive and structured detection of genotype-associated behavioral patterns, improves phenotypic screening depth in genetic models, and provides a scalable analytical route for translational behavioral research.
METHODS
Animals
Shank3B KO mice (stock No. 017688, The Jackson Laboratory) were used in this study and maintained as heterozygous breeders. Wild-type (WT) mice were littermate controls derived from the same breeding pairs. A total of 20 adult male mice were used in this study (Shank3B KO: n = 8; WT littermates: n = 12), aged 8-12 weeks and weighing 22-28 g at the time of testing. Mice were housed under controlled conditions on a 12 h light/12 h dark cycle (lights on from 08:00 to 20:00) at a constant room temperature of 22-24 °C, with ad libitum access to food and water. All procedures were approved by the Institutional Animal Care and Use Committee (IACUC) of the Fourth Military Medical University (Approval No.251529) and followed the ARRIVE 2.0 guidelines, in accordance with the National Institutes of Health (NIH) Guide for the Care and Use of Laboratory Animals.
Three-chamber sociability test
The three-chamber test was performed following the procedures reported previously[26]. Mice from both groups were habituated to the testing room for 2 h before behavioral assessment. The three-chamber apparatus consisted of a central chamber (40 cm × 20 cm) and two side chambers (40 cm × 20 cm each), with a wire cage positioned in each side chamber for stimulus mice. At the start of the test, the subject mouse was placed in the central chamber and allowed to freely explore all chambers for 5 min for habituation. In the sociability phase (Stage 1), an unfamiliar male mouse with no prior contact with the subject was placed inside one wire cage in a side chamber, while the opposite cage remained empty. The partitions were opened, and the subject mouse was allowed to explore freely for 10 min. In the social novelty phase (Stage 2), a second unfamiliar male mouse was placed in the previously empty cage, and the subject mouse was again allowed to explore for 10 min. Behavior was recorded throughout each stage. The apparatus was cleaned with 75% ethanol between trials to eliminate olfactory cues.
Grooming
Grooming test was performed following the procedures reported previously[27]. Mice from both groups were habituated to the testing room for 2 h prior to the experiment. Each mouse was then transferred individually from its home cage to a testing chamber (30 cm × 20 cm × 20 cm), where behavior was continuously recorded for 30 min. After each trial, the chamber was cleaned with 75% ethanol to remove residual odor cues before testing the next animal.
Open field test
Open field test was performed following the procedures reported previously[28]. Mice from both groups were habituated to the testing room for 2 h before the experiment. Each mouse was then transferred individually from its home cage to the center of a cubic open-field arena (50 cm × 50 cm × 50 cm). Spontaneous locomotor and exploratory (Active, variable movements for environmental investigation) behavior was recorded for 10 min. The arena was cleaned with 75% ethanol between trials to eliminate olfactory cues.
Elevated plus-maze test
Elevated plus-maze test was performed following the procedures reported previously[29]. Mice were habituated to the testing room for 2 h prior to testing. The elevated plus maze was constructed of black Plexiglas and consisted of two open arms (50 cm × 10 cm), two enclosed arms of the same size with black acrylic walls, and a central platform (10 cm × 10 cm). At the start of each trial, the mouse was placed on the central platform facing an open arm and allowed to explore freely for 10 min while behavior was recorded. The maze was cleaned with 75% ethanol between trials.
Behavioral feature extraction and statistical analysis
Behavioral data from the three-chamber, grooming, open field, and elevated plus maze tests were processed using a unified computational pipeline. Discrete behavioral events were grouped into higher-level behavioral states, and per-animal metrics, including event counts, total duration, and time allocation proportions, were calculated. Genotype differences were evaluated using two-tailed Student’s t-tests or Mann-Whitney U tests as appropriate. Results are presented as mean ± SEM or SD with individual data points shown.
Behavioral transition probability matrices were constructed for each genotype to characterize state-switching dynamics. Differences in transition probabilities were assessed using Fisher’s exact tests or chi-square tests of independence. Multiple comparisons were corrected using the Benjamini-Hochberg false discovery rate (FDR) procedure where applicable. Transition structures were visualized using probability heatmaps. The calculation methods of the trajectory entropy, exploration index and anxiety index are provided in Supplementary Figure 1.
Computational behavioral clustering and genotype classification
To identify latent behavioral structure, each behavioral event was encoded as a multidimensional feature vector incorporating behavioral state identity, temporal context, duration measures, and kinematic or spatial features. Features were standardized using robust scaling prior to analysis. T-SNE was applied for dimensionality reduction and visualization of behavioral clusters. T-SNE was performed with a perplexity of 30 and a fixed random state for reproducibility. This was followed by k-means clustering in the embedded space to define behavioral clusters. Cluster distributions were visualized in low-dimensional projections and summarized by behavioral composition. Genotype differences in cluster usage were evaluated using Mann-Whitney U tests, and enrichment ratios were calculated to adjust for unequal event counts.
To assess the discriminative power of extracted behavioral features, genotype classification was performed using a support vector machine (SVM) classifier. A linear kernel was used with the default regularization parameter C = 1.0. No hyperparameter tuning was performed beyond the default setting to avoid overfitting given the limited sample size. Model performance was evaluated using leave-one-animal-out (LOAO) cross-validation, repeated 10 times with random sample shuffling (random seed = 42). Performance metrics (accuracy and area under the ROC curve, AUC) are reported as mean ± SD.
Statistical analysis
For conventional behavioral metrics (e.g., time in zones, distance traveled, entries, speed), normality was first assessed using the Shapiro-Wilk test. For data meeting normality (P > 0.05) and homogeneity of variance, two-tailed Student's t-test was applied; otherwise, the Mann-Whitney U test was used. These predefined primary outcome measures were considered significant at P < 0.05 without multiple comparison correction.
For behavioral subtype proportions (e.g., grooming subcategories, time allocation across behavioral states), transition probability matrices (analyzed using Fisher's exact test), cluster composition (enrichment of WT/KO events across unsupervised clusters), and genotype distribution across clusters, the Benjamini-Hochberg false discovery rate (FDR) procedure was applied for multiple comparison correction. Adjusted q-values are reported, and significance was defined as q < 0.05.
Classifier performance was evaluated using a linear support vector machine (SVM, kernel = “linear”, C = 1.0) with leave-one-animal-out (LOAO) cross-validation, repeated 10 times with random sample shuffling. A fixed random seed (42) was set for the SVM classifier to ensure reproducibility. Performance metrics (accuracy and area under the ROC curve, AUC) are reported as mean ± SD. The 95% confidence interval for AUC was estimated via bootstrap (1,000 resamples). No hyperparameter tuning was performed beyond the default setting to avoid overfitting given the limited sample size. No additional multiple comparison correction was applied, as each behavioral assay involved an independent classification task and cross-validation inherently accounts for generalization error.
To maintain visual clarity in the main figures, significance is indicated by asterisks (*). Exact p-values and FDR-adjusted q values for all key comparisons are provided in Supplementary Table 1.
All statistical analyses were performed using Python (v3.9) with scikit-learn (v1.2.0) for machine learning analyses, and GraphPad Prism (v9.0) for conventional statistical tests.
Cluster annotation and biological validation
To biologically interpret the latent behavioral clusters identified by unsupervised clustering, we performed a systematic ground-truthing procedure as follows.
First, for each cluster identified by k-means, we extracted the centroid event—the behavioral sample whose feature vector had the smallest Euclidean distance to the cluster center. Additionally, we selected the 10 events closest to the centroid to capture the core behavioral characteristics of the cluster.
Second, a trained observer, blinded to both genotype and cluster assignment, reviewed the video segments corresponding to these centroid and near-centroid events. Each segment was examined at normal speed and, when necessary, frame-by-frame. The predominant behavioral motif was recorded for each event.
Third, the manual annotations derived from video inspection were cross-validated against the quantitative distribution of predefined behavioral categories within each cluster. For example, a cluster was annotated as "leg-focused grooming" only if the video inspection consistently identified leg-licking and the majority of events in that cluster belonged to the predefined "leg lick" category.
Fourth, for clusters that shared similar behavioral labels, we further characterized their temporal and sequential properties, including duration, self-transition probability, and behavioral context (preceding and following states), to distinguish between functionally distinct but superficially similar clusters.
This procedure ensured that each latent cluster received a biologically meaningful and empirically validated annotation.
RESULT
Shank3B KO mice show impaired sociability and social novelty recognition
To evaluate whether fine-grained behavioral analysis applied to classical paradigms can sensitively capture genotype-related social phenotypes, we first examined social behavior in Shank3B KO and WT littermates using the three-chamber assay [Figure 1A]. Using conventional region-based behavioral metrics, we observed genotype differences consistent with previously reported social deficits in this model[9]. Representative trajectory heatmaps further illustrated distinct spatial exploration patterns between genotypes [Figure 1B]. During the sociability phase, WT mice showed a clear preference for the chamber containing an unfamiliar mouse, whereas KO mice showed no significant preference, indicating reduced sociability
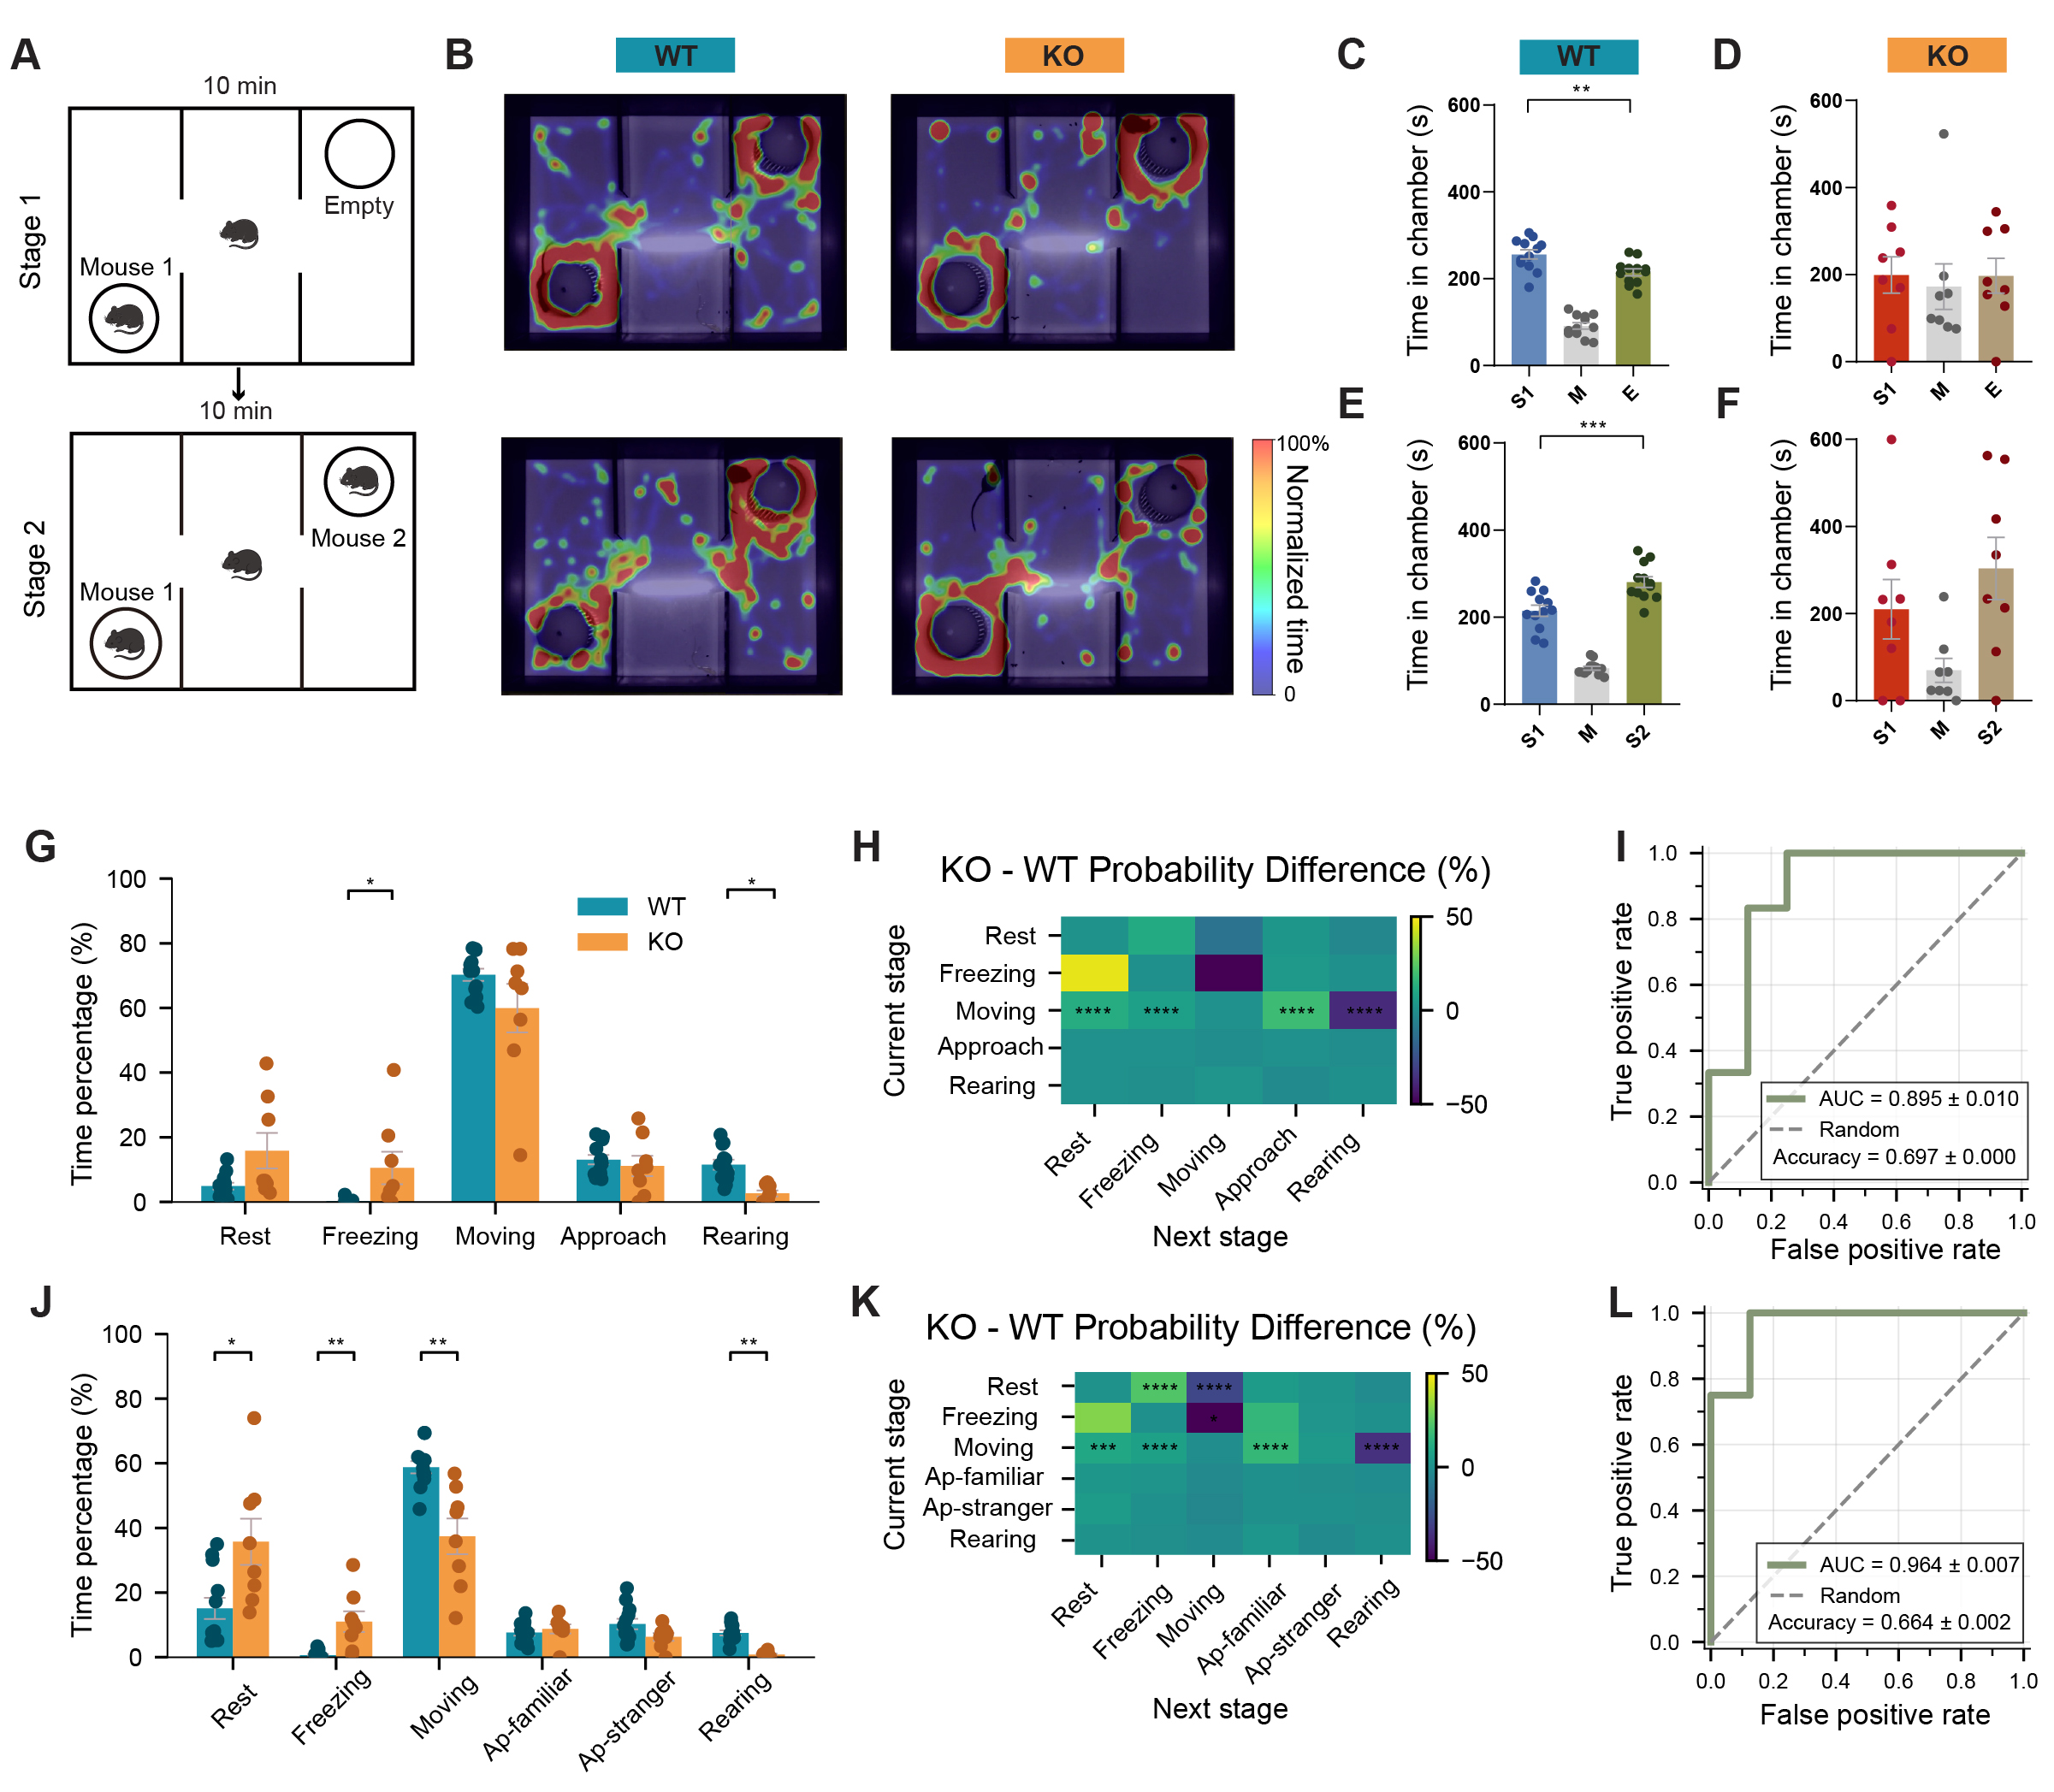
Figure 1. Impaired sociability and social novelty recognition in Shank3B KO mice revealed by machine learning-enhanced behavioral analysis. (A) Schematic diagram of the three-chamber test procedure. (B) Heatmaps of movement trajectories of KO and WT mice in three-chamber sociability test. (C) Time spent in each chamber of WT mice during Stage 1. (D) Time spent in each chamber of KO mice during Stage 1. (E) Time spent in each chamber of WT mice during Stage 2. (F) Time spent in each chamber of KO mice during Stage 2. (G) Time allocation percentages across different behaviors in Stage 1. (H) Heatmap showing the transition probability difference during Stage 1. (I) ROC curve demonstrating the classification performance of a behavioral feature-based classifier in discriminating between WT and KO mice in Stage 1. (accuracy = 0.664 ± 0.002, AUC = 0.964 ± 0.007). (J) Time allocation percentages across different behaviors in Stage 2. (K) Heatmap showing the transition probability difference during Stage 2. (L) ROC curve demonstrating the classification performance of a behavioral feature-based classifier in discriminating between WT and KO mice in Stage 2. (accuracy = 0.664 ± 0.002, AUC = 0.964 ± 0.007). n = 12 mice for WT and n = 8 mice for KO. Data presented as means ± SEM. *P < 0.05, **P < 0.01, ***P < 0.001, ****P < 0.0001. Comparisons between two groups were performed using two-tailed Student's t-test or Mann-Whitney U test as appropriate. For analyses involving multiple comparisons (behavioral subtype proportions and transition probabilities), p values are nominal; significance was determined using the Benjamini-Hochberg FDR procedure with q < 0.05.
Fine-grained behavioral quantification further resolved genotype differences [Figure 1G-L]. KO mice allocated less time to active social behaviors and more time to rigid (Stereotyped, repetitive postures with little variability) or inactive (No voluntary movement, including resting or freezing) states. Transition probability analysis showed increased switching from movement to rest or freezing and reduced transitions toward exploratory states, indicating reduced exploratory drive and altered social state dynamics. It is worth noting that total movement distance was quantified to aid interpretation of social interaction measures, as reduced locomotion could potentially influence time spent in social vs. empty chambers.
Machine learning-based classification reliably separated genotypes based on behavioral features alone
Shank3B KO mice exhibit reduced social engagement structure and restricted behavioral diversity revealed by unsupervised clustering
To explore latent behavioral structure beyond predefined categories, we performed dimensionality reduction and unsupervised clustering on high-dimensional behavioral features. This analysis identified distinct behavioral state clusters [Figure 2A-J]. Stationary or low-engagement (Minimal interaction with environmental or social stimuli) states were overrepresented in KO mice across both testing stages, whereas WT mice were more broadly distributed across exploratory clusters
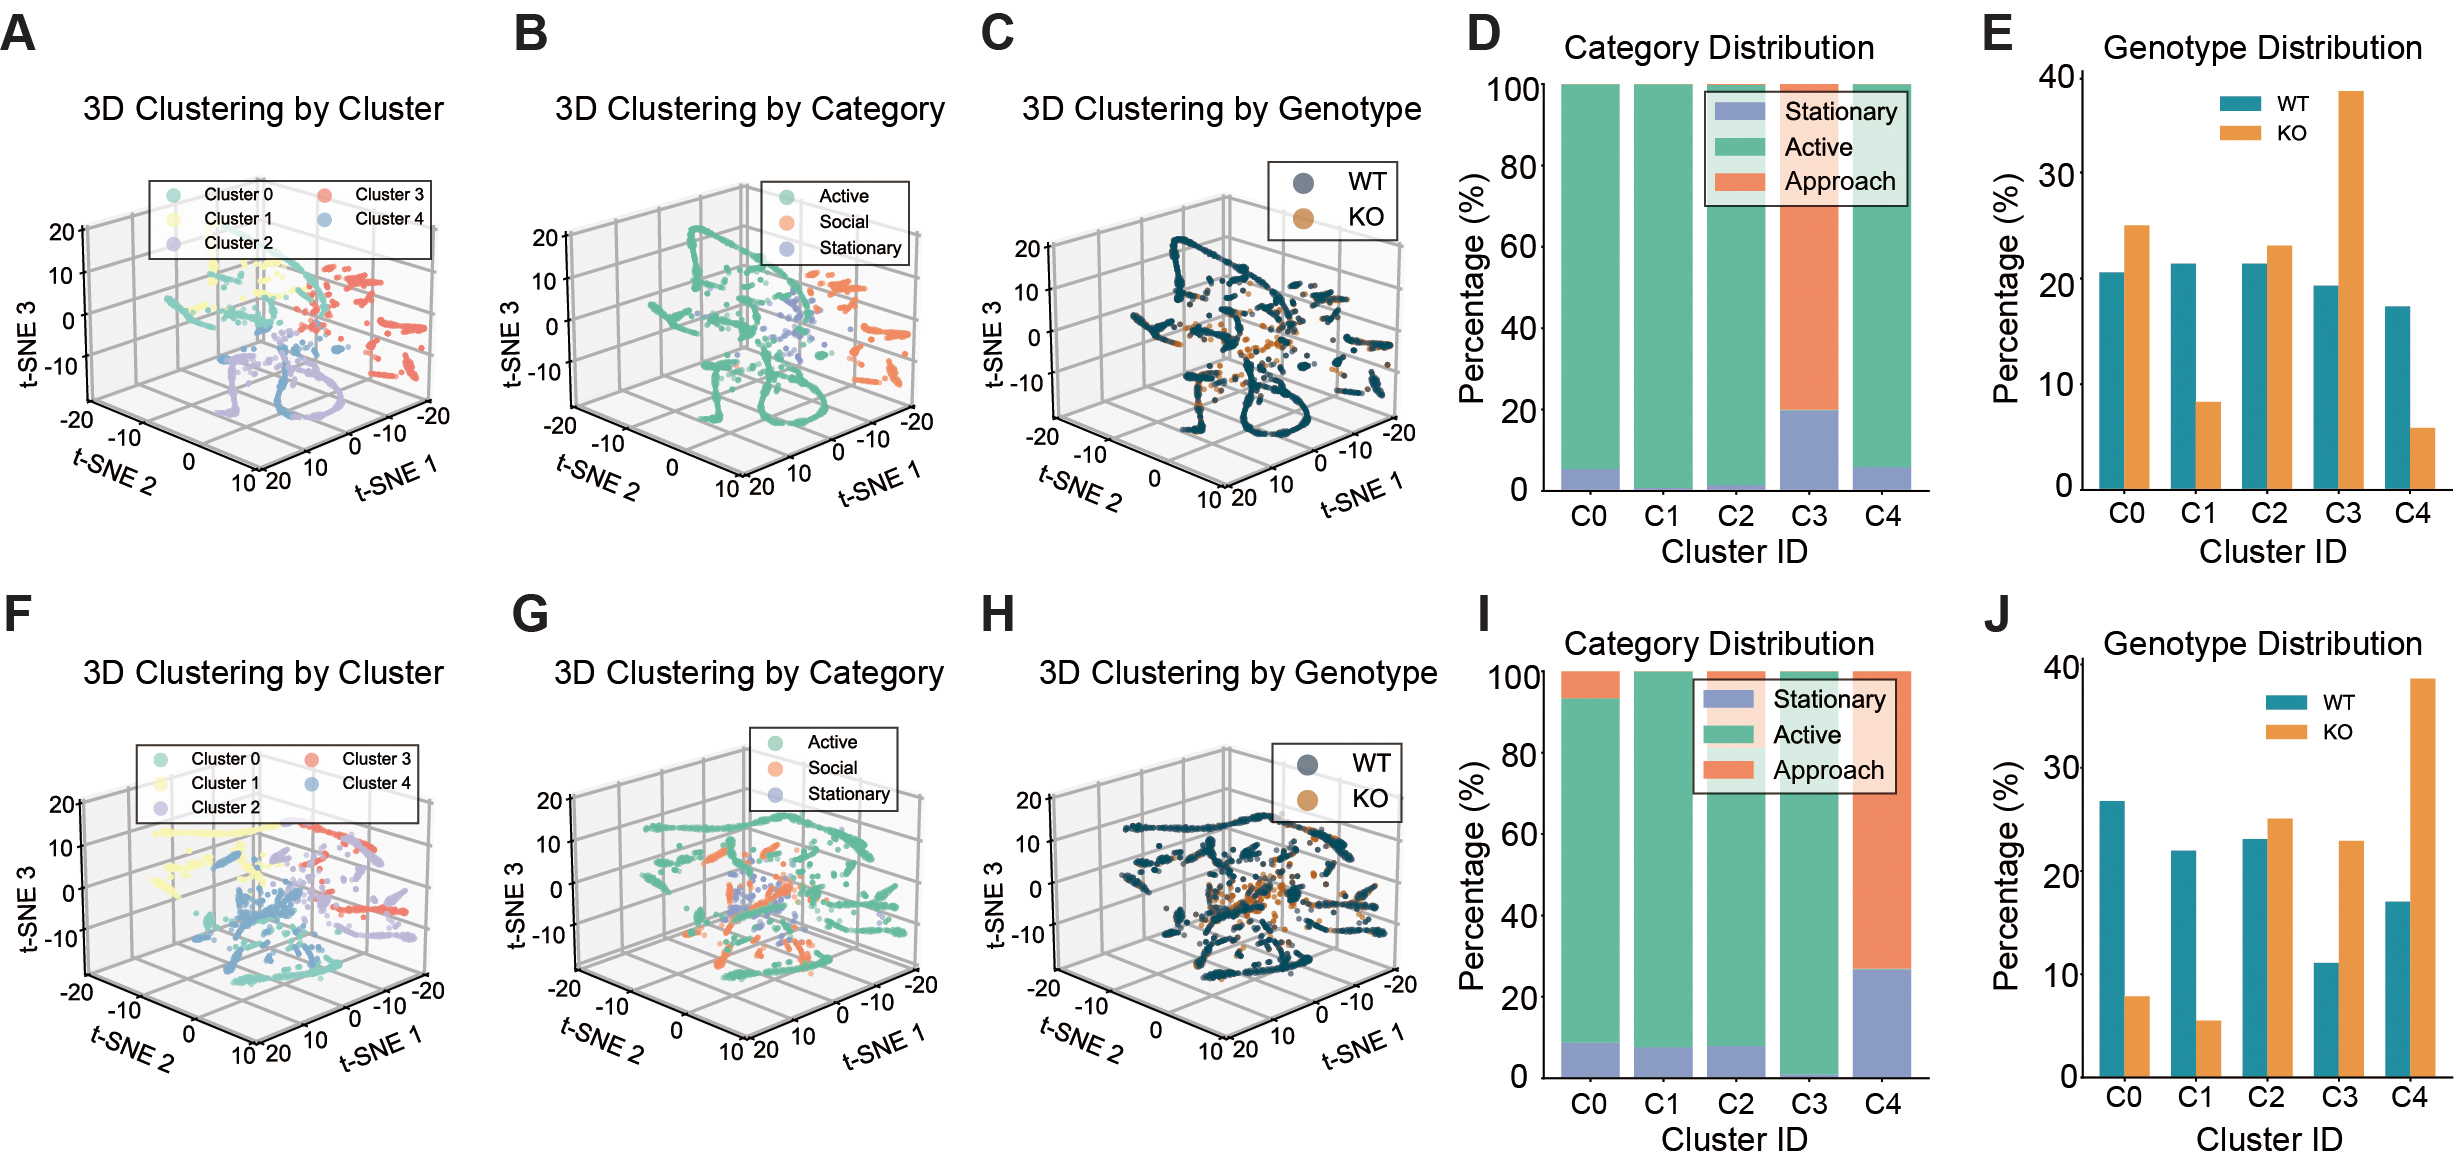
Figure 2. Latent behavioral clustering reveals genotype-specific social state organization in Shank3B KO mice. (A) 3D t-SNE clustering plot colored by cluster in Stage 1. (B) 3D t-SNE clustering plot colored by behaviors in Stage 1. (C) 3D t-SNE clustering plot colored by genotype in Stage 1. (D) Behavioral category distribution within clusters from Stage 1. (E) Genotype distribution across behavioral clusters from Stage 1. (F) 3D t-SNE clustering plot colored by cluster in Stage 2. (G) 3D t-SNE clustering plot colored by behaviors in stage 2. (H) 3D t-SNE clustering plot colored by genotype in stage 2. (I) Behavioral category distribution within clusters from stage 2. (J) Genotype distribution across behavioral clusters from stage 2. n = 12 mice for WT and n = 8 mice for KO. For analyses involving multiple comparisons (cluster composition and genotype distribution across clusters), p values are nominal; significance was determined using the Benjamini - Hochberg FDR procedure with q < 0.05.
Shank3B KO mice display increased grooming stereotypy and simplified behavioral structure
Consistent with prior reports of elevated repetitive behavior in Shank3B KO models[17], KO mice displayed significantly increased total grooming duration compared with WT mice [Figure 3A and B]. Subtype analysis further showed selective increases in leg licking and reductions in body grooming, while other grooming components were unchanged [Figure 3C], indicating an altered grooming pattern rather than a uniform increase across all subtypes. Behavioral transition analysis supported this shift in grooming structure. KO mice showed higher transition probabilities toward leg-licking sequences and fewer transitions into body-grooming states [Figure 3D], suggesting biased and less diverse grooming organization. Importantly, SVM classifiers based on grooming-derived behavioral features achieved high accuracy in discriminating genotypes [Figure 3E].
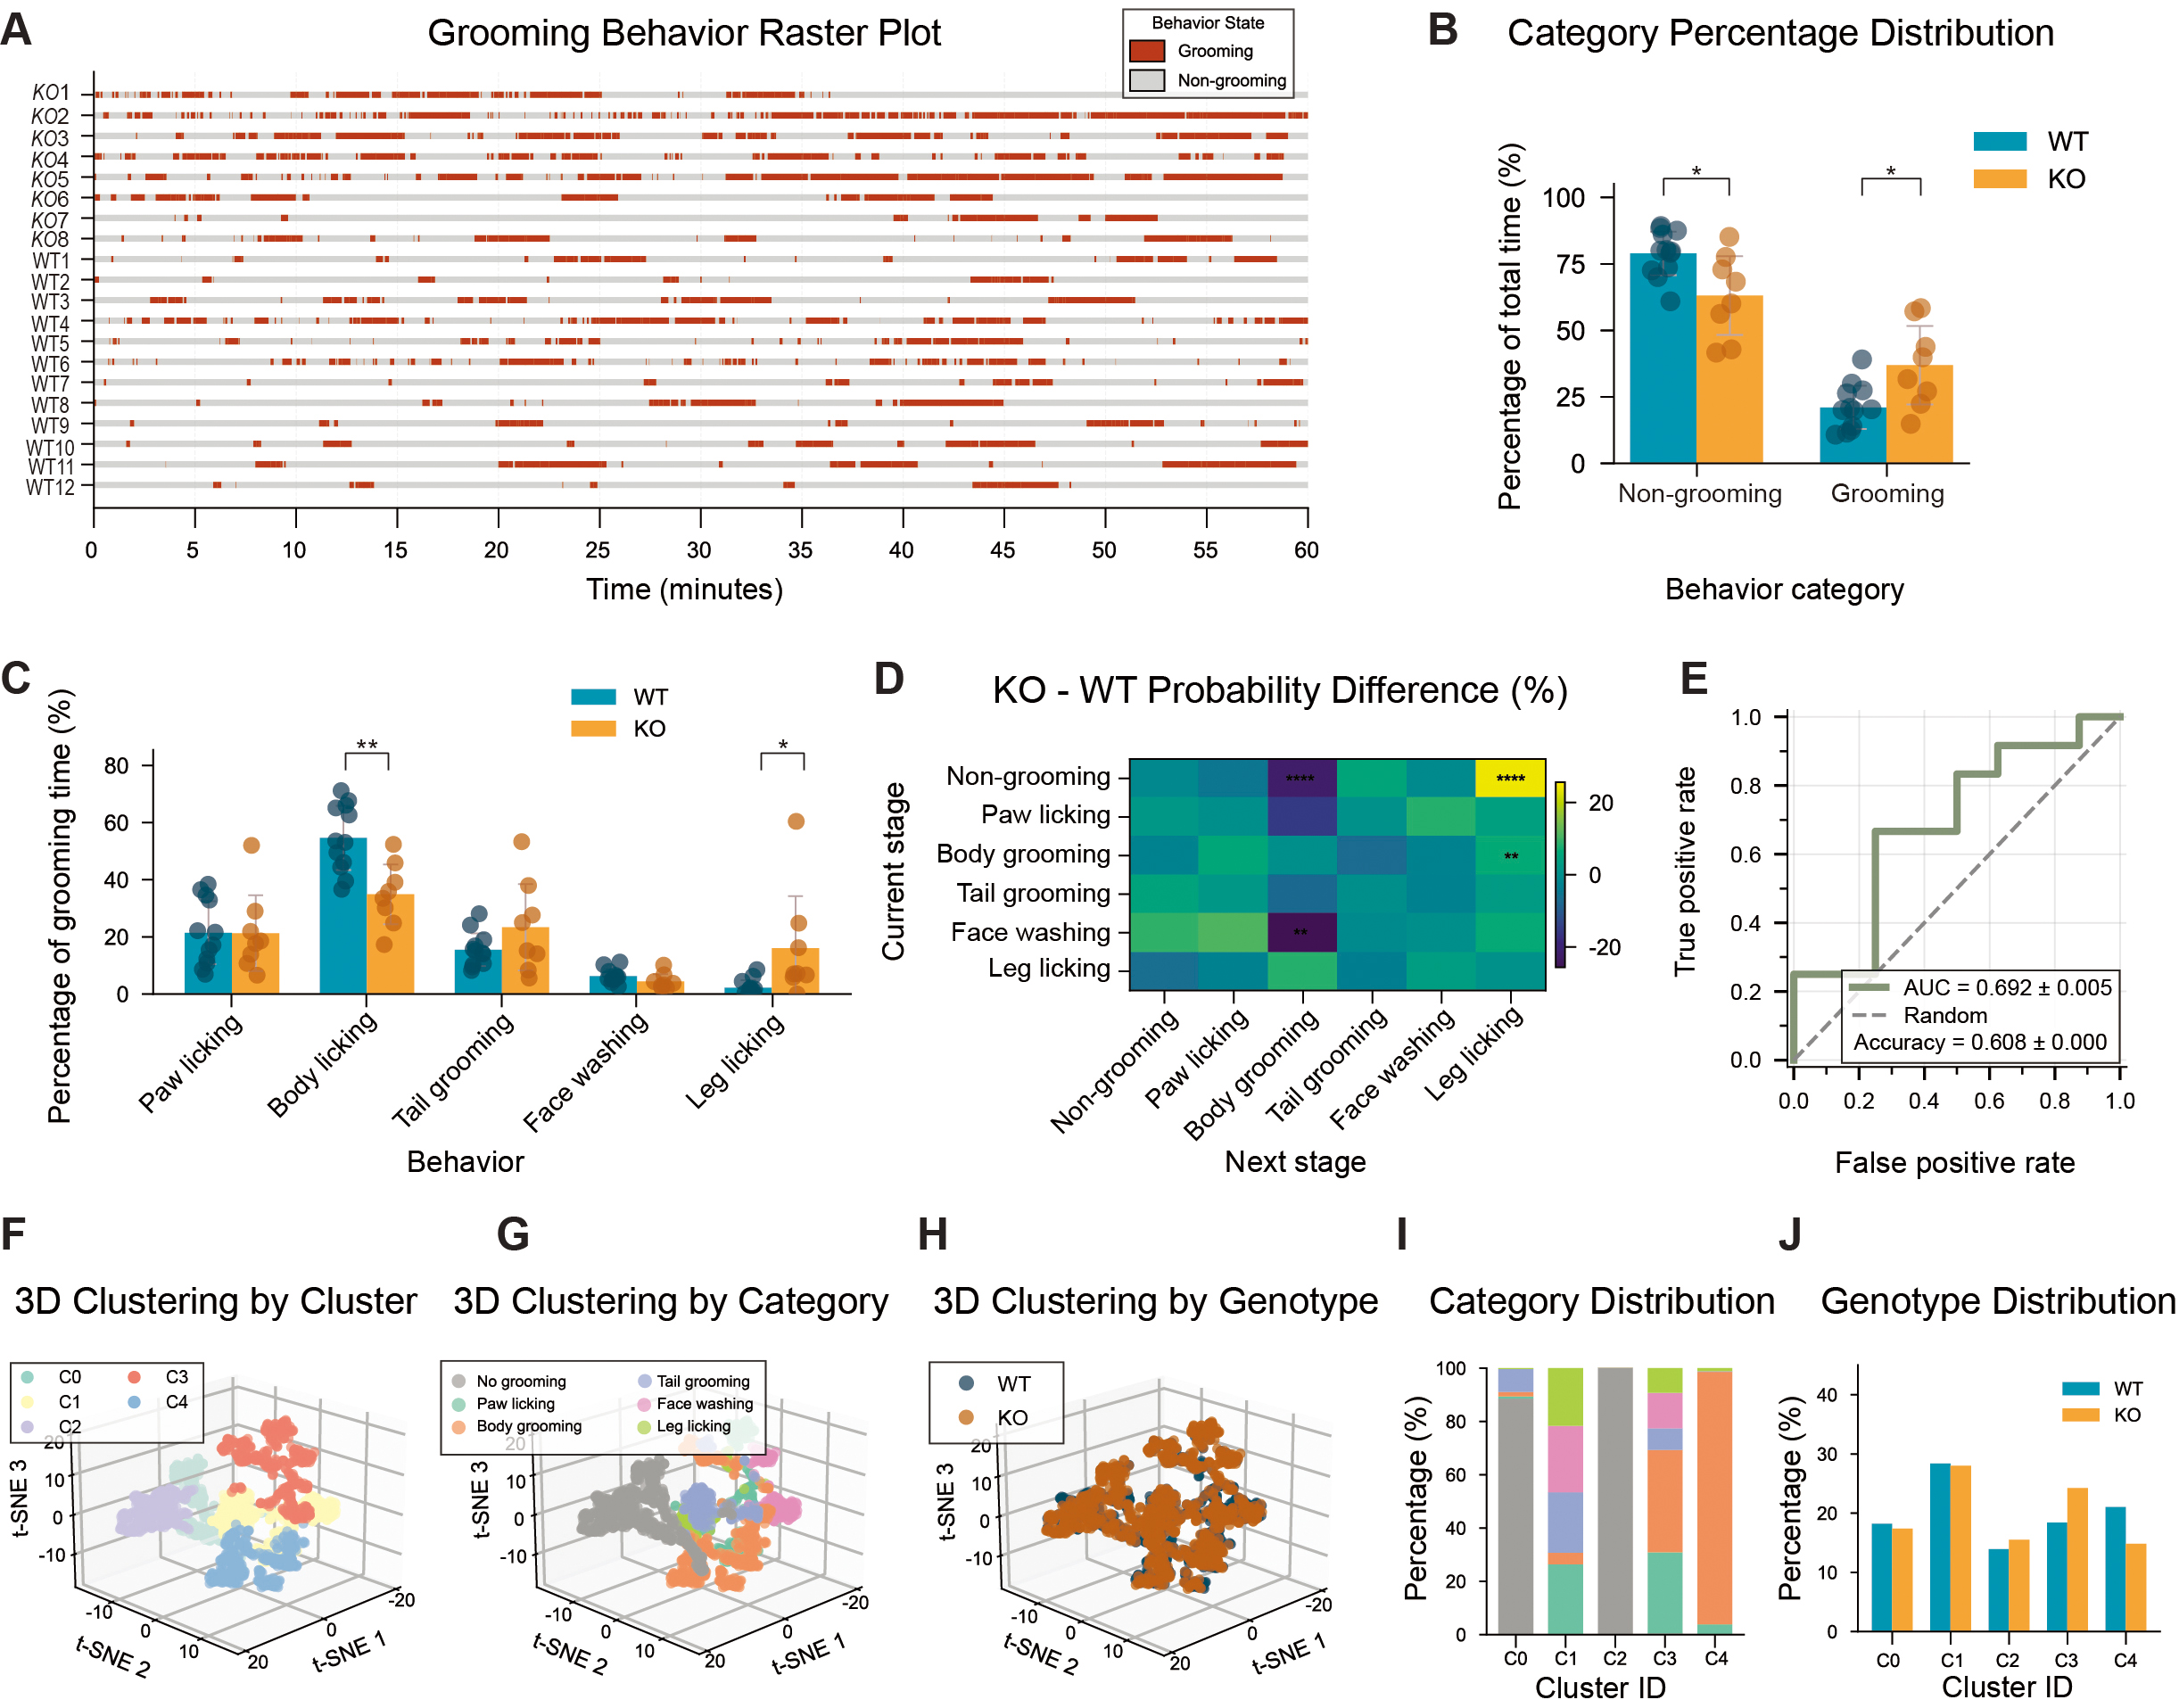
Figure 3. Increased grooming stereotypy and simplified behavioral structure in Shank3B KO mice. (A) Behavior raster plot depicting grooming and non-grooming states over time for each mouse. (B) Behavior category percentage distribution. (C) Detailed grooming behavior percentage distribution. (D) Difference matrix of behavioral transition probabilities between KO and WT mice. (E) ROC curve of SVM classifier based on behavioral events. (accuracy = 0.608 ± 0.000, AUC = 0.695 ± 0.005). (F) 3D t-SNE clustering plot colored by cluster. (G) 3D t-SNE clustering plot colored by six specific grooming behaviors. (H) 3D t-SNE clustering plot colored by genotype. (I) Stacked bar chart showing the percentage of behavioral categories in each cluster. (J) Standardized comparison of WT and KO event distribution across clusters. n = 12 mice for WT and n = 8 mice for KO. Data presented as means ± SEM. *P < 0.05, **P < 0.01, ****P < 0.0001. Comparisons between two groups were performed using two-tailed Student's t-test or Mann-Whitney U test as appropriate. For analyses involving multiple comparisons (behavioral subtype proportions, transition probabilities, cluster composition, and genotype distribution across clusters), p values are nominal; significance was determined using the Benjamini - Hochberg FDR procedure with q < 0.05.
To further resolve grooming microstructure, we performed dimensionality reduction and clustering on multidimensional grooming features, identifying five stable behavioral clusters (C0-C4) representing distinct grooming modules [Figure 3F]. Clusters C0, C1, and C3 were composed of mixed behavioral elements rather than single repetitive actions. C2 consisted almost exclusively of no-grooming states. C4 was dominated by body grooming. Cluster usage analysis revealed that C0, C1, and C2 showed comparable representation between genotypes. In contrast, cluster C3 was significantly enriched in KO mice, whereas cluster C4 was significantly enriched in WT mice [Figure 3G-J]. This cluster-level structure indicates that KO grooming behavior is more repetitive and less compositionally diverse, extending the conventional duration-based findings.
Shank3B KO mice exhibit anxiety-like and low-diversity exploratory behavior in the open field
Using standard open-field metrics, we observed behavioral differences consistent with previously described anxiety-like phenotypes in Shank3B KO models[17]. KO mice showed pronounced wall-following trajectories [Figure 4A], reduced center-zone time and distance, fewer center entries, and decreased total locomotion compared with WT mice [Figure 4B-G]. Movement velocity was also reduced across zones
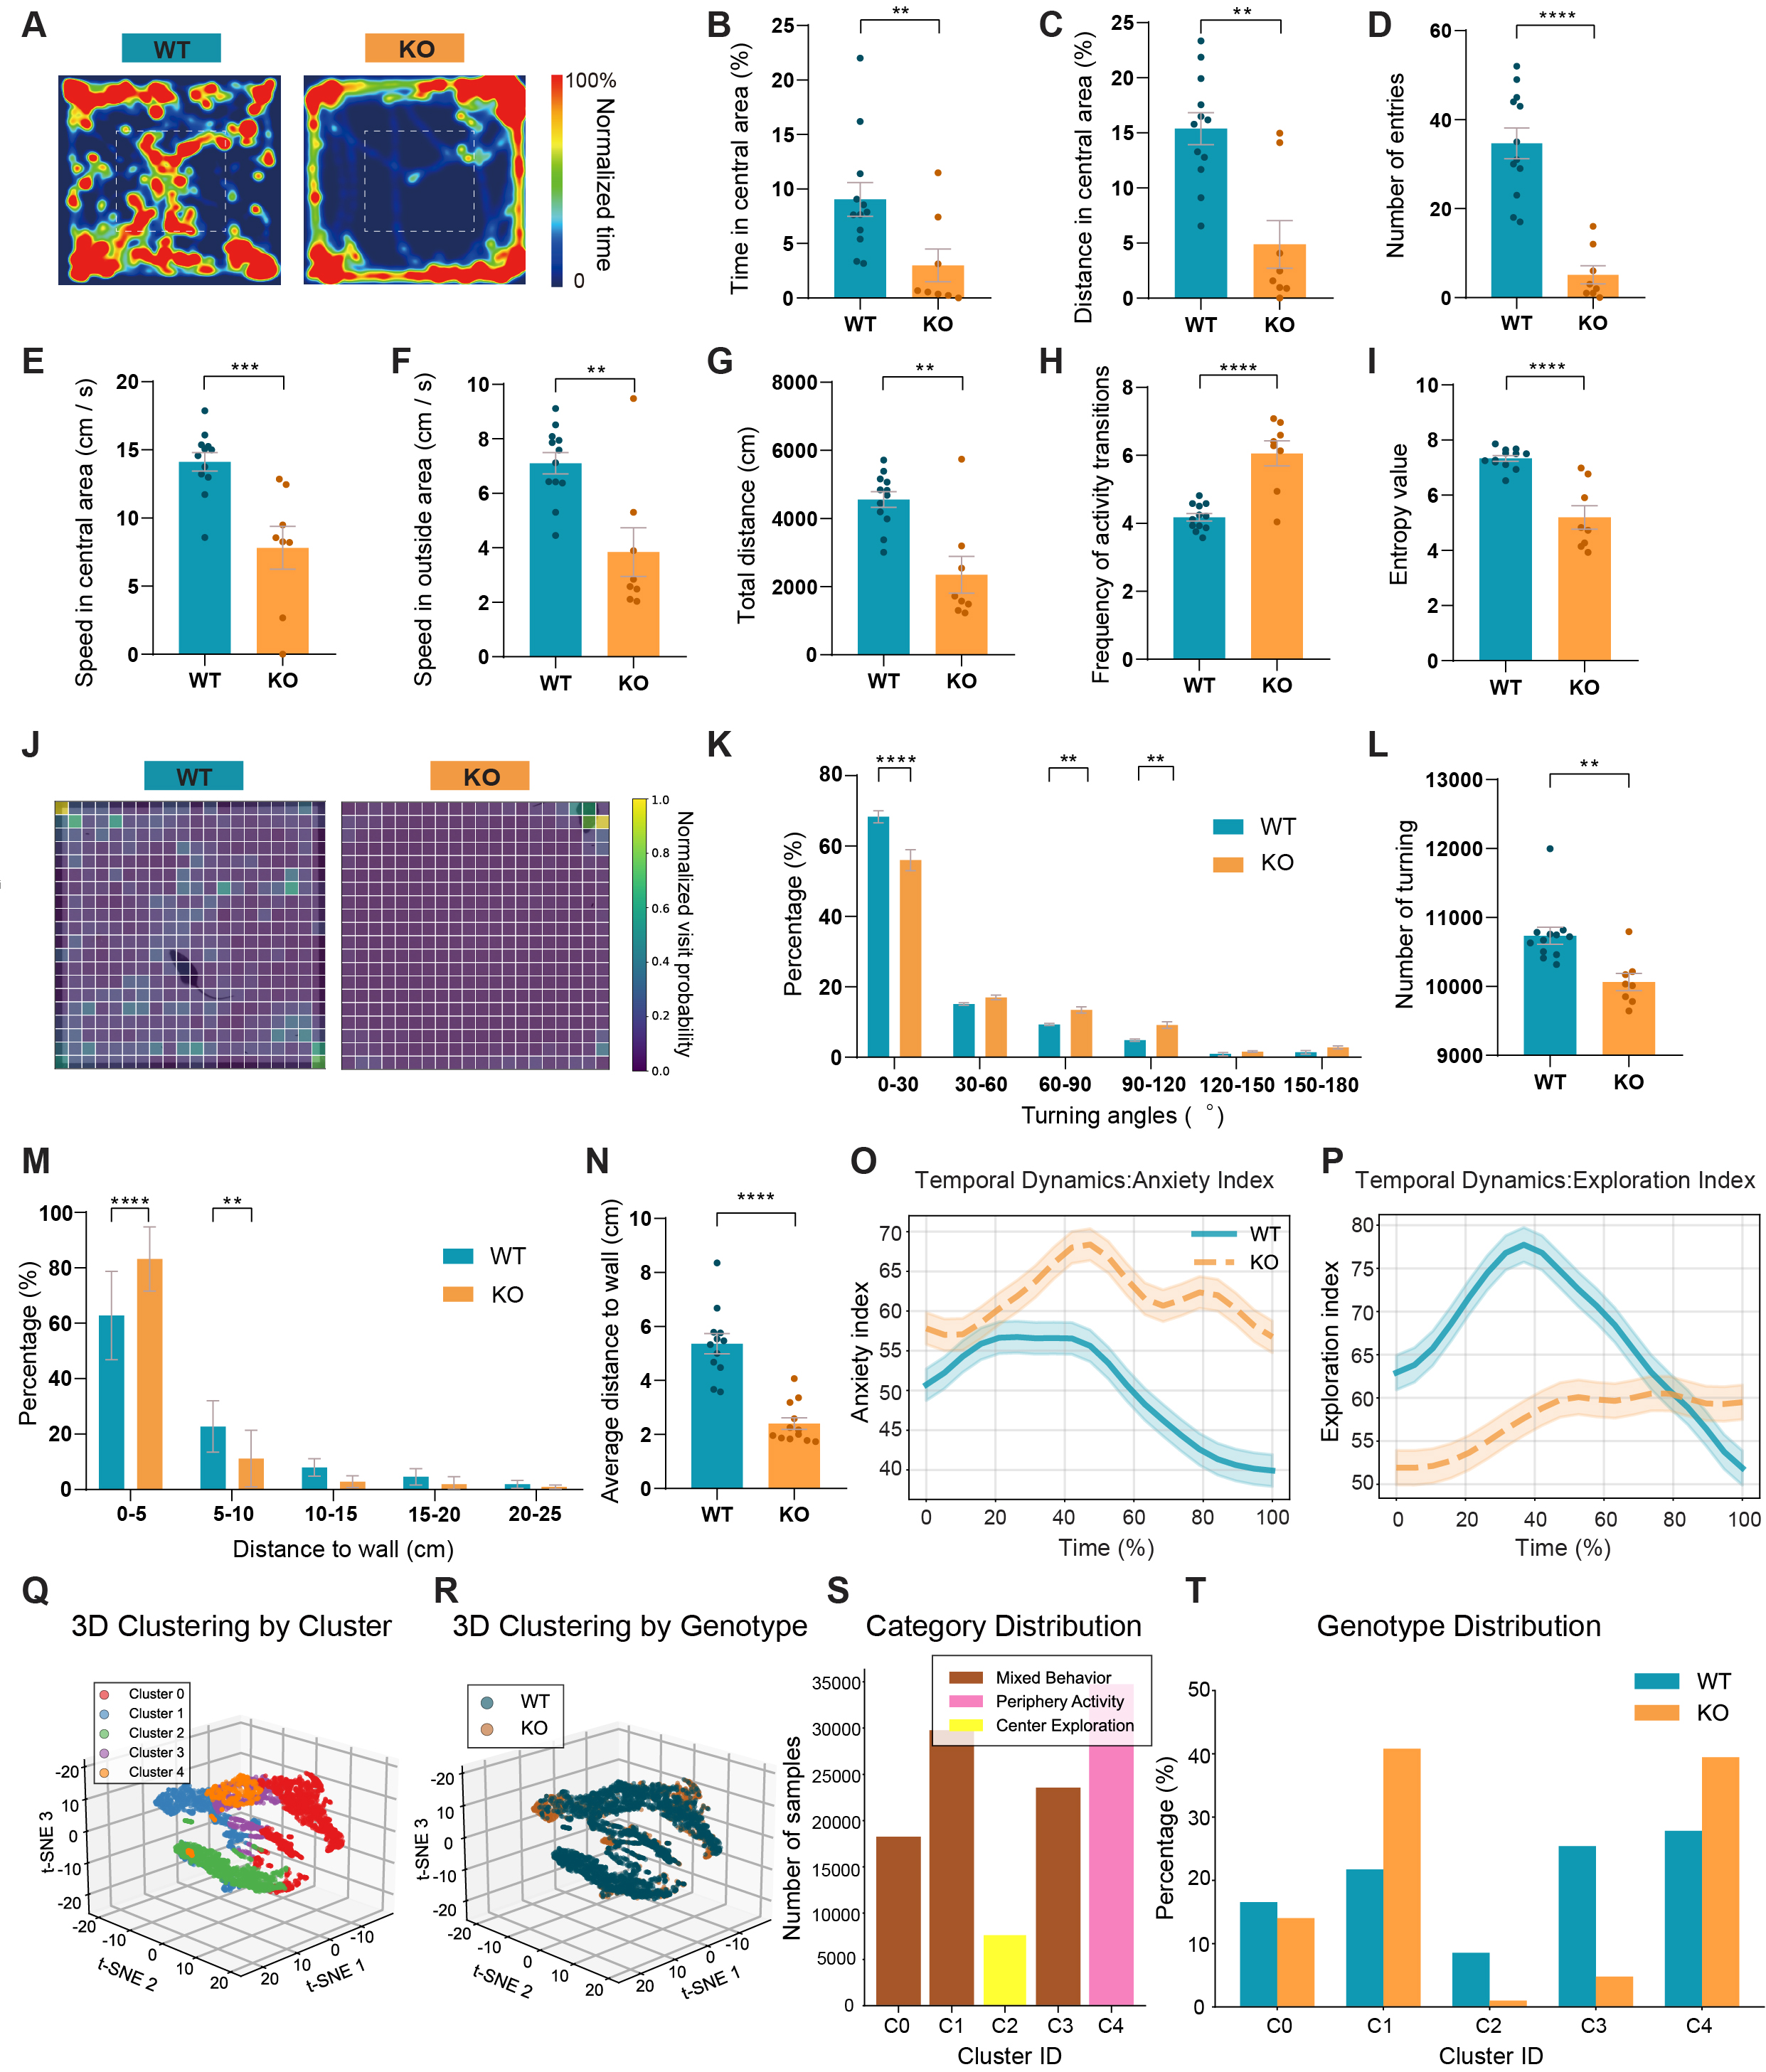
Figure 4. Anxiety-like and low-diversity exploratory behavior in Shank3B KO mice in the open field test. (A) Heatmaps of movement trajectories in the open field. (B) Percentage of time spent in central area. (C) Percentage of distance traveled in central area. (D) Entries in central area. (E) Speed in central area. (F) Speed in outside area. (G) Total distance traveled. (H) Locomotor transition frequency. (I) Trajectory entropy differences. (J) Heatmap of trajectory entropy. (K) Turning angle distribution. (L) Turning numbers. (M) Distribution of distances to the nearest wall. (N) Average wall distance. (O) The anxiety index’s temporal dynamics (P) The exploration index’s temporal dynamics. (Q) Three-dimensional trajectory clustering by cluster. (R) Three-dimensional trajectory clustering by genotype. (S) Biological interpretation of movement clusters. (T) Normalized genotype distribution within each cluster. n = 12 mice for WT and n = 8 mice for KO. Data presented as means ± SEM. **P < 0.01, ***P < 0.001, ****P < 0.0001. Comparisons between two groups were performed using two-tailed Student's t-test or Mann-Whitney U test as appropriate. For analyses involving multiple comparisons (behavioral subtype proportions, transition probabilities, cluster composition, and genotype distribution across clusters), p values are nominal; significance was determined using the Benjamini-Hochberg FDR procedure with q < 0.05.
Fine-scale trajectory analysis further revealed reduced path entropy and a shift toward small-angle turning in KO mice, together with fewer total turns [Figure 4H-L], indicating more predictable and stereotyped movement patterns. Detailed calculation method of the trajectory entropy is provided in
To characterize latent behavioral structure, we clustered multidimensional behavioral segments into five stable states (C0-C4) [Figure 4Q]. Clusters associated with center exploration and active locomotion were broadly represented in WT mice, whereas KO mice were strongly enriched in the periphery-dominant (Preference for outer zones) activity cluster (C1) and underrepresented in exploratory clusters [Figure 4R-T]. This cluster distribution pattern refines conventional zone-based metrics by revealing restricted behavioral state diversity in KO mice. Locomotion-related measures (total distance, speed, and turn number) were quantified to aid interpretation of these outcomes, as reduced activity could influence center exploration and movement patterns.
Shank3B KO mice show enhanced risk-avoidant behavioral organization in the elevated plus maze
Elevated plus maze testing revealed anxiety-like behavior in KO mice consistent with classical measures[17]. KO mice showed reduced open-arm time, distance, and entries, together with decreased total locomotor distance [Figure 5A-G]. Movement velocity was reduced in closed arms and modestly increased in open arms [Figure 5H and I], consistent with altered risk-context locomotion.
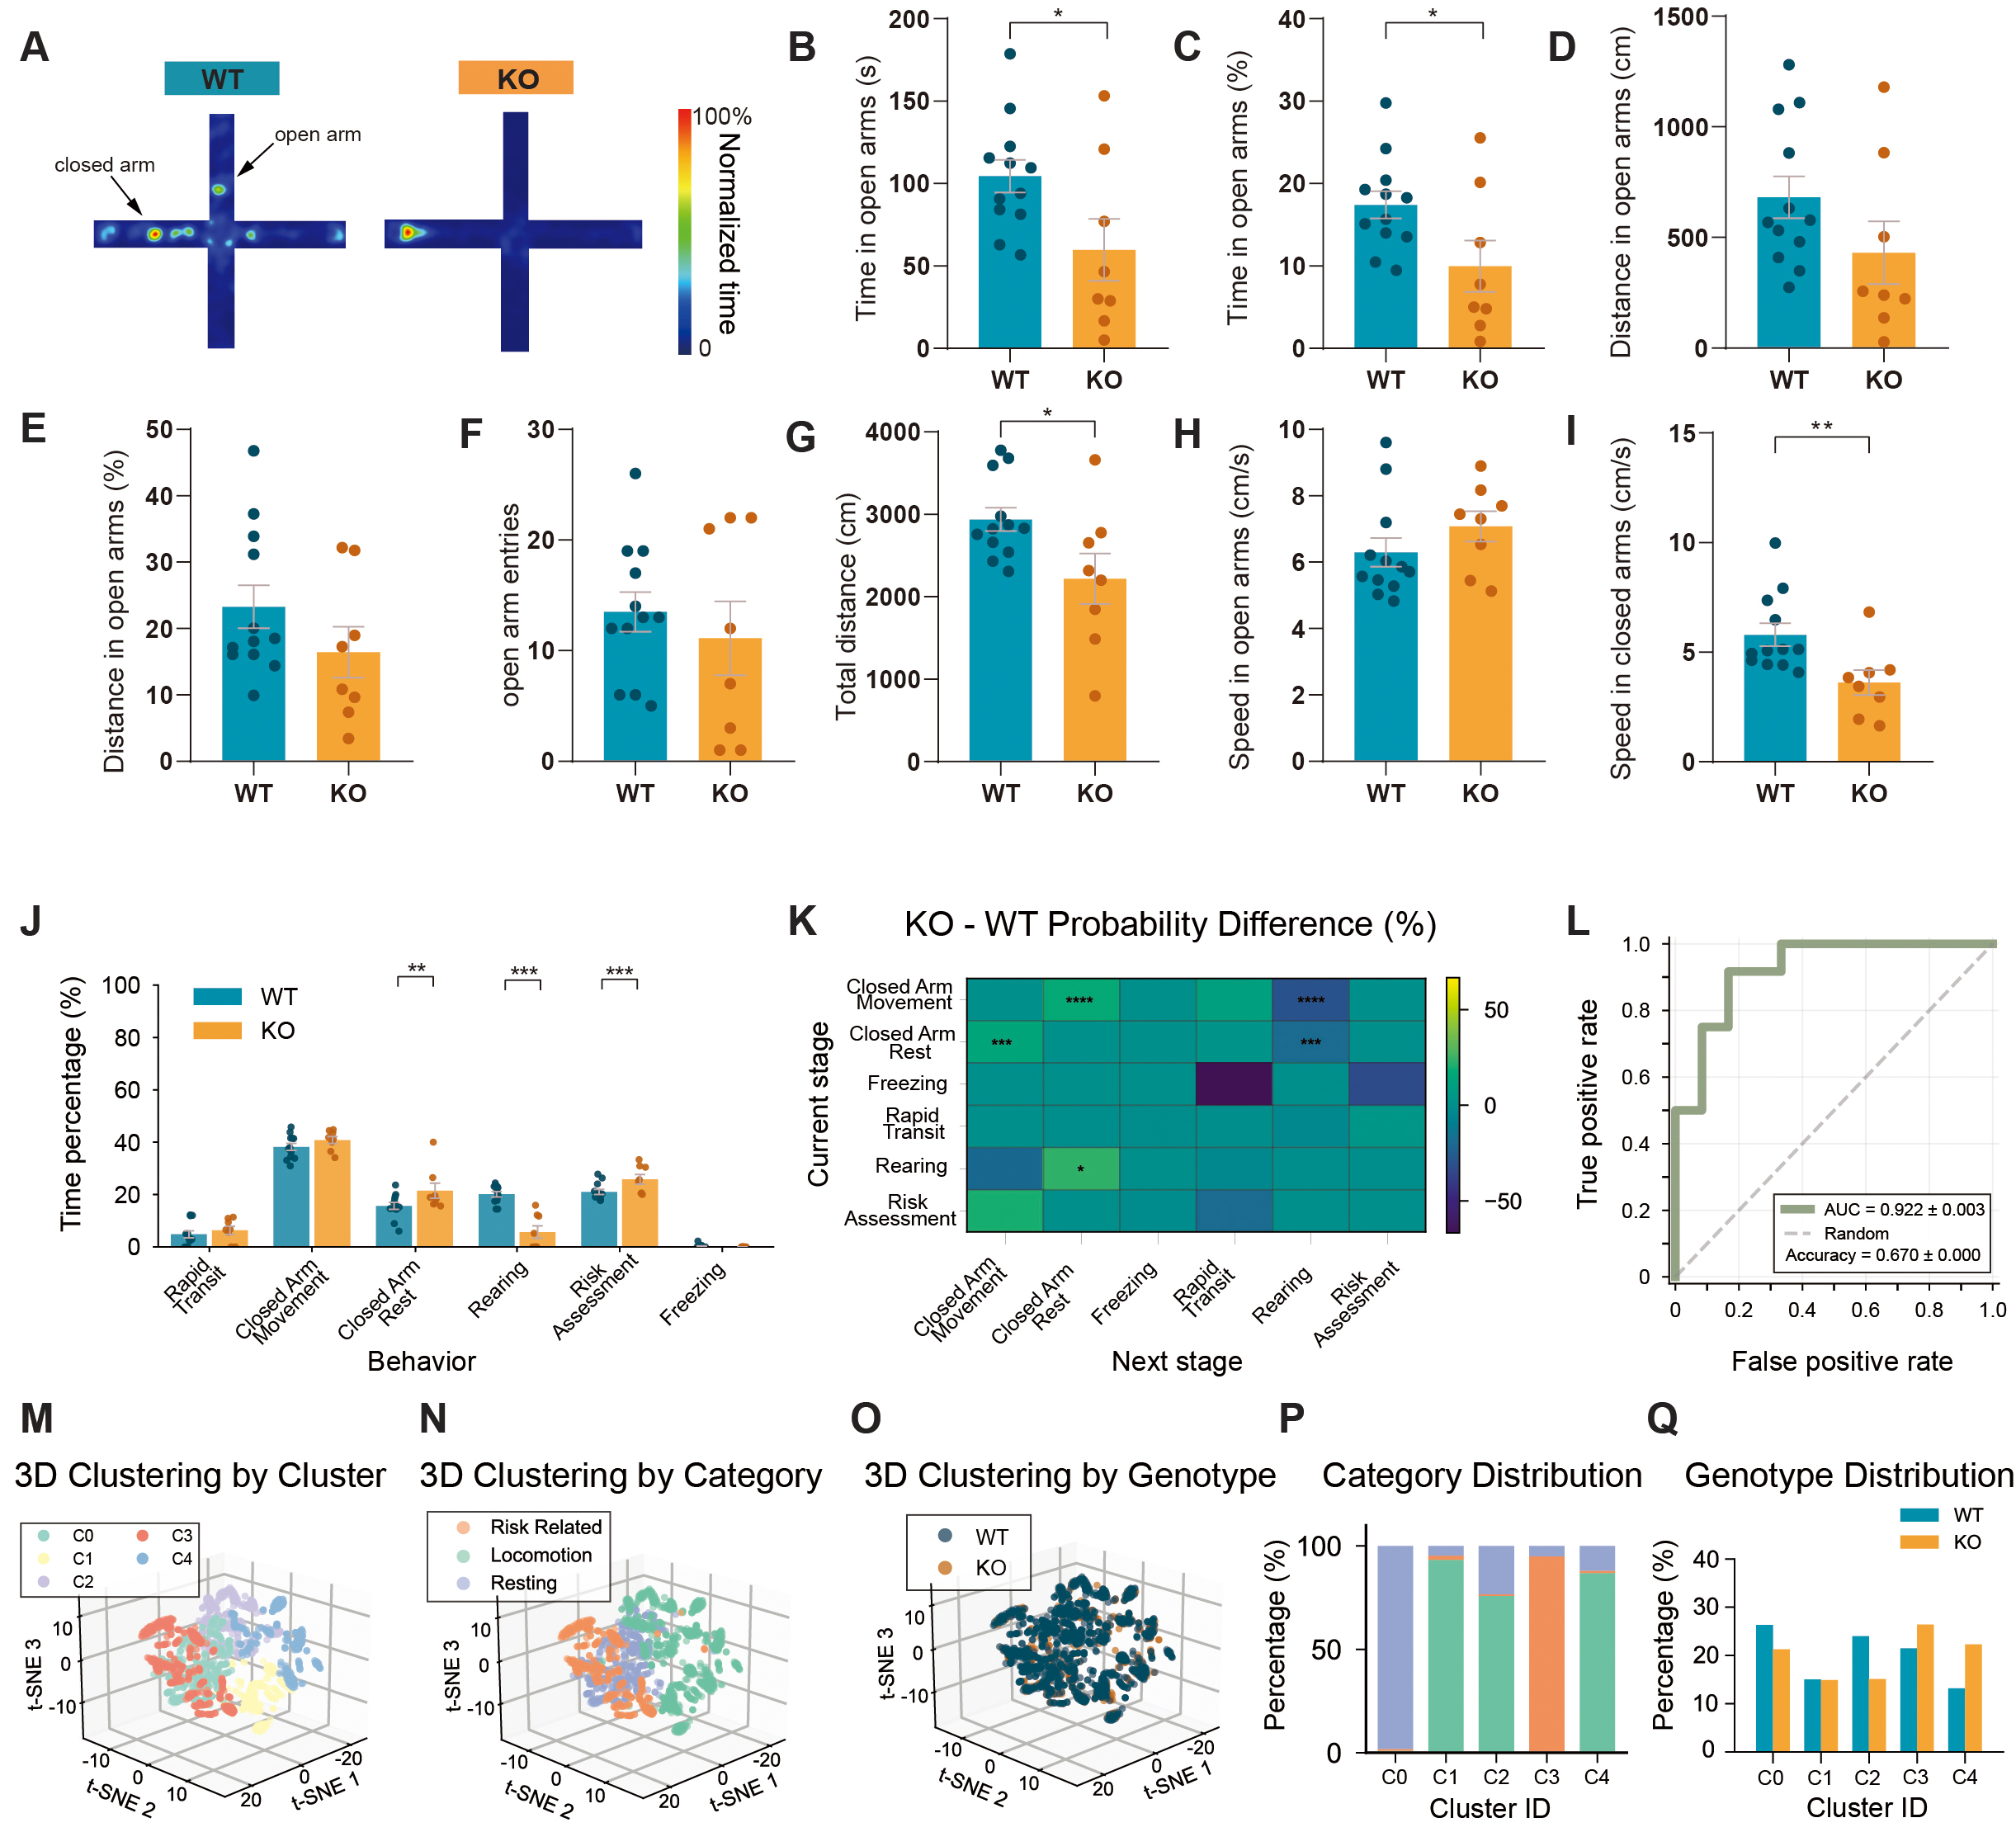
Figure 5. Enhanced risk-avoidant behavioral organization in Shank3B KO mice in the elevated plus maze test. (A) Heatmaps of movement trajectories in the elevated plus maze. (B) Time spent in open arms. (C) Percentage of time spent in open arms. (D) Distance traveled in open arms. (E) Percentage of distance traveled in open arms. (F) Entries in open arms. (G) Total distance traveled. (H) Speed in open arms. (I) Speed in closed arms. (J) Time allocation of behaviors in the elevated plus maze. (K) Difference matrix of behavioral transition probabilities between WT and KO mice. (L) ROC curve of SVM classifier based on behavioral events. (accuracy = 0.670 ± 0.000, AUC = 0.922 ± 0.003). (M) 3D t-SNE clustering plot colored by cluster. (N) 3D t-SNE clustering plot colored by behavioral category. (O) 3D t-SNE clustering plot colored by genotype. (P) Stacked bar chart showing the percentage of major behavioral categories in each cluster. (Q) Standardized comparison of WT and KO event distribution across clusters. n = 12 mice for WT and n = 8 mice for KO. Data presented as means ± SEM. *P < 0.05, **P < 0.01, ***P < 0.001, ****P < 0.0001. Comparisons between two groups were performed using two-tailed Student's t-test or Mann-Whitney U test as appropriate. For analyses involving multiple comparisons (behavioral subtype proportions, transition probabilities, cluster composition, and genotype distribution across clusters), p values are nominal; significance was determined using the Benjamini - Hochberg FDR procedure with q < 0.05.
Behavioral composition analysis indicated a higher proportion of risk-avoidant (Behaviors that minimize exposure to dangerous areas) behavioral states and reduced rearing in KO mice [Figure 5J]. D Transition probability mapping further showed that KO mice preferentially cycled among closed-arm states and were less likely to transition into locomotor and exploratory states [Figure 5K]. Behavioral-feature-based SVM classification again reliably separated genotypes [Figure 5L].
Clustering of multidimensional behavioral features identified five latent behavioral modules (C0-C4) with distinct behavioral associations [Figure 5M and N]. KO mice were enriched in clusters corresponding to risk-avoidant and closed-arm-dominant states (C3/C4), whereas WT mice showed greater representation in clusters associated with rest-exploration balance (C0/C2) [Figure 5O-Q]. These cluster-level differences extend traditional arm-based metrics by revealing genotype-dependent behavioral organization patterns. Locomotor activity measures (total distance and arm-specific speed) were quantified to facilitate interpretation, recognizing that reduced locomotion may partially account for decreased open-arm exploration.
DISCUSSION
In this study, we developed and validated a fine-grained behavioral phenotyping pipeline that integrates markerless pose estimation with multidimensional behavioral state analysis across classical behavioral paradigms. Rather than replacing established behavioral tests, this framework enhances analytical resolution within standard assays and enables structured, quantitative parsing of behavioral microstructure. Using a Shank3B KO ASD mouse model as a proof of concept, we show that this approach sensitively captures genotype-dependent behavioral organization and improves discrimination between mutant and control animals.
Our results confirm, using conventional behavioral metrics, that Shank3B KO mice exhibit social deficits, increased repetitive grooming, and elevated anxiety-like behavior, phenotypes consistent with prior reports[30-32]. Building on these established findings, the fine-scale analytical pipeline further resolved behavioral structure, transition dynamics, and latent behavioral state clusters that are not accessible through coarse summary measures alone. Cluster-based and state-transition analyses revealed restricted behavioral diversity and biased state organization in KO mice across multiple paradigms, while supervised classifiers reliably predicted genotype from behavioral features. Together, these findings support the value of high-resolution behavioral parsing for strengthening gene-behavior association analyses.
The reliability of this machine learning-enhanced behavioral analysis is also supported by convergent findings from other autism rodent models employing complementary computational approaches[33,34]. Maisterrena et al. utilized the Live Mouse Tracker to capture long-term social network dynamics in VPA-exposed female mice[35], excelling at quantifying inter-individual interactions over extended periods. Sheppard et al. developed a deep-learning pipeline for high-resolution gait and posture analysis in the open field[36], identifying heritable stride metrics and gait deficits across multiple ASD models with exceptional granularity for locomotion. Klibaite et al. advanced the field with s-DANNCE for high-resolution 3D tracking of social interactions[37], revealing multi-scale behavioral motifs and social touch patterns across seven ASD rat models with unparalleled depth in inter-animal coordination. In addition, Chari et al. employed Neuropixels recordings combined with machine learning-based behavioral quantification to investigate social touch processing in Fmr1 KO mice[38]. Using a head-fixed assay with DeepLabCut-based facial expression analysis, they demonstrated that Fmr1 KO mice fail to discriminate social from non-social touch at both behavioral and neural levels, exhibiting similar aversion to both stimuli. Collectively, these complementary lines of evidence from different autism models—spanning neural circuit dysfunction, inter-individual social dynamics, and multi-domain behavioral microstructure—underscore the reliability and translational value of machine learning-enhanced approaches. Notably, our framework distinguishes itself by systematically integrating multiple classical paradigms into a unified analytical pipeline, providing a practical and scalable tool for capturing structured, genotype-specific behavioral phenotypes that conventional metrics alone cannot resolve.
Because SHANK3 is a high-confidence risk gene for ASD, linking mutation status to reproducible and quantifiable behavioral structure is particularly important. The present framework provides a scalable way to map genotype to behavioral state organization, offering potential utility for phenotypic stratification and cross-model comparison. Recent machine learning-based behavioral frameworks have substantially advanced fine-scale behavioral mapping in these animal models. For example, atlas-level social behavior embedding approaches and hierarchical 3D motion learning frameworks have demonstrated that unsupervised behavioral module discovery can differentiate Shank3B KO mice from controls based on spontaneous[39] or free-social behavioral structure[40]. These systems leverage large-scale behavioral segmentation, module clustering, and low-dimensional embedding to define phenotype spaces in which disease-model animals occupy distinct regions, thereby enabling genotype discrimination based on behavioral organization rather than single summary metrics. Our findings are conceptually consistent with these studies in showing that high-dimensional behavioral representations and cluster-level structure can robustly separate Shank3B KO and WT mice. Notably, prior frameworks have emphasized unconstrained spontaneous or free-social behavior and large behavioral module atlases, highlighting the power of unsupervised discovery of latent behavioral units. In contrast, the present study focuses on enhancing analytical resolution within widely used classical behavioral paradigms. Rather than building a fully unsupervised behavioral atlas, our approach integrates pose-based feature extraction and state clustering directly into standard tests such as the three-chamber, grooming, open field, and elevated plus maze assays.
Several limitations should be considered. First, although multiple widely used behavioral paradigms were included, the test battery remains limited, and additional assays could further broaden behavioral coverage and enhance translational relevance[41]. Second, the sample size is relatively small, which may limit statistical power and heighten the risk of overfitting, notwithstanding the use of cross-validation. Third, only male mice were included in this study. Future studies with larger cohorts encompassing both sexes are therefore warranted to validate and extend our conclusions. Fourth, the current pipeline focuses exclusively on behavioral structure and does not incorporate parallel molecular or neural activity measures. Future studies combining fine-grained behavioral phenotyping with transcriptomic, proteomic, or circuit-level data could strengthen mechanistic interpretation and establish direct links between genotype, neural function, and behavior. Finally, while we quantified locomotion-related measures (e.g., total distance, speed, turning number, path entropy) to aid interpretation, the observed behavioral differences in KO mice—including reduced center/open-arm exploration—may be partially influenced by their overall hypoactivity. We therefore interpret these findings with caution, acknowledging that motor deficits or reduced general activity could contribute to the reported phenotypes.
In summary, we have established a machine learning-enhanced behavioral analysis framework that substantially increases phenotypic resolution within classical behavioral paradigms. Validation in a Shank3B KO genetic model demonstrates its ability to detect structured, genotype-specific behavioral alterations. By integrating multi-domain behavioral state clustering and transition dynamics analysis across standardized tests, this approach provides a practical and scalable tool for more precise behavioral screening in genetically defined models. The framework holds significant promise for advancing translational research in neurodevelopmental and psychiatric disorders, particularly for phenotype-driven drug discovery and cross-model comparative studies.
DECLARATIONS
Authors’ contributions
Investigation, formal analysis, writing-original draft: Liu J, Shen C
Formal analysis: Yang T, Li K
Conceptualization, methodology, writing-review & editing, supervision: Xi K
Conceptualization, writing-review & editing, supervision, funding acquisition: Guo B
Availability of data and materials
Raw/original data and codes used for analysis in this study are available from the corresponding author upon reasonable request.
AI and AI-assisted tools Statement
During the preparation of this manuscript, the AI tool DeepSeek (version 3.0, released 2024-12-26) was used solely for language editing. The tool did not influence the study design, data collection, analysis, interpretation, or the scientific content of the work. All authors take full responsibility for the accuracy, integrity, and final content of the manuscript.
Financial support and sponsorship
This work was supported by the Brain Science and Brain-like Intelligence Technology-National Science and Technology Major Project (2025ZD0216200 to Guo B), the National Natural Science Foundation of China (82422030, 32471069 and 82201699 to Guo B).
Conflicts of interest
Guo B is a Junior Editorial Board Member of the Journal of Translational Genetics and Genomics. Guo B was not involved in any steps of the editorial process, notably reviewer selection, manuscript handling, or decision-making, while the other authors have declared that they have no conflicts of interest.
Ethical approval and consent to participate
All procedures were approved by the Institutional Animal Care and Use Committee (IACUC) of the Fourth Military Medical University (Approval No.251529) and followed the ARRIVE 2.0 guidelines, in accordance with the National Institutes of Health (NIH) Guide for the Care and Use of Laboratory Animals.
Consent for publication
Not applicable.
Copyright
© The Author(s) 2026.
Supplementary Materials
REFERENCES
1. Genetics of neurological and psychiatric disorders. Res Publ Assoc Res Nerv Ment Dis. 1983;60:1-300.
2. Striano P. Unraveling the genetic tapestry of neurodevelopmental disorders: a new horizon. J Transl Genet Genom. 2024;8:278-80.
3. Wang S, Wang M, Zhang P, et al. Genome-wide by lifetime environment interaction studies of brain imaging phenotypes. Adv Sci. 2025;13:e00852.
4. Smeland OB, Kutrolli G, Bahrami S, et al. A genome-wide analysis of the shared genetic risk architecture of complex neurological and psychiatric disorders. Nat Neurosci. 2025;28:2439-50.
5. Zhang C, Li M, Sun P, et al. Trans-ancestry genome-wide analyses of bipolar disorder in East Asian and European populations improve genetic discovery. Nat Neurosci. 2025;29:293-305.
6. Yang Y, Sun X, Sun Y, et al. Nkapl deletion drives cognitive deficits through mPFC interneuron dysfunction in a mouse model of schizophrenia. Sci Adv. 2025;11:eadv4779.
7. Durand CM, Betancur C, Boeckers TM, et al. Mutations in the gene encoding the synaptic scaffolding protein SHANK3 are associated with autism spectrum disorders. Nat Genet. 2006;39:25-7.
8. Chan JKY, Leung PWL. Common outcome, different pathways: social information-processing deficits in autism spectrum disorder and attention-deficit/hyperactivity disorder. World J Psychiatry. 2022;12:286-97.
9. Peça J, Feliciano C, Ting JT, et al. Shank3 mutant mice display autistic-like behaviours and striatal dysfunction. Nature. 2011;472:437-42.
10. Guo B, Chen J, Chen Q, et al. Anterior cingulate cortex dysfunction underlies social deficits in Shank3 mutant mice. Nat Neurosci. 2019;22:1223-34.
11. Chen Q, Deister CA, Gao X, et al. Dysfunction of cortical GABAergic neurons leads to sensory hyper-reactivity in a Shank3 mouse model of ASD. Nat Neurosci. 2020;23:520-32.
12. Orefice LL, Zimmerman AL, Chirila AM, Sleboda SJ, Head JP, Ginty DD. Peripheral mechanosensory neuron dysfunction underlies tactile and behavioral deficits in mouse models of ASDs. Cell. 2016;166:299-313.
13. Orefice LL, Mosko JR, Morency DT, et al. Targeting peripheral somatosensory neurons to improve tactile-related phenotypes in ASD models. Cell. 2019;178:867-86.e24.
14. Guo B, Liu T, Choi S, et al. Restoring thalamocortical circuit dysfunction by correcting HCN channelopathy in Shank3 mutant mice. Cell Rep Med. 2024;5:101534.
15. Balaan C, Corley MJ, Eulalio T, et al. Juvenile Shank3b deficient mice present with behavioral phenotype relevant to autism spectrum disorder. Behav Brain Res. 2019;356:137-47.
16. Mathis MW, Mathis A. Joint modelling of brain and behaviour dynamics with artificial intelligence. Nat Rev Neurosci. 2025;27:87-100.
17. Liu H, Huang X, Xu J, et al. Dissection of the relationship between anxiety and stereotyped self-grooming using the Shank3B mutant autistic model, acute stress model and chronic pain model. Neurobiol Stress. 2021;15:100417.
18. Mathis A, Mamidanna P, Cury KM, et al. DeepLabCut: markerless pose estimation of user-defined body parts with deep learning. Nat Neurosci. 2018;21:1281-9.
20. Lauer J, Zhou M, Ye S, et al. Multi-animal pose estimation, identification and tracking with DeepLabCut. Nat Methods. 2022;19:496-504.
21. Weinreb C, Pearl JE, Lin S, et al. Keypoint-MoSeq: parsing behavior by linking point tracking to pose dynamics. Nat Methods. 2024;21:1329-39.
22. Canela-Grimau M, Pinho JS, Busquets-Garcia A. Profiling mouse behavior with computational tools to assess age-dependent differences in associative learning. Cell Rep Methods. 2025;5:101144.
23. Hsu AI, Yttri EA. B-SOiD, an open-source unsupervised algorithm for identification and fast prediction of behaviors. Nat Commun. 2021;12:5188.
24. Shen Y, Thomas J, Chen X, et al. Behavior decoding delineates seizure microfeatures and associated sudden death risks in mouse models of epilepsy. Ann Neurol. 2025;99:231-47.
25. Tillmann JF, Hsu AI, Schwarz MK, Yttri EA. A-SOiD, an active-learning platform for expert-guided, data-efficient discovery of behavior. Nat Methods. 2024;21:703-11.
26. Moy SS, Nadler JJ, Perez A, et al. Sociability and preference for social novelty in five inbred strains: an approach to assess autistic‐like behavior in mice. Genes Brain Behavior. 2004;3:287-302.
27. Mei Y, Monteiro P, Zhou Y, et al. Adult restoration of Shank3 expression rescues selective autistic-like phenotypes. Nature. 2016;530:481-4.
28. Tabaka O, Lawal S, Del Rio Triana R, et al. Prefrontal oxytocin receptor positive cells mediate stress-induced anxiety in tuberous sclerosis complex. Commun Biol. 2025;8:1789.
29. Muir J, Lin S, Aarrestad IK, et al. Isolation of psychedelic-responsive neurons underlying anxiolytic behavioral states. Science. 2024;386:802-10.
30. Ciancone-Chama AG, Bonaldo V, Biasini E, Bozzi Y, Balasco L. Gene expression profiling in trigeminal ganglia from Cntnap2-/- and Shank3b-/- mouse models of autism spectrum disorder. Neuroscience. 2023;531:75-85.
31. Burke FF, Randell AM, Sparkes KM, et al. Perinatal hyperandrogenization and immune activation in rodents model subtypes of autism. Transl Psychiatry. 2026;16:97.
32. Lipina TV, Niwa M, Jaaro‐Peled H, et al. Enhanced dopamine function in DISC1‐L100P mutant mice: implications for schizophrenia. Genes Brain Behavior. 2010;9:777-89.
33. Bouargane Z, Olucha-Bordonau FE, Bennis M, Ba-M’hamed S, Lamghari-Moubarrad F. Comparative analysis of BORIS, Ethovision, DeepLabCut, and SimBA for quantifying autism spectrum disorder-like behaviors in the valproic acid mouse model. Neurosci Lett. 2026;875:138542.
34. Khan T, Cherkas K, Francis NA. Quantifying social distance using deep learning-based video analysis: results from the BTBR mouse model of autism. Front Behav Neurosci. 2025;19:1602205.
35. Maisterrena A, De Chaumont F, Longueville J, Balado E, Ey E, Jaber M. Female mice prenatally exposed to valproic acid exhibit complex and prolonged social behavior deficits. Prog Neuropsychopharmacol Biol Psychiatry. 2024;131:110948.
36. Sheppard K, Gardin J, Sabnis GS, et al. Stride-level analysis of mouse open field behavior using deep-learning-based pose estimation. Cell Rep. 2022;38:110231.
37. Klibaite U, Li T, Aldarondo D, Akoad JF, Ölveczky BP, Dunn TW. Mapping the landscape of social behavior. Cell. 2025;188:2249-66.e23.
38. Chari T, Hernandez A, Couto J, Portera-Cailliau C. A reduced ability to discriminate social from non-social touch at the circuit level may underlie social avoidance in autism. Nat Commun. 2025;16:4600.
39. Huang K, Han Y, Chen K, et al. A hierarchical 3D-motion learning framework for animal spontaneous behavior mapping. Nat Commun. 2021;12:2784.
40. Han Y, Chen K, Wang Y, et al. Multi-animal 3D social pose estimation, identification and behaviour embedding with a few-shot learning framework. Nat Mach Intell. 2024;6:48-61.
Cite This Article
How to Cite
Download Citation
Export Citation File:
Type of Import
Tips on Downloading Citation
Citation Manager File Format
Type of Import
Direct Import: When the Direct Import option is selected (the default state), a dialogue box will give you the option to Save or Open the downloaded citation data. Choosing Open will either launch your citation manager or give you a choice of applications with which to use the metadata. The Save option saves the file locally for later use.
Indirect Import: When the Indirect Import option is selected, the metadata is displayed and may be copied and pasted as needed.
About This Article
Copyright

Data & Comments
Data
0


Comments
Comments must be written in English. Spam, offensive content, impersonation, and private information will not be permitted. If any comment is reported and identified as inappropriate content by OAE staff, the comment will be removed without notice. If you have any queries or need any help, please contact us at [email protected].