


fig4
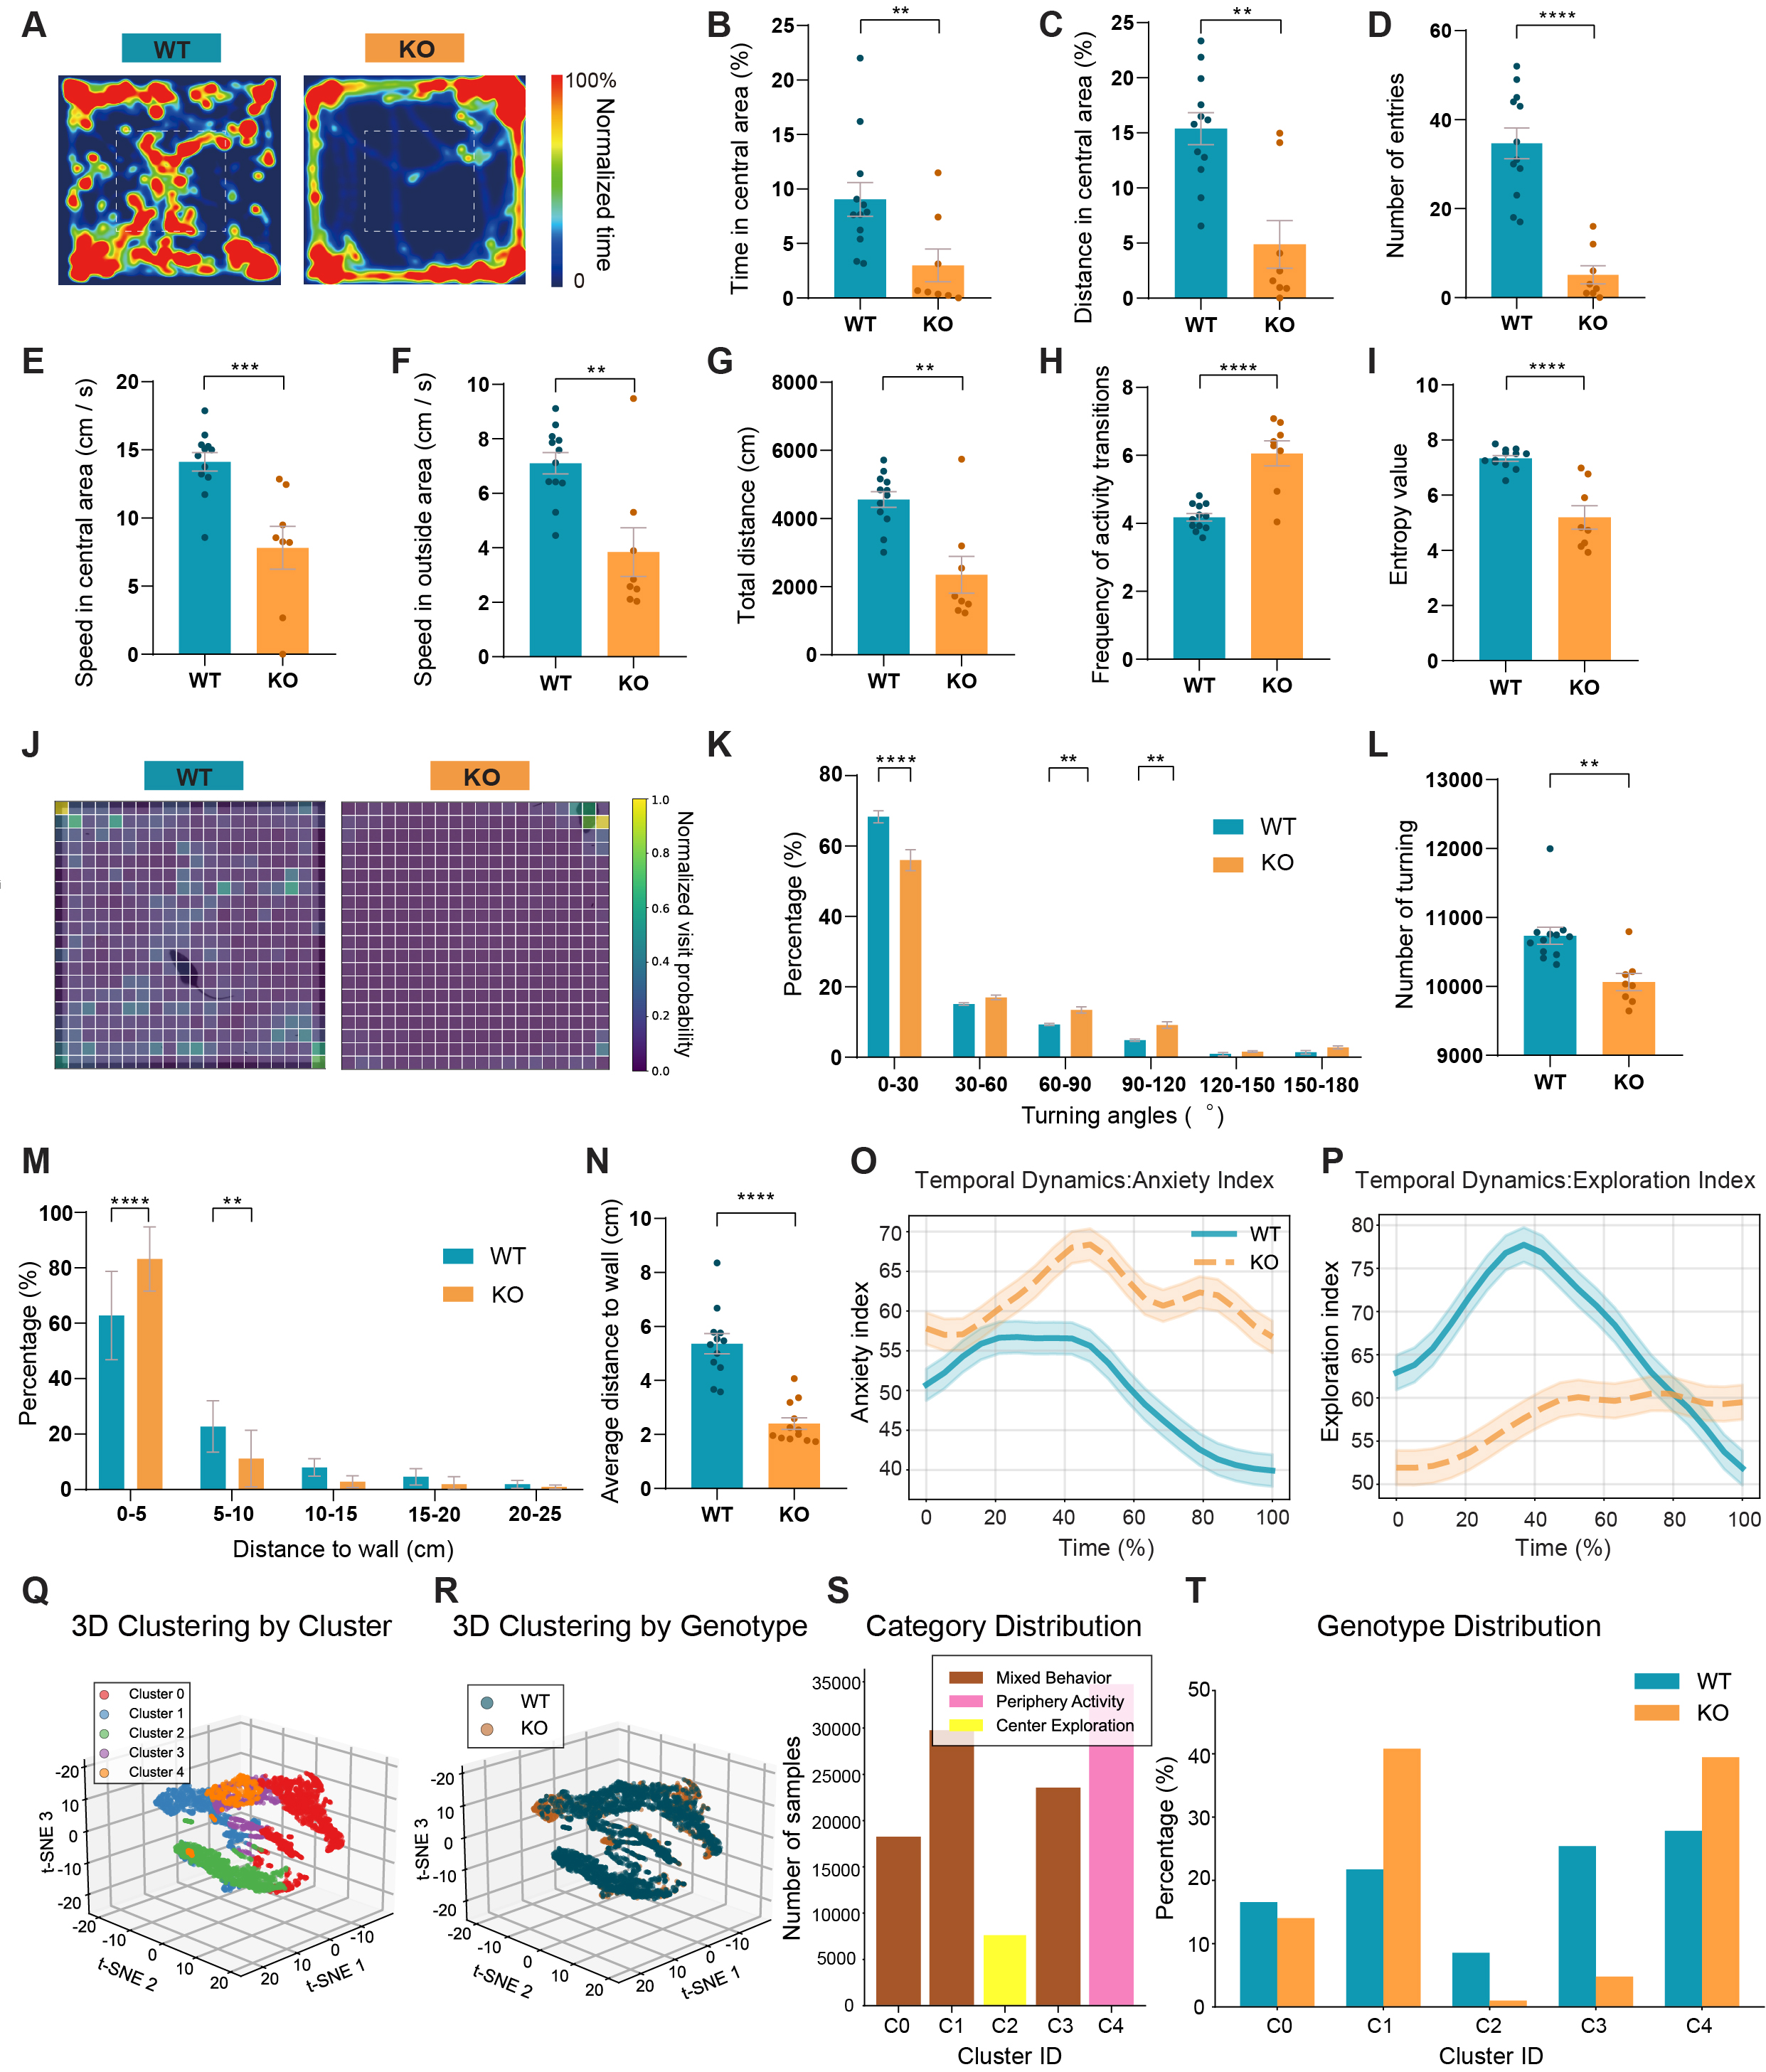
Figure 4. Anxiety-like and low-diversity exploratory behavior in Shank3B KO mice in the open field test. (A) Heatmaps of movement trajectories in the open field. (B) Percentage of time spent in central area. (C) Percentage of distance traveled in central area. (D) Entries in central area. (E) Speed in central area. (F) Speed in outside area. (G) Total distance traveled. (H) Locomotor transition frequency. (I) Trajectory entropy differences. (J) Heatmap of trajectory entropy. (K) Turning angle distribution. (L) Turning numbers. (M) Distribution of distances to the nearest wall. (N) Average wall distance. (O) The anxiety index’s temporal dynamics (P) The exploration index’s temporal dynamics. (Q) Three-dimensional trajectory clustering by cluster. (R) Three-dimensional trajectory clustering by genotype. (S) Biological interpretation of movement clusters. (T) Normalized genotype distribution within each cluster. n = 12 mice for WT and n = 8 mice for KO. Data presented as means ± SEM. **P < 0.01, ***P < 0.001, ****P < 0.0001. Comparisons between two groups were performed using two-tailed Student's t-test or Mann-Whitney U test as appropriate. For analyses involving multiple comparisons (behavioral subtype proportions, transition probabilities, cluster composition, and genotype distribution across clusters), p values are nominal; significance was determined using the Benjamini-Hochberg FDR procedure with q < 0.05.


