


fig2
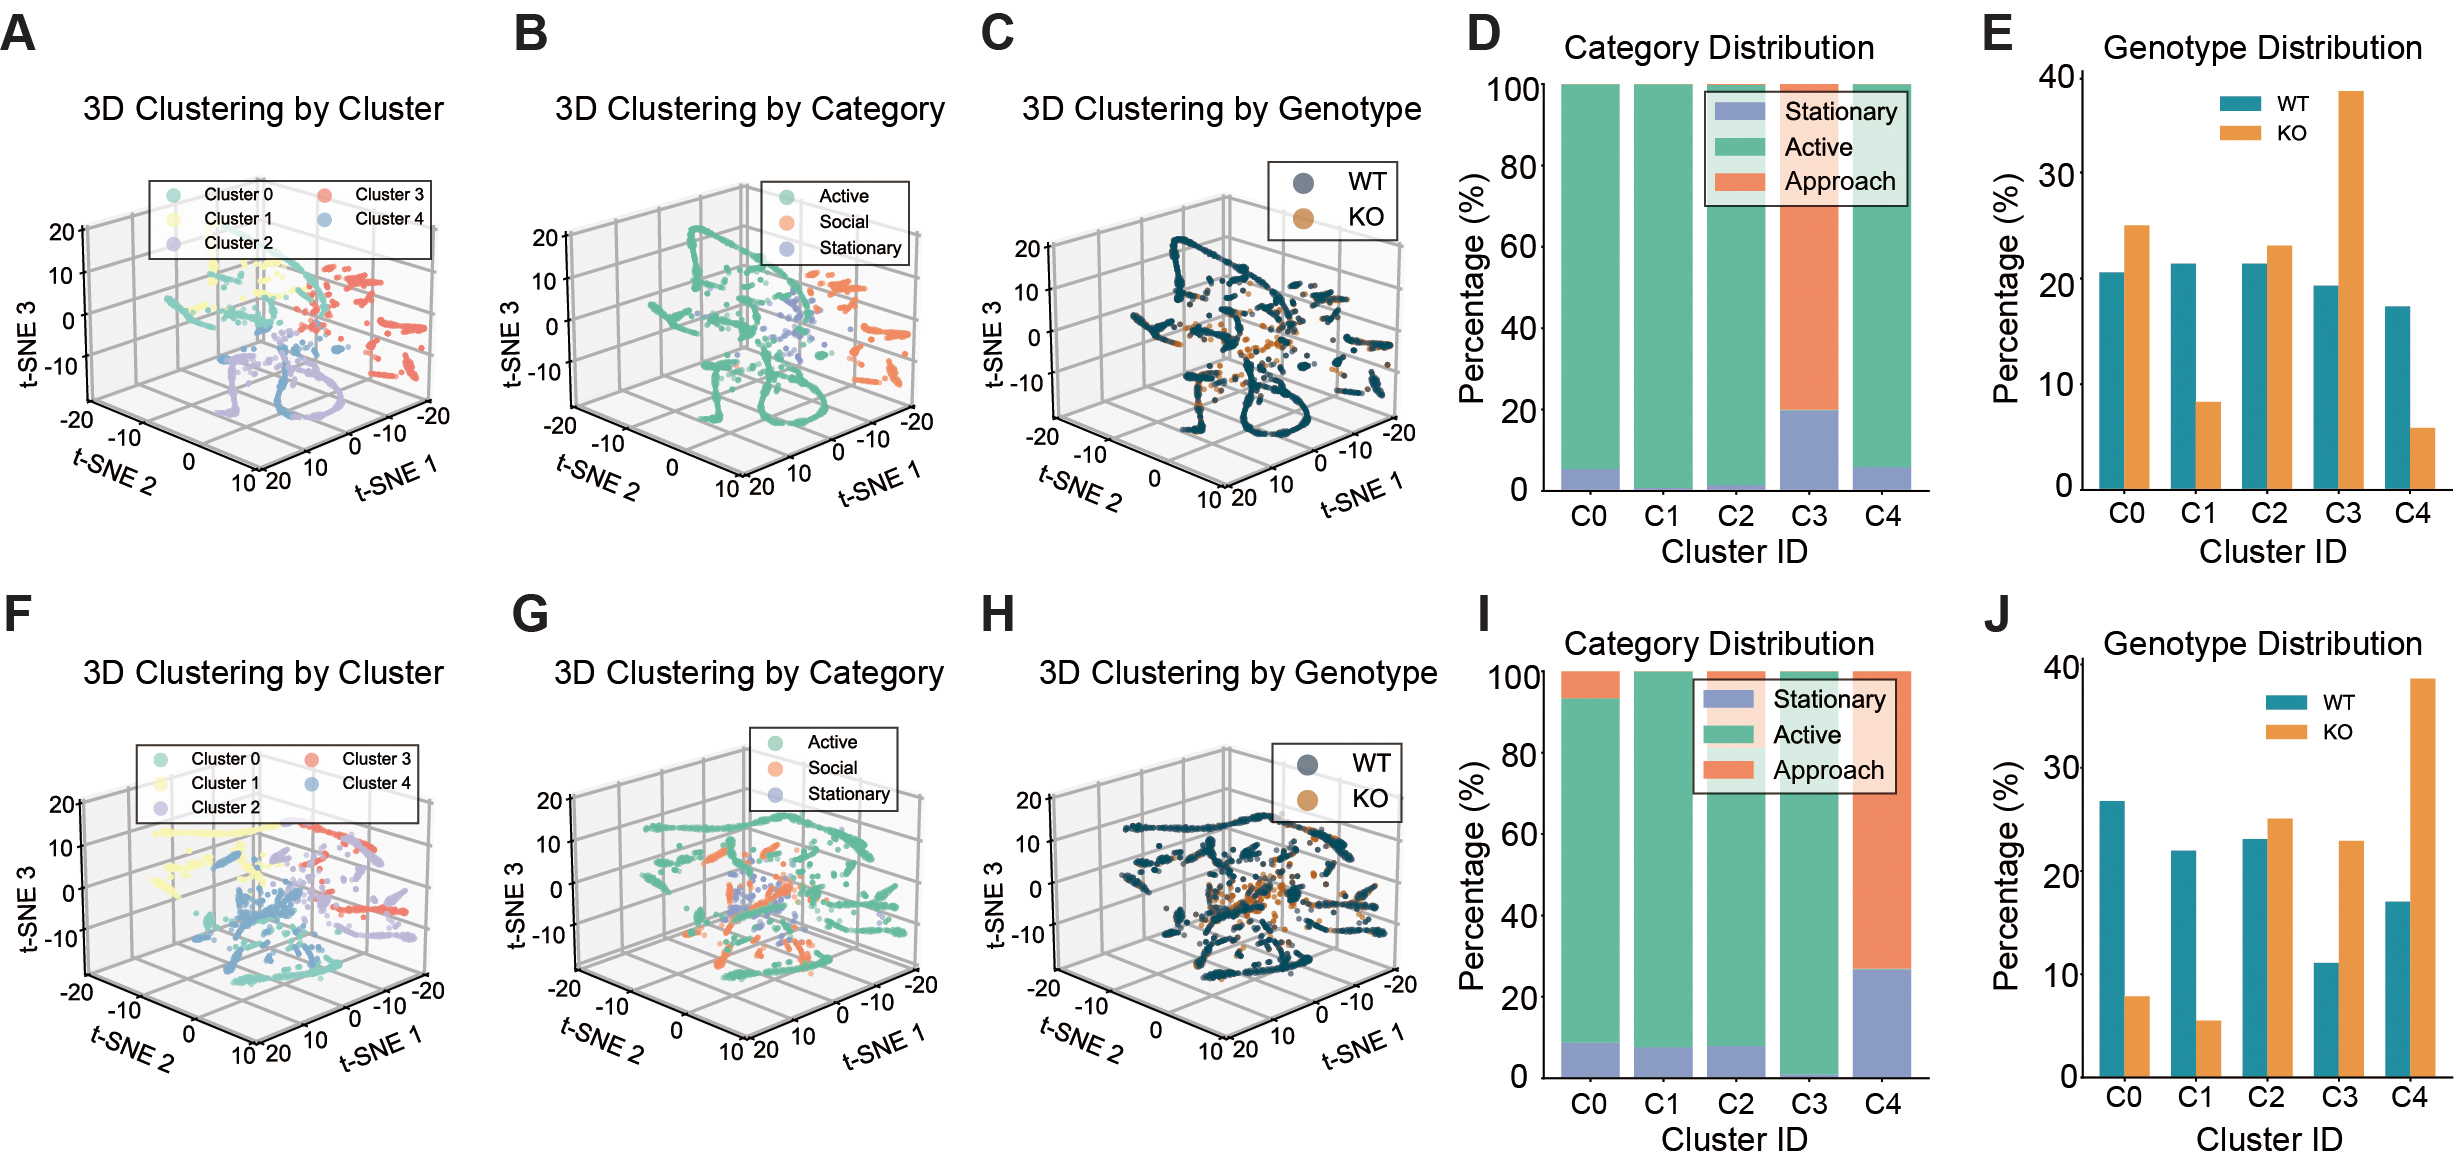
Figure 2. Latent behavioral clustering reveals genotype-specific social state organization in Shank3B KO mice. (A) 3D t-SNE clustering plot colored by cluster in Stage 1. (B) 3D t-SNE clustering plot colored by behaviors in Stage 1. (C) 3D t-SNE clustering plot colored by genotype in Stage 1. (D) Behavioral category distribution within clusters from Stage 1. (E) Genotype distribution across behavioral clusters from Stage 1. (F) 3D t-SNE clustering plot colored by cluster in Stage 2. (G) 3D t-SNE clustering plot colored by behaviors in stage 2. (H) 3D t-SNE clustering plot colored by genotype in stage 2. (I) Behavioral category distribution within clusters from stage 2. (J) Genotype distribution across behavioral clusters from stage 2. n = 12 mice for WT and n = 8 mice for KO. For analyses involving multiple comparisons (cluster composition and genotype distribution across clusters), p values are nominal; significance was determined using the Benjamini - Hochberg FDR procedure with q < 0.05.


