


fig5
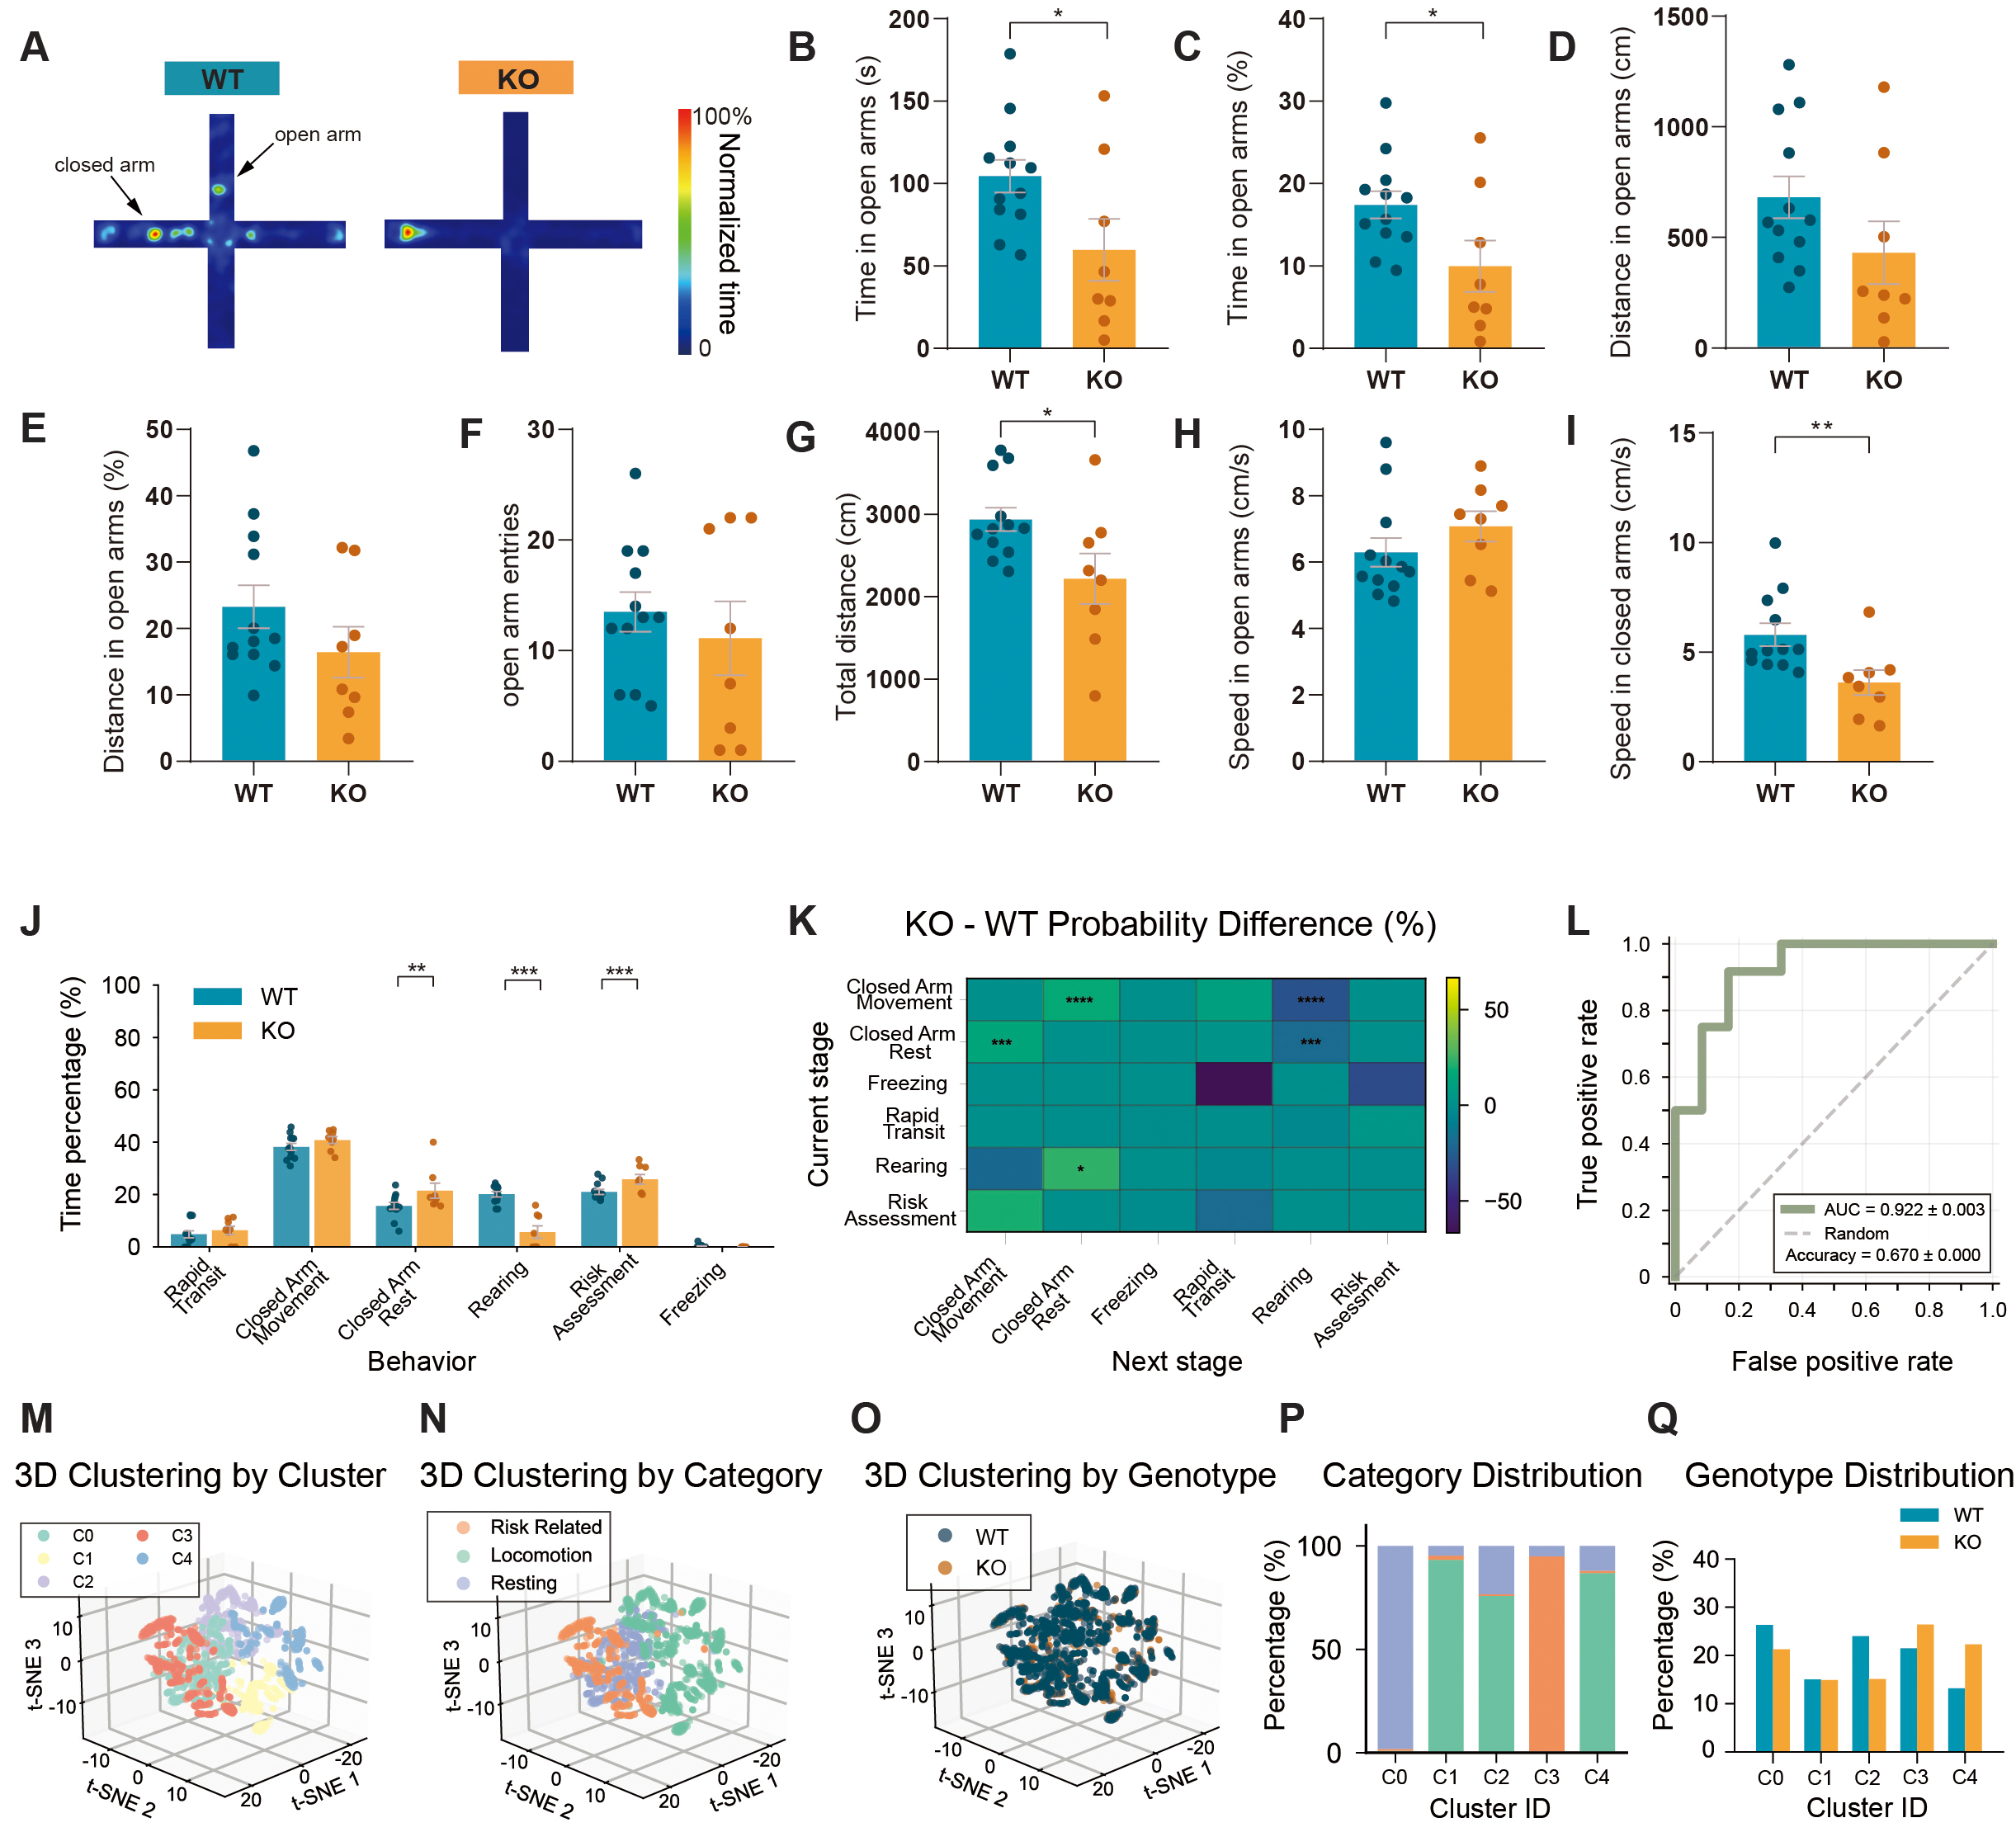
Figure 5. Enhanced risk-avoidant behavioral organization in Shank3B KO mice in the elevated plus maze test. (A) Heatmaps of movement trajectories in the elevated plus maze. (B) Time spent in open arms. (C) Percentage of time spent in open arms. (D) Distance traveled in open arms. (E) Percentage of distance traveled in open arms. (F) Entries in open arms. (G) Total distance traveled. (H) Speed in open arms. (I) Speed in closed arms. (J) Time allocation of behaviors in the elevated plus maze. (K) Difference matrix of behavioral transition probabilities between WT and KO mice. (L) ROC curve of SVM classifier based on behavioral events. (accuracy = 0.670 ± 0.000, AUC = 0.922 ± 0.003). (M) 3D t-SNE clustering plot colored by cluster. (N) 3D t-SNE clustering plot colored by behavioral category. (O) 3D t-SNE clustering plot colored by genotype. (P) Stacked bar chart showing the percentage of major behavioral categories in each cluster. (Q) Standardized comparison of WT and KO event distribution across clusters. n = 12 mice for WT and n = 8 mice for KO. Data presented as means ± SEM. *P < 0.05, **P < 0.01, ***P < 0.001, ****P < 0.0001. Comparisons between two groups were performed using two-tailed Student's t-test or Mann-Whitney U test as appropriate. For analyses involving multiple comparisons (behavioral subtype proportions, transition probabilities, cluster composition, and genotype distribution across clusters), p values are nominal; significance was determined using the Benjamini - Hochberg FDR procedure with q < 0.05.


