


Intelligent visualization-driven materials design via two-dimensional symbolic feature generation
 0
0 Abstract
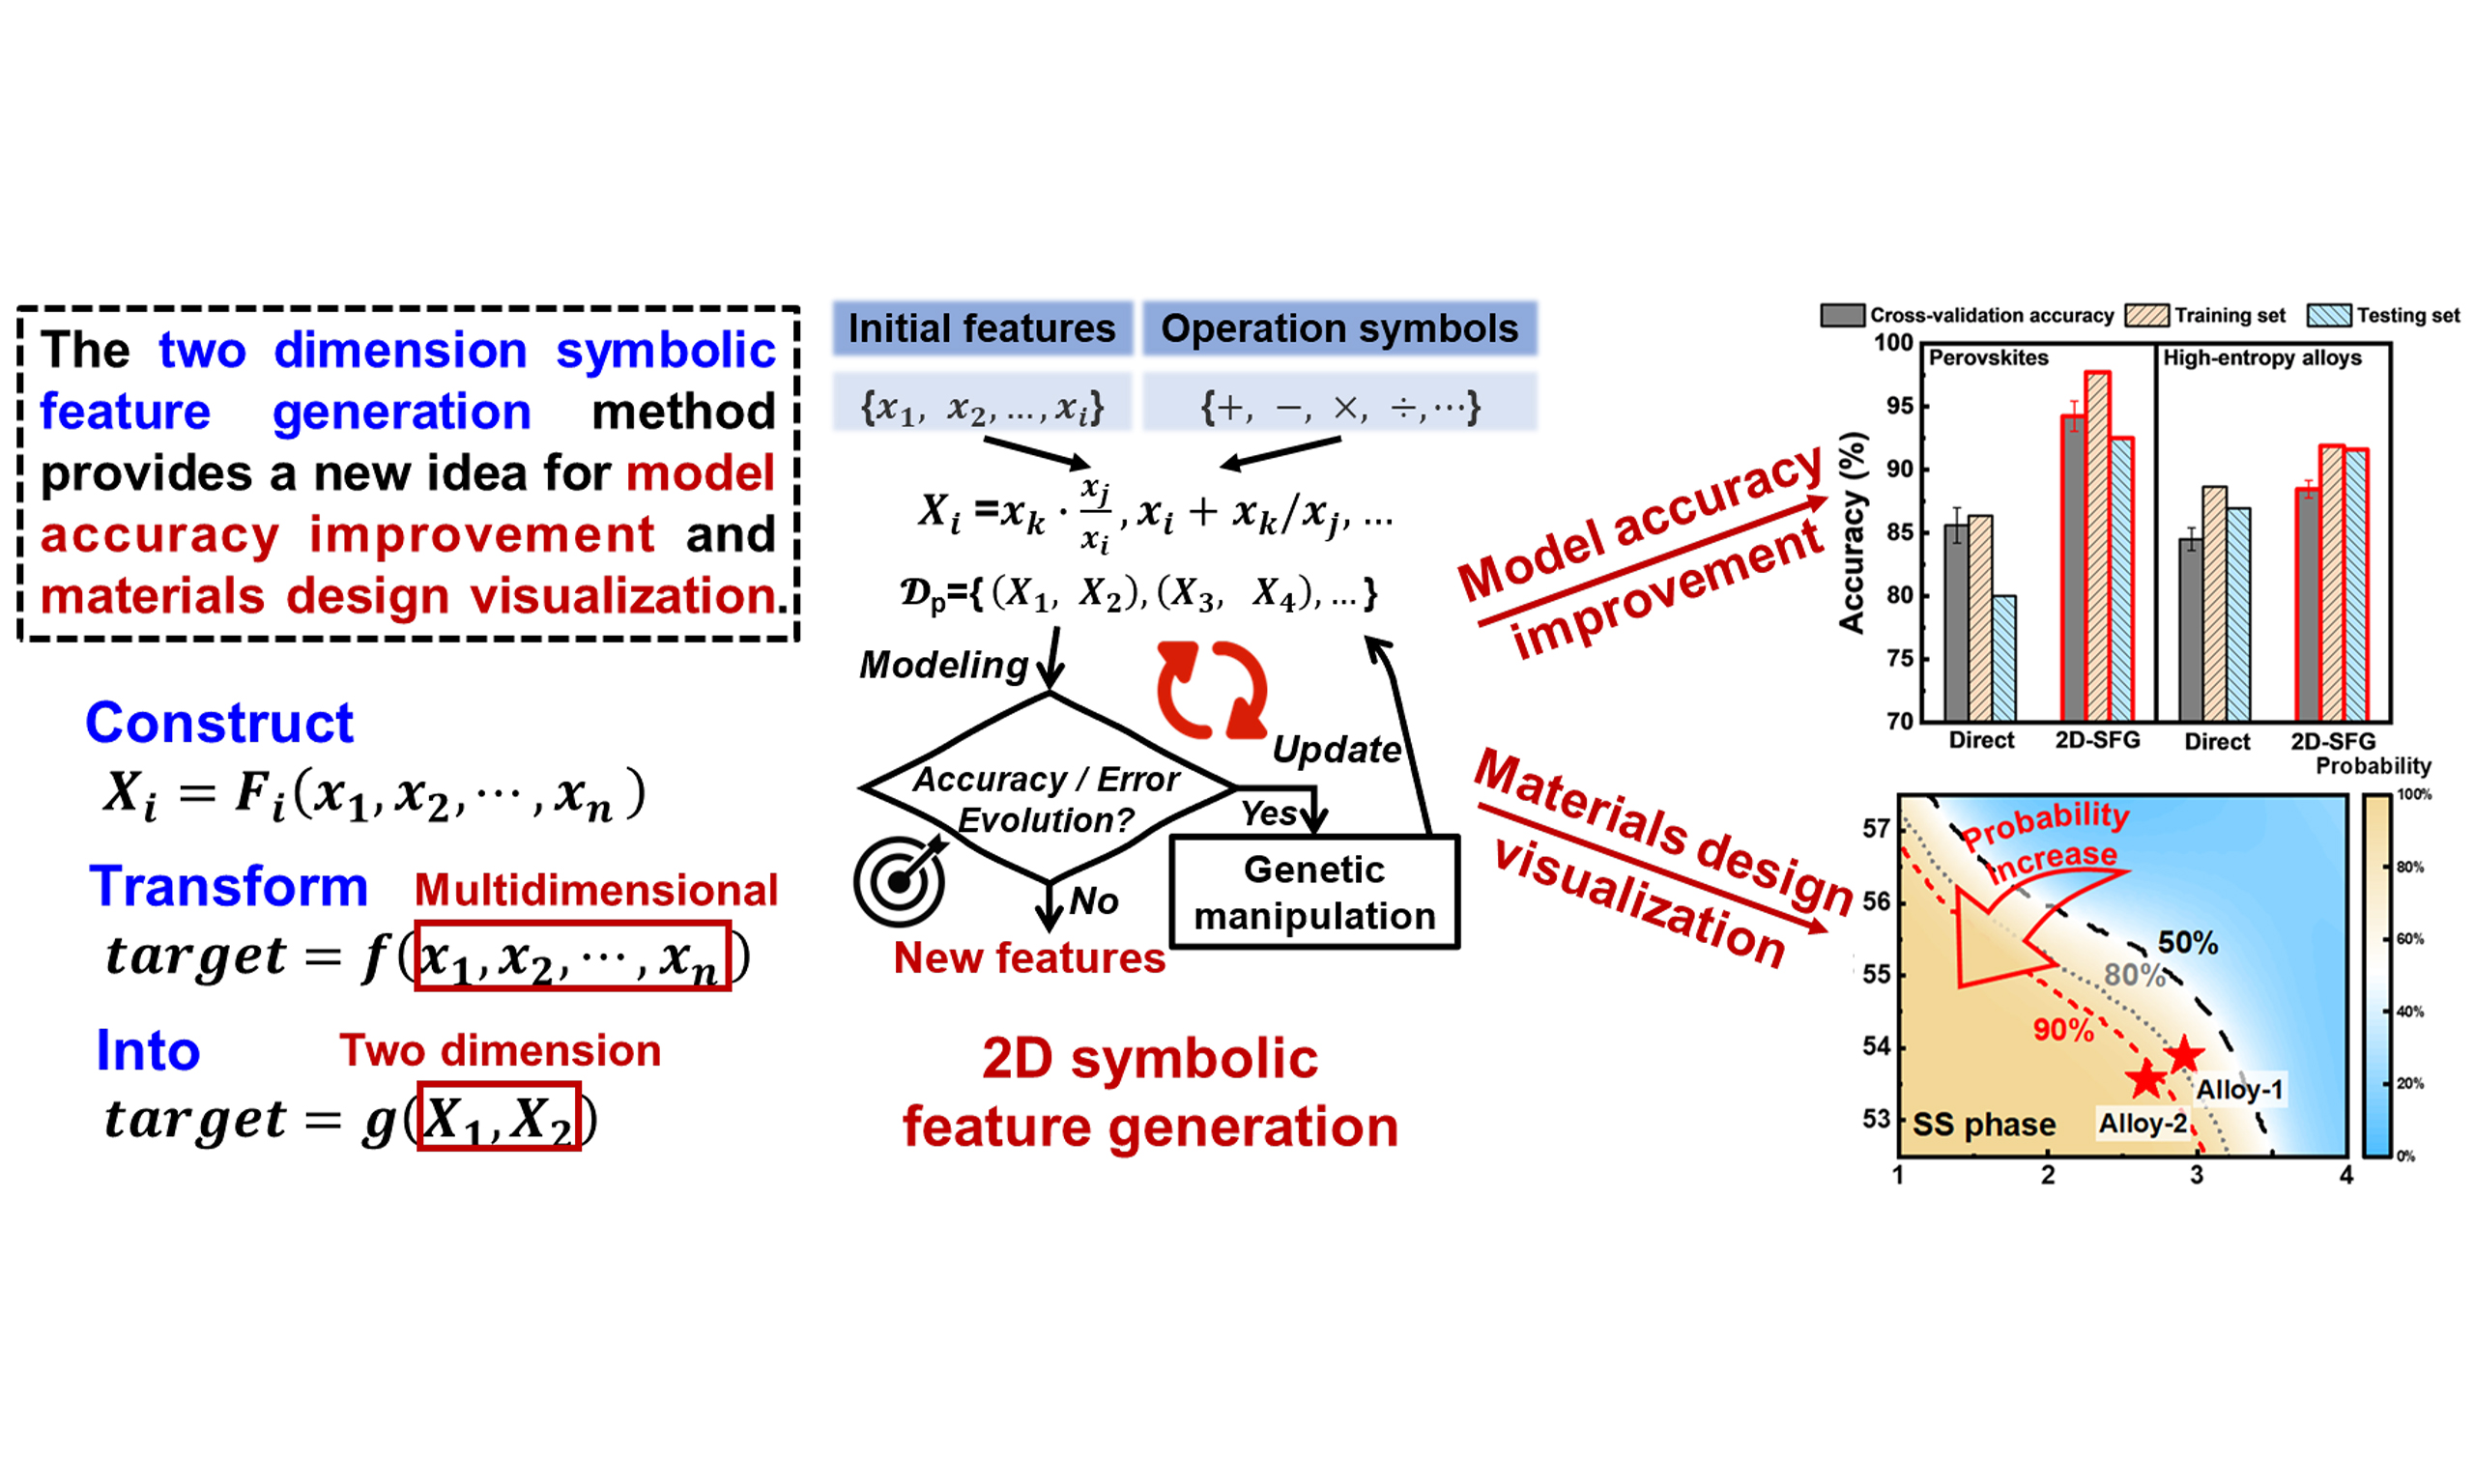
Machine learning (ML) for complex materials problems suffers from high-dimensional data, while traditional “black-box” dimensionality reduction techniques generally fail to balance predictive accuracy with visualization and interpretability. This work presents a novel method, named two-dimensional symbolic feature generation (2D-SFG), based on symbolic regression and genetic algorithms. This approach facilitates ML by providing quantifiable interpretability and enabling visualization-driven materials design. Evaluated across diverse classification and regression tasks in materials science, the proposed method demonstrates notable success in three critical aspects. First, it significantly improves predictive accuracy. Specifically, the classification accuracies for ferroelectric perovskites and high-entropy alloy (HEA) phases improved from 85.6% and 84.5% to 94.2% and 88.4%, respectively. Correspondingly, the prediction errors for shape memory alloys and copper alloys were reduced from 2.9 K, 5.9%, and 9.7% to 1.1 K, 3.7%, and 6.2%, respectively. Second, the method ensures interpretability by constructing explicit mathematical expressions that transform the original high-dimensional features into two new symbolic ones, avoiding opaque spatial transformations. Third, it enables model visualization through two-dimensional (2D) contour maps that relate the constructed features to the target properties, thereby offering intuitive insights into feature–property relationships. Leveraging these “design roadmaps”, a refractory HEA with a single-phase solid solution and a precipitation-strengthened copper alloy with an optimized property trade-off were successfully designed. The 2D symbolic feature generation framework thus addresses key limitations in accuracy, interpretability, and visualization within materials informatics, establishing a new paradigm for transparent and visual materials design.
Keywords
INTRODUCTION
In recent years, progress in artificial intelligence has empowered machine learning (ML) to achieve notable successes in materials development[1-6]. ML techniques have been effectively employed in composition design, process optimization, and property prediction across a variety of material systems, such as copper alloys[7-11], high-entropy alloys (HEAs)[12-16], superalloys[17-21], steels[22-25], and ferroelectric materials[26-30], thereby pioneering a new paradigm for accelerated materials research and development.
However, the pursuit of higher predictive accuracy in materials informatics is paradoxically leading to increasingly complex and large-scale models. Representative approaches, such as large language models[31-34] and deep reinforcement learning[6,21,35-37], excel in composition design and property prediction. However, their massive parameters and multi-layer nonlinear transformations render them inherently uninterpretable “black boxes”. Consequently, these models operate via end-to-end input–output mappings without offering navigable guidance for materials design, effectively forcing blind exploration in high-dimensional spaces and thereby limiting both interpretability and the extraction of reusable design routes.
To address the interpretability issues of complex models, mainstream analytical methods such as SHapley Additive exPlanations (SHAP)[38] and Local Interpretable Model-agnostic Explanations (LIME)[39] are commonly employed to evaluate feature importance. Alibagheri et al. developed a predictive model connecting electronic structure features to formation energy and subsequently applied SHAP analysis to rank feature contributions, revealing a negative correlation between average ionic charge and formation energy[40]. Similarly, Xu et al. employed SHAP to evaluate the influence of elemental composition and heat treatment parameters on the γ′ depletion zone thickness, providing valuable insights into thermal barrier coating bond coat design[41]. However, such post hoc interpretation techniques only yield qualitative rankings that lack physical grounding. They fail to establish quantitative mappings between physicochemical features and material properties, thus falling short of offering deep physical interpretability.
To extract and reuse design pathways from complex models, projection-based dimensionality reduction techniques are commonly applied to visualize feature–property relationships in two-dimensional (2D) space. Chen et al. used principal component analysis (PCA)[43] to project multiple variables into a 2D space, successfully visualizing the stability boundary of the solid-solution phase in a five-component HEA system[42]. Their analysis identified melting point and mixing enthalpy as the primary factors determining phase stability. Srinivasan et al. employed the Isomap algorithm[45] to map high-dimensional descriptors of the Co3(Al, X) system into a low-dimensional space, generating a 2D point-line graph where elements were represented as nodes and descriptor similarities as edges[44]. This approach enabled the intuitive identification of candidate compositions with high binding energy, high melting point, and coherence with the Co-rich face-centered cubic matrix. Tian et al. applied uniform manifold approximation and projection (UMAP)[46] to reduce the 768-dimensional vectors from the steel-specialized large language model (SteelBERT) into a 2D space while preserving local topological structures[32]. The resulting “knowledge map of steel” was distinguished by keywords such as fatigue, irradiation, and welding, which intuitively revealed latent research hotspots and trends within the literature. These methods share the common objective of mapping high-dimensional data into a 2D space to generate clear and intuitive visualizations that facilitate the analysis and structural understanding of complex data. However, the relationships between the reduced-dimensional features and the original features remain obscure, making it impossible to analyze how dimensionality reduction influences feature representation and material properties.
In summary, current approaches still exhibit significant limitations in providing model interpretability and the visualization of materials design. Previous studies have shown that algorithms such as symbolic regression and linear regression can establish explicit mathematical expressions linking material features to properties, presenting a viable path to overcome these shortcomings. Zhao et al. employed symbolic regression to establish an explicit mathematical expression linking alloy composition and thermal conditions to high-temperature specific yield strength, providing a closed-loop framework for the inverse design of refractory HEAs[47]. Xue et al. successfully developed a simple and interpretable polynomial regression expression relating the phase transformation temperature of NiTi-based shape memory alloys to crystal structure parameters[48]. Such approaches extract compact and physically informative expressions from materials data to guide design. However, their predictive accuracy is limited due to the oversimplification inherent in representing material behavior with only a small set of features.
To address these challenges, this work proposes a novel two-dimensional symbolic feature generation (2D-SFG) method via genetic programming-based symbolic regression, enabling visual and interpretable materials design. By combining original features with mathematical operators, 2D-SFG constructs explicit mathematical expressions as new features, which are then used to generate 2D classification probability maps or property contour plots. This framework supports efficient and intuitive materials design. When applied to various classification and regression tasks, the proposed method simultaneously improves predictive accuracy, enhances interpretability, and enables design visualization, thereby establishing a new strategy for interpretable and visual materials design.
MATERIALS AND METHODS
This work introduces a novel feature construction methodology designed to simultaneously enhance the predictive performance of ML models and provide explicit, interpretable feature representations. Mathematically, for a given ML problem formulated as target = f (x1, x2, …, xn), two new features are generated through symbolic regression: X1 = F1 (x1, x2, …, xn) and X2 = F2 (x1, x2, …, xn). This transforms the original modeling task into target = g (X1, X2), with the key constraint that the model based on these constructed features achieves superior accuracy or lower error compared to the initial model. Notably, F1 and F2 represent explicit mathematical relationships rather than uninterpretable black-box models. The overall workflow is illustrated in Figure 1.
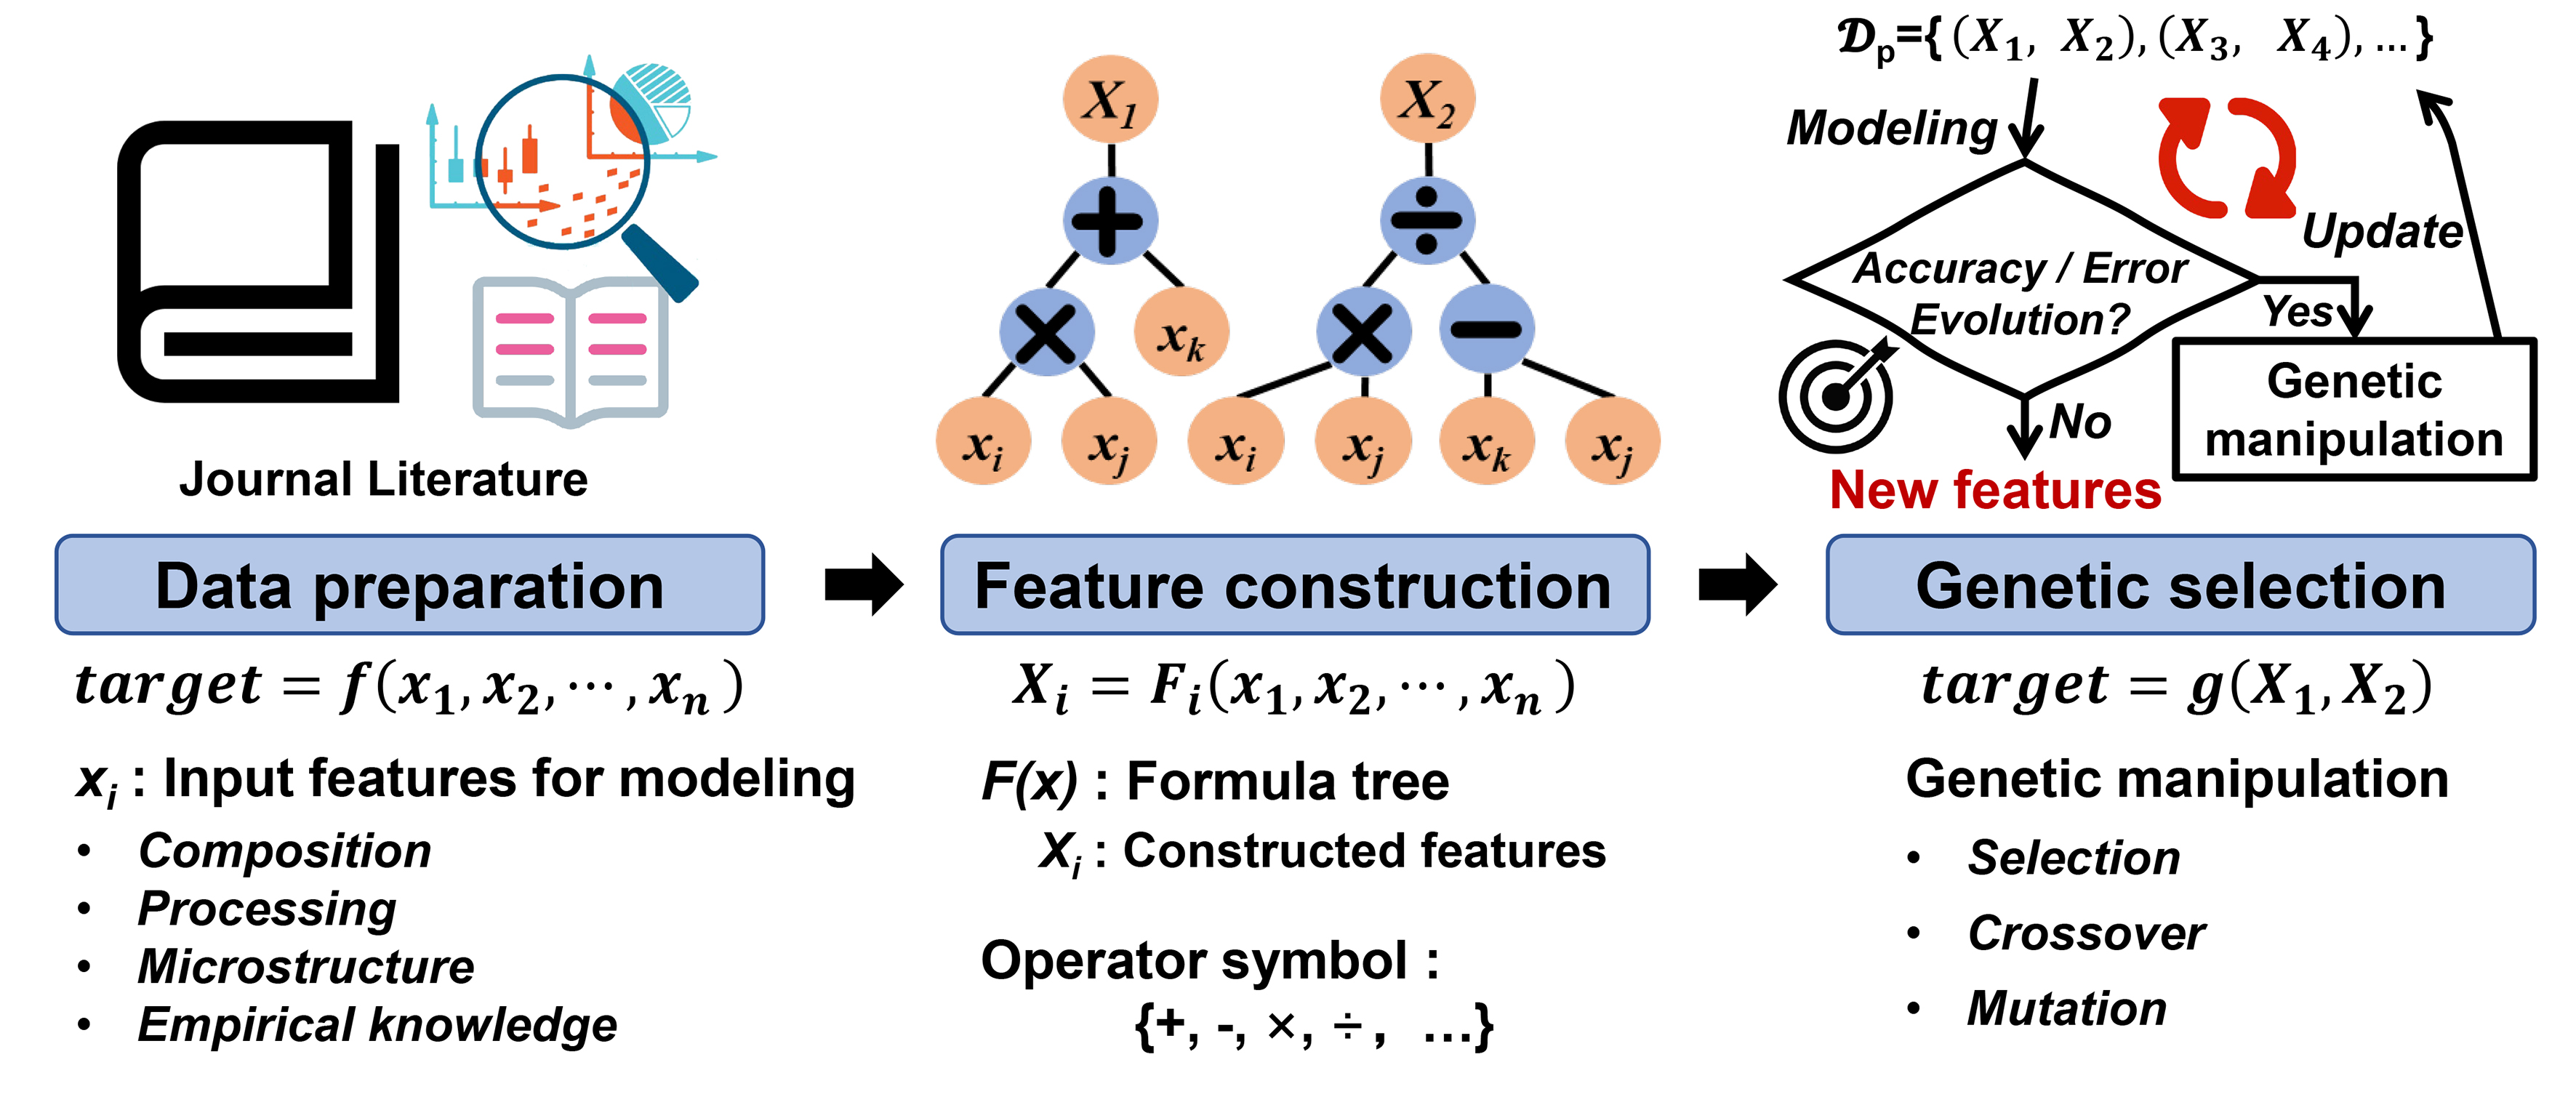
Figure 1. 2D-SFG method. A novel feature construction strategy combining symbolic regression and genetic algorithms for 2D symbolic features. 2D-SFG: Two-dimensional symbolic feature generation; 2D: two-dimensional.
First, features relevant to the modeling problem, such as composition, processing conditions, microstructure, and empirical knowledge, were collected to form an initial feature set. It is noteworthy that this set may comprise either raw, unscreened features or a pre-selected subset of key attributes identified in earlier research. Symbolic regression was then applied to construct new features in the form of explicit mathematical expression trees derived from the original features. This construction process constitutes the core of the proposed methodology, aiming to synthesize critical information from the initial feature set through interpretable mathematical expressions while eliminating redundancy and irrelevant details.
However, since feature construction typically explores an expansive combinatorial space, an exhaustive search over all possible expressions is computationally infeasible. Therefore, an evolutionary optimization approach was introduced to address this issue. Newly constructed features were paired to form a “feature-pair set”, with the population size set to 500. Each feature pair served as the input for model training, and the resulting model was evaluated based on a fitness metric (e.g., accuracy or error) to retain high-performing feature pairs. Subsequently, crossover and mutation operations were applied to generate new feature-pair sets over 100 generations, progressively improving feature quality and model performance. In the Genetic Algorithm, Accuracy served as the fitness function for classification tasks, while mean absolute percentage error or root mean square error (RMSE) was employed for regression tasks. Concurrently, a hard constraint limiting the maximum number of nodes to fewer than 17 was imposed to balance model accuracy and formula interpretability. The pseudocode of the proposed 2D-SFG method is summarized in Table 1.
Pseudocode of the 2D-SFG method
| Step | Methods |
| 1 | Let |
| 2 | Generate N formula trees {X} with elements randomly selected from the two sets in Step 1, e.g., X = xixk - xj, xi/xj, … |
| 3 | A set of feature pairs, denoted as |
| 4 | For each pair in |
| 5 | If the stopping condition is not met: Update the formula trees by genetic algorithm operations (Selection, Crossover, Mutation). Repeat from Step 4. |
| Otherwise : Return the optimal feature pair. | |
| End |
To mitigate symbolic overfitting and expression bloat, the following control mechanisms were implemented:
• Operator & Constant Restrictions: The search space was limited to the basic arithmetic operators {+, -, ×, /} and a fixed set of constants {0, 1, 2}. This avoids the complexity of optimizing floating-point coefficients and ensures analytical simplicity.
• Structural Hard Constraints: A strict maximum limit of 17 nodes per symbolic tree was enforced. Any genetic operation violating this constraint was rejected.
• No Explicit Penalties or Pruning: Unlike methods using description length penalties, the present approach relies on hard constraints to naturally limit complexity. Additionally, redundant sub-expressions (e.g., x+0) were simplified during generation, eliminating the need for post hoc pruning.
• Numerical Stability: Protected division was employed to handle near-zero denominators, preventing numerical errors during fitness evaluation.
• Dimensional Flexibility: No strict dimensional consistency was enforced, allowing the discovery of empirical dimensionless groups common in materials science.
• Independent Test Set: A completely independent test set was established. The discrepancy in predictive performance between the training and test sets was utilized to evaluate the risk of overfitting.
RESULTS AND DISCUSSION
Material visualization classification model
Feature dimensionality reduction techniques are commonly employed to map high-dimensional data into a lower-dimensional space for more intuitive visualization of sample distributions across classes in classification tasks, such as PCA. These methods primarily retain directions of maximum variance to highlight inter-class differences. However, high variance does not necessarily correspond to discriminative or physically meaningful information. For instance, noise may exhibit greater variance than critical target features. In such cases, reducing the input dimensionality can lead to the loss of important information, thereby damaging the classification performance of the model[49]. The proposed 2D-SFG method not only reduces the input dimensionality by constructing new features but also incorporates nonlinear combinations among features, thereby effectively preserving critical information from the original data while enhancing model visualization and improving predictive accuracy. To evaluate its effectiveness, we compared its performance with existing results in perovskite structural categorization and HEA phase classification, as reported in high-impact journals including Nature Communications and Acta Materialia.
Balachandran et al. developed a support vector machine-based binary classification model using a dataset of 167 perovskite structures and five input features, achieving an average accuracy of 85.6%[30]. Based on HEA data gathered from references[50-52], a phase classification model was built using ten influential features selected via a feature screening method, resulting in a prediction accuracy of 84.5%. The material features employed in the two classification tasks are presented in Table 2. Comprehensive details can be found in the Supplementary Materials.
Features used in classification tasks
| Task | Features | |
| Perovskites | f 0 : Tolerance factor | f 1 : Valence electron number |
| f 2 : Martynov-Batsanov electronegativity | f 3 : Ideal bond length | |
| f 4 : Mendeleev number | ||
| HEAs | ΔHmix: Mixing enthalpy | Xc : Chemical bond mismatch |
| δCE : Cohesive energy deviation | ||
| δMR : Metal radius deviation | ||
| δAV : Atomic volume deviation | ||
Figure 2A and B illustrate the iterative feature generation process for the two classification cases. As the iterations proceed, the model accuracy gradually increases until it converges to a stable value. This trend indicates that the two new features generated by the 2D-SFG method incorporate more meaningful information to improve model performance. The explicit mathematical relationships of the evolved features after 100 iterations are shown in Equations (1) to (4).
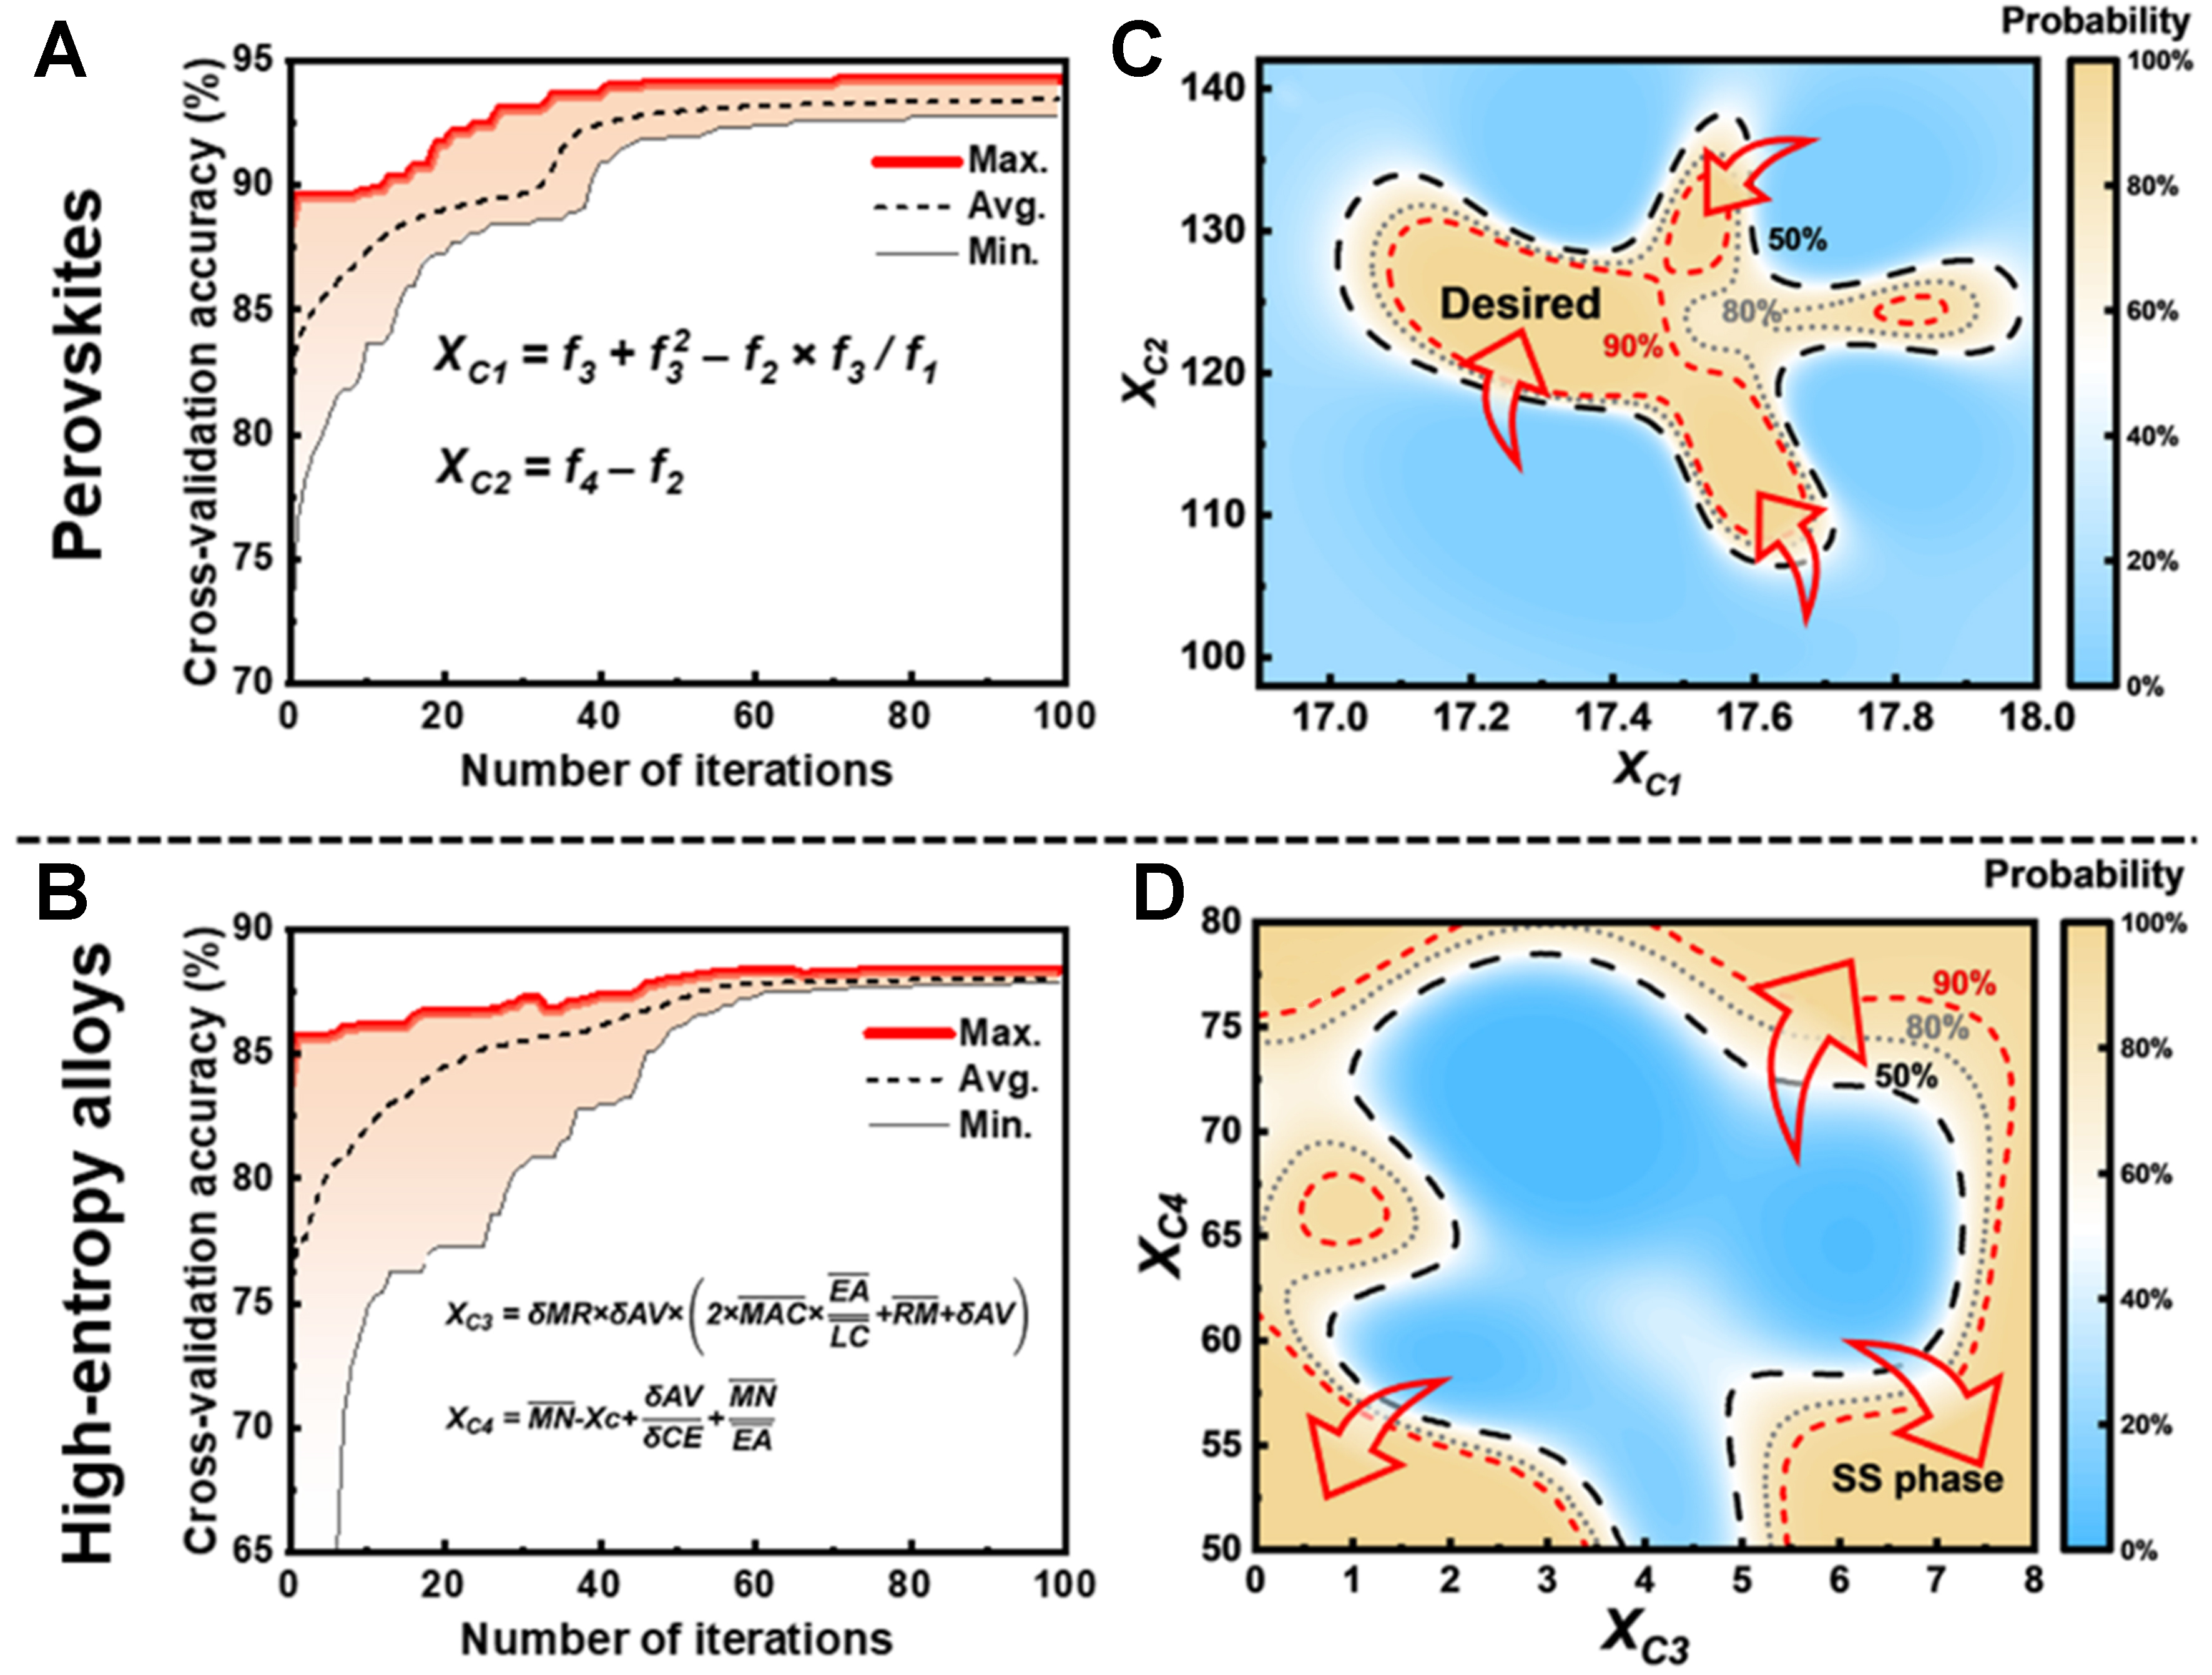
Figure 2. Application of the 2D-SFG method to classification tasks. (A and B) Iterative feature generation process; the red curve indicates the variation in optimal performance within the population; (C and D) Classification probability maps; the red arrows indicate the direction of increasing probability for the target property. 2D-SFG: Two-dimensional symbolic feature generation.
Perovskites:
HEAs:
where XC1, XC2, XC3, and XC4 denote the constructed symbolic features. Definitions of all other parameters are provided in Table 2.
A support vector classifier was established using the constructed features, and the corresponding classification probability maps are shown in Figure 2C and D. On the one hand, these maps provide an intuitive representation of the ML model, in which the red arrows indicate the direction of increasing probability for the target property, forming a “navigation map” for alloy design. Based on the value range associated with the positive class, the compositional design window for ferroelectric perovskites without secondary phases and single solid-solution HEAs can be determined through either forward screening or inverse calculation. On the other hand, underlying patterns in the data can be revealed by analyzing the influence of the constructed features on the target property, particularly the transition boundaries. This approach offers possibilities for extracting physical interpretability and discovering new knowledge.
Material visualization regression model
In regression tasks, the “curse of dimensionality” also poses a significant challenge. Although reducing the dimensionality of input variables can visualize the relationship between inputs and outputs, it is impossible to obtain the relationship between features before and after dimensionality reduction. The proposed 2D-SFG method can not only preserve meaningful information and eliminate redundancies during dimensionality reduction, but also provide explicit mathematical expressions that clarify the connections between the original and transformed features, as well as their influence on material properties. This approach significantly enhances model interpretability and offers valuable support for in-depth investigations into how key features affect performance mechanisms in materials science. To further assess the effectiveness of our approach, we selected studies on ML-assisted alloy design published in high-impact journals, including Nature Communications and Acta Materialia, for comparative validation.
Xue et al. established a support vector regression prediction model using six input features to design NiTi-based shape memory alloys with low thermal hysteresis, achieving a prediction error of 2.9 K[53]. The authors[9] aimed to optimize both hardness and electrical conductivity in precipitation-strengthened copper alloys. Five key features influencing alloy hardness and six features affecting electrical conductivity were identified through feature selection. By constructing corresponding support vector regression prediction models, prediction errors of 5.9% and 9.7% were achieved, respectively. The material features used in these two regression tasks are summarized in Table 3, with additional details provided in the Supplementary Materials.
Features used in regression tasks
| Task | Features | |
| Thermal hysteresis | en : Pauling electronegativity | cs : Pettifor chemical scale |
| ven : Valence electron number | arc : Clementi’s atomic radii | |
| dor : Waber-Cromer pseudopotential radii | mr : Metallic radius | |
| Vickers hardness | M.S3 : Covalent radii | M.S12 : Lattice constant c |
| V.A8 : Mass attenuation coefficient variance | V.S7 : Atom volume variance | |
| O12 : Solubility at room temperature | ||
| Electrical conductivity | M.A10 : Mass attenuation coefficient | M.S6 : Core electron distance |
| M.E4 : Absolute electronegativity | V.E6 : Second ionization energy | |
| M.C4 : Melting enthalpy | HV : Vickers hardness | |
Figure 3A-C illustrates the iterative feature generation process for the two regression cases. As the number of genetic iterations increases, the 10-fold cross-validation error progressively decreases, indicating that the two constructed features incorporate increasingly meaningful information and thereby contribute to model improvement. Notably, the error for the hardness regression task continued to decrease beyond 100 iterations. However, further increasing generations resulted in overly complex expressions. This finding reflects the need for more sophisticated mathematical representations to accurately model the underlying strengthening mechanisms and integrate the substantial information embedded within the original features. To balance model accuracy and expression complexity, the evolutionary process was terminated after 100 generations. The final mathematical expressions of the evolved features after 100 generations are provided in Equations (5) to (10).
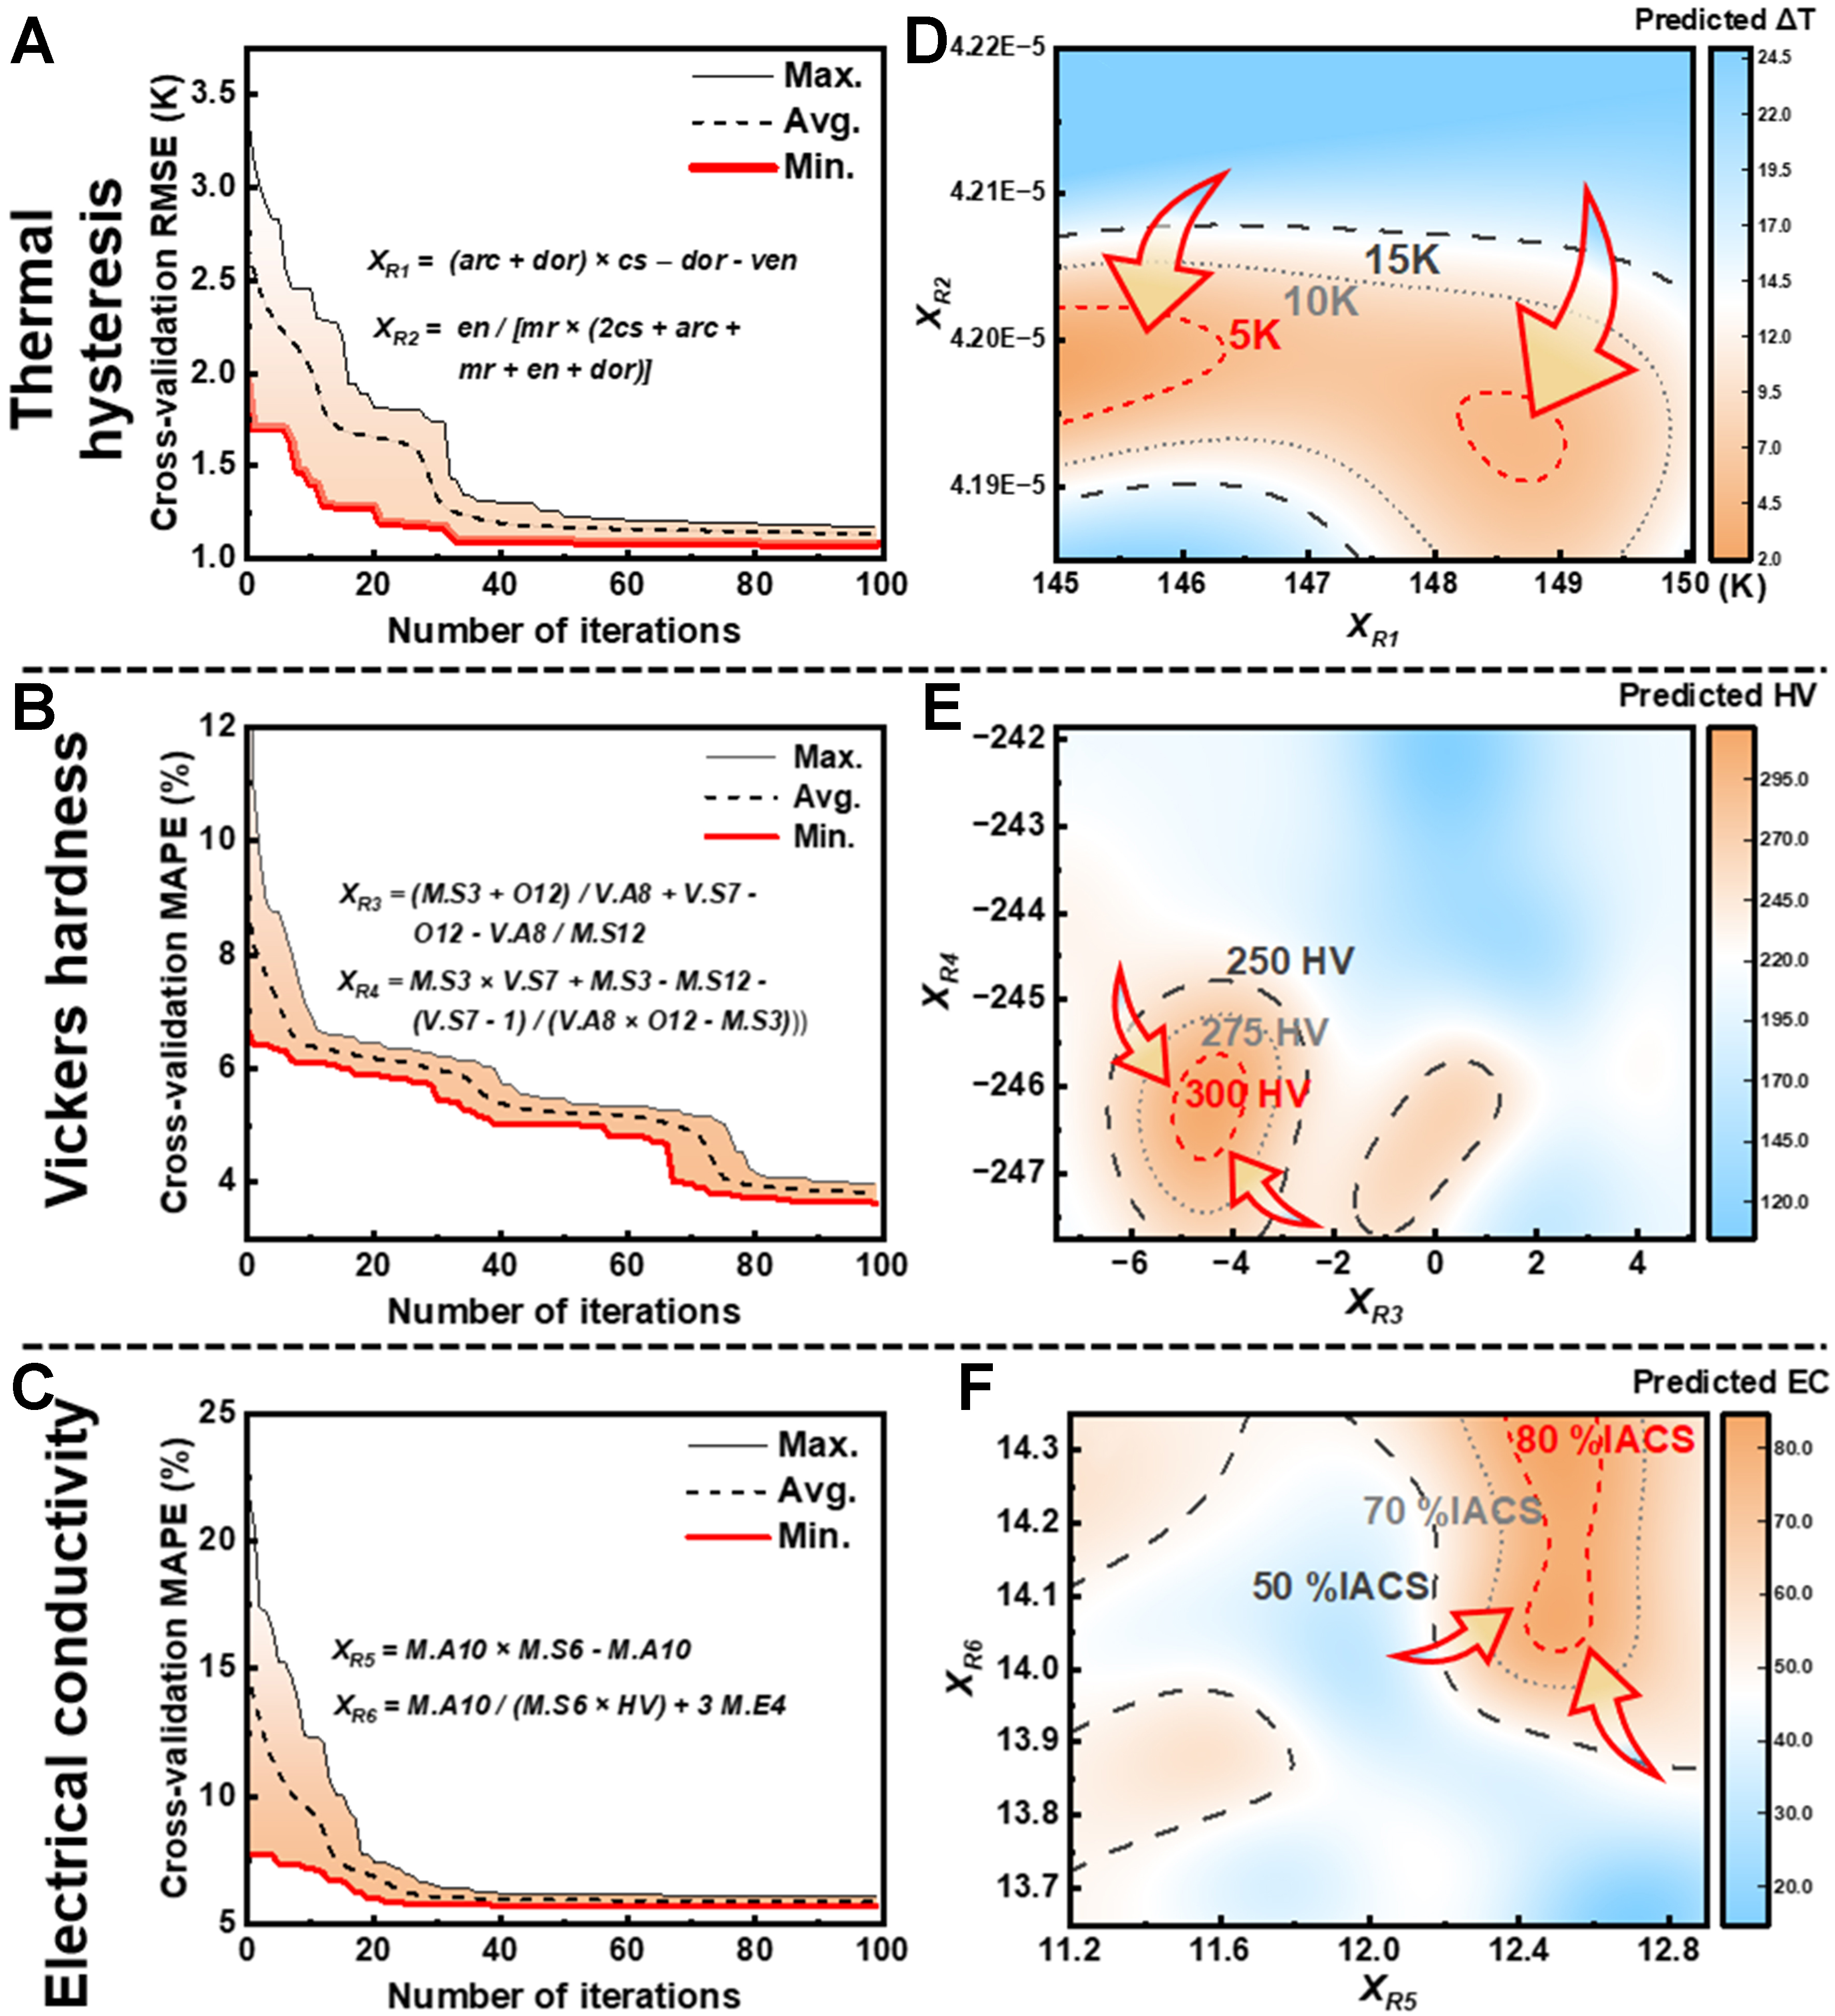
Figure 3. Application of the 2D-SFG method to regression tasks. (A-C) Iterative feature generation process; the red curve indicates the vibration in optimal performance within the population; (D-F) Contour maps of alloy properties; the red arrows indicate the gradient variation of the target property. 2D-SFG: Two-dimensional symbolic feature generation; RMSE: root mean square error; MAPE: mean absolute percentage error.
ΔT:
HV:
EC:
where XR1, XR2, XR3, XR4, XR5, and XR6 denote the constructed symbolic features. Definitions of all other parameters can be found in Table 3.
Support vector regression models were established using the constructed features as input to predict alloy properties across different values, as visualized in Figure 3D-F. The red arrows in each contour plot indicate the gradient variation of the target property, serving as guidance for efficiently approaching the desired property objectives. For instance, thermal hysteresis is minimized when features XR1 and XR2 approach around 145 and 4.2 × 10⁻⁵, respectively. Accordingly, NiTi-based shape memory alloys with low thermal hysteresis can be designed by forward screening or inverse calculation of compositions that satisfy this specific feature range. Similarly, higher alloy hardness is achieved near XR3 ≈ -4 and XR4 ≈ -246, while superior electrical conductivity is attained around XR5 ≈ 12.5 and XR6 ≈ 14.2. These identified value ranges offer practical and interpretable design guidelines for developing copper alloys with an improved balance between hardness and electrical conductivity.
Intelligent visualization-driven materials design
As illustrated in Figures 2 and 3, the 2D-SFG method effectively visualizes phase boundaries and property contours, enabling intuitive identification of target regions and variation trends. A direct correspondence between composition design windows and target properties was established by mapping candidate alloy compositions into 2D symbolic features. In this work, we employed the 2D-SFG method to construct visualization models that can compute symbolic features for unknown alloy compositions. These models were subsequently used to evaluate and predict target properties, successfully screening refractory HEAs with single solid-solution phases, as well as advanced copper alloy compositions with superior performance. In the V-Nb-Ti-W-Zr-Mo-Hf-Ta HEA system, a genetic algorithm was used to define a composition space with 1 at.% increments. The ten-dimensional features listed in Table 2 were computed for each composition and projected into a 2D visualization space using Equations (3) and (4), thereby identifying candidate compositions with a high probability of forming solid-solution phases, as summarized in Table 4.
Composition of HEAs
| Alloy (at.%) | V | Nb | Ti | W | Zr | Mo | Hf | Ta |
| HEA-1 | 30 | 29 | 8 | 12 | 10 | 9 | 1 | 1 |
| HEA-2 | 30 | 27 | 18 | 13 | 10 | 1 | 1 | 0 |
Figure 4A displays the classification probability and evolutionary path of alloys across two generations, showing a clear design pathway toward higher solid-solution probability. The selected alloys were synthesized using vacuum arc melting and characterized by X-ray diffraction (XRD). As shown in Figure 4B, all as-cast alloys exhibit a single body-centered cubic (BCC) solid-solution phase, consistent with the predictions of the 2D-SFG method. Figure 4C compares the predictions of different visualization modeling approaches. While most methods struggle to accurately identify the phase structures of alloys with low solid-solution probabilities, as shown in Figure 4A, only the 2D-SFG method correctly predicts the phase structures of both alloys. These results underscore the strong generalization capability and classification accuracy of the proposed approach for phase identification in HEAs.
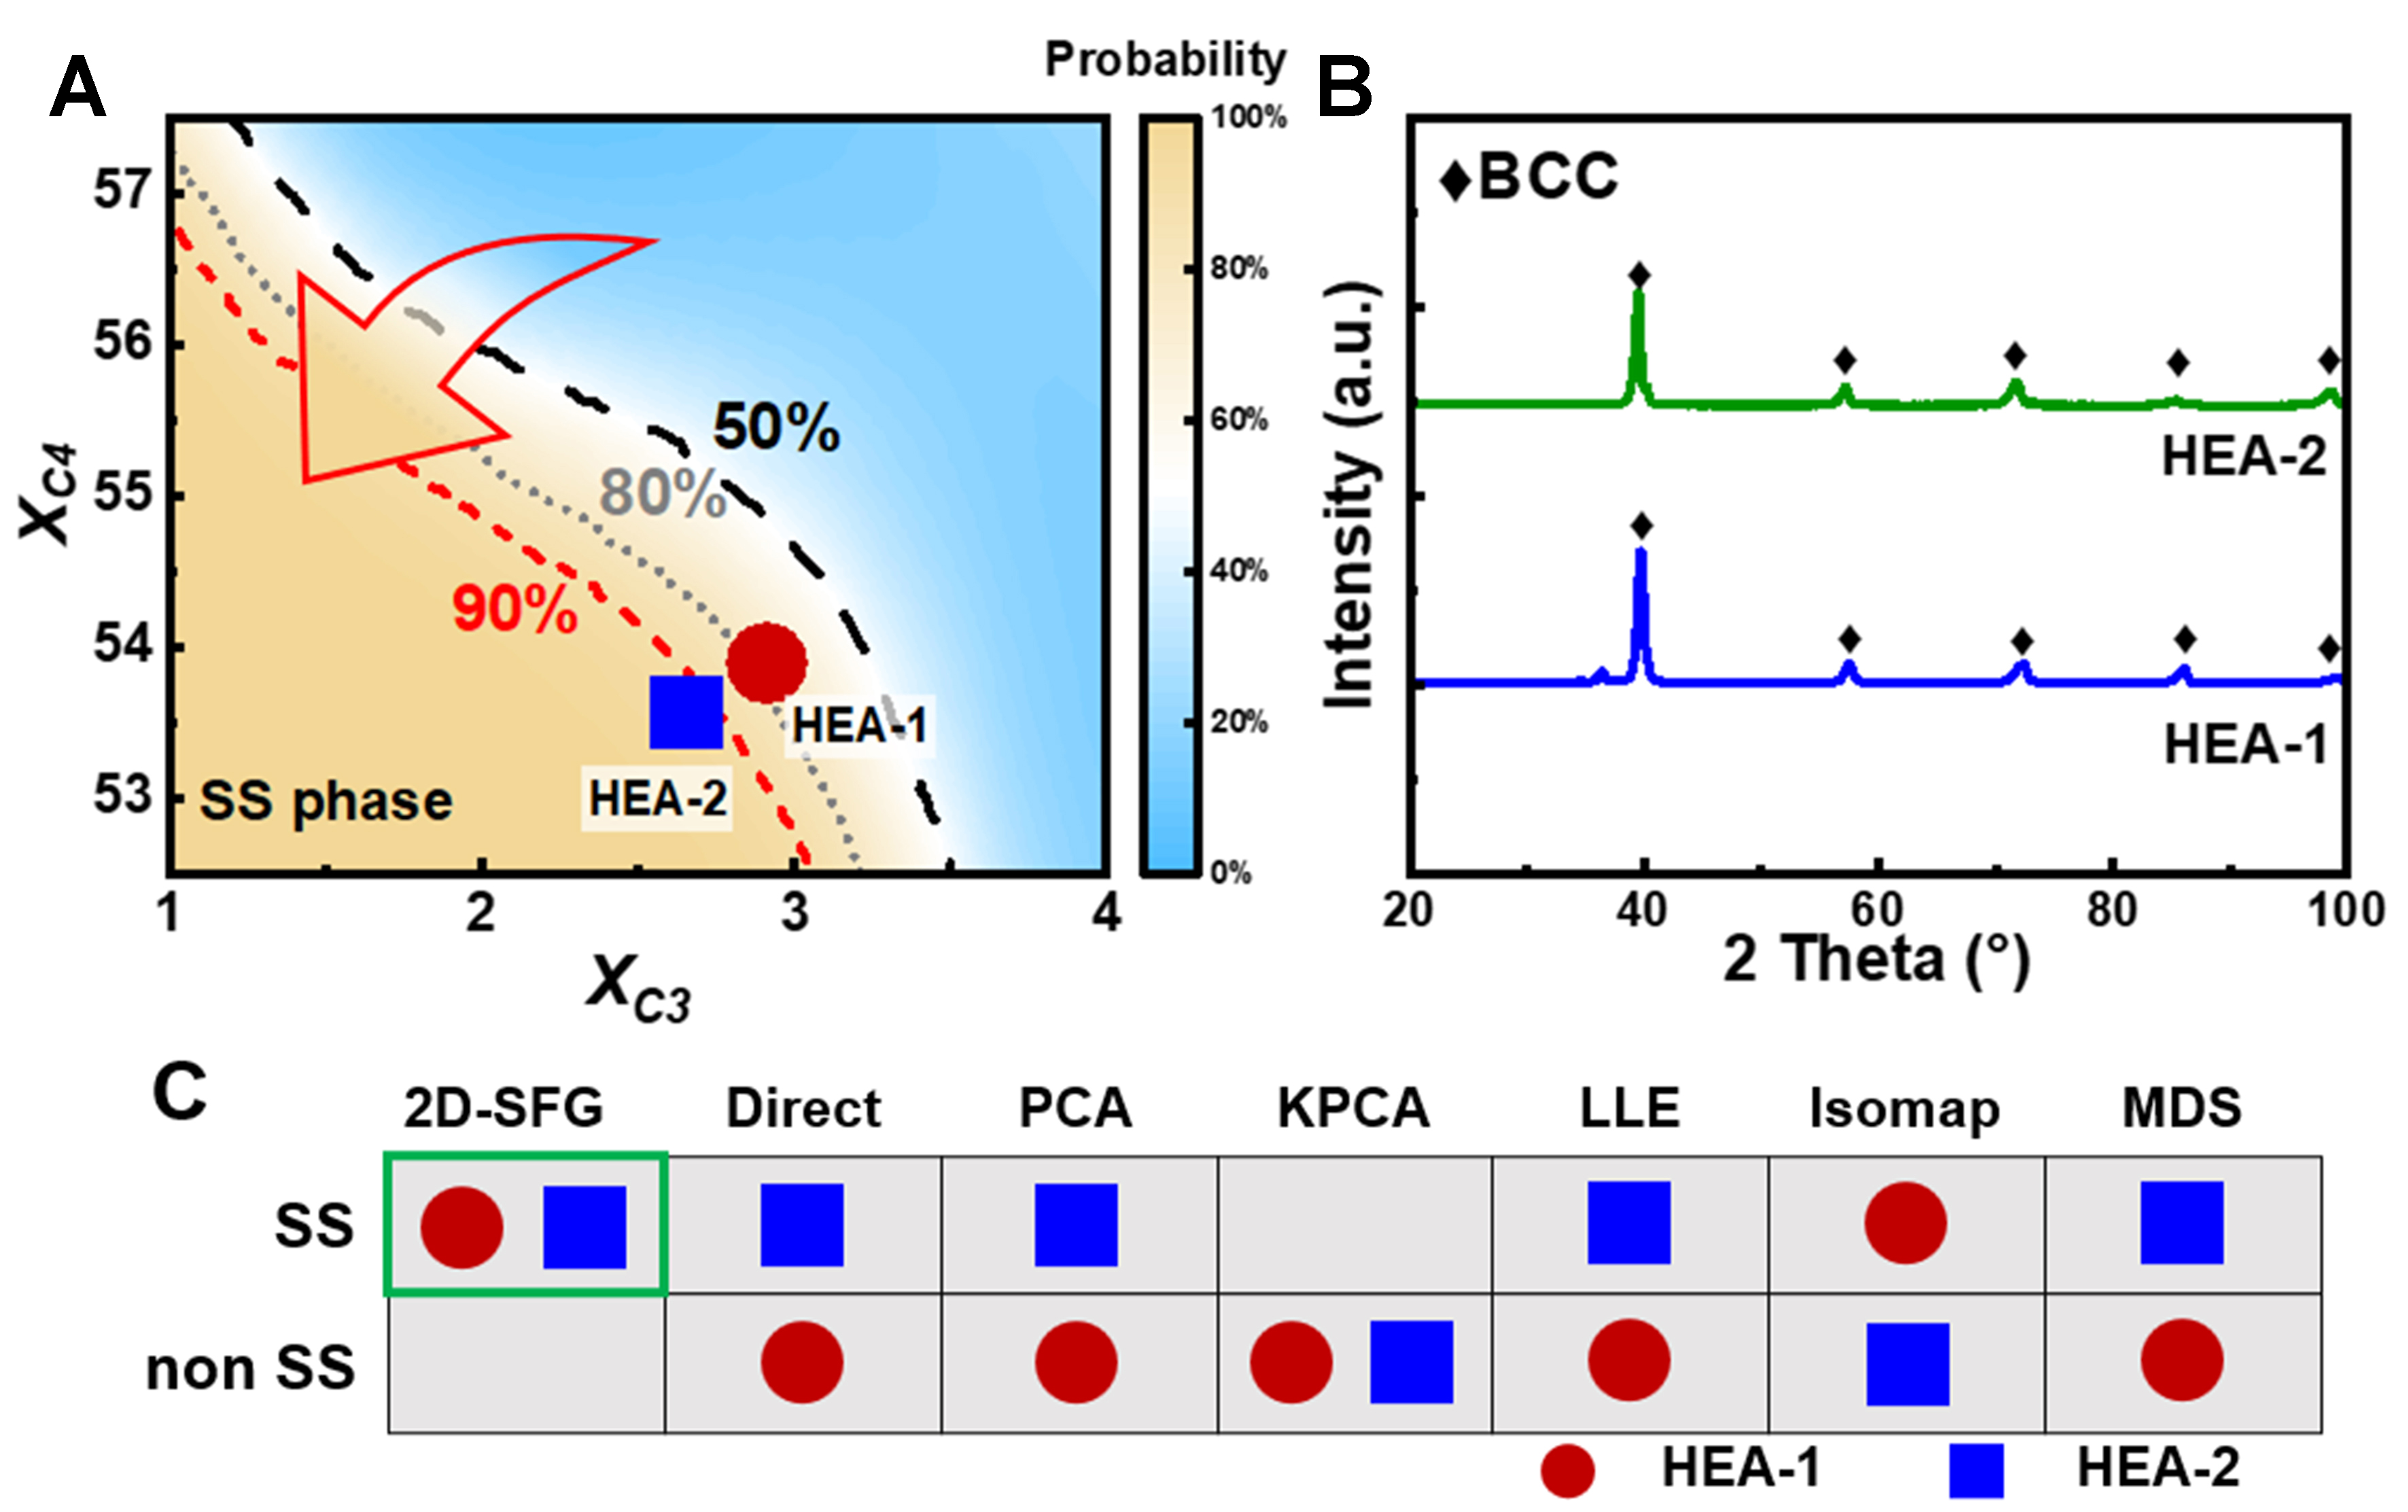
Figure 4. 2D-SFG method for HEA design. (A) Local classification probability map; (B) XRD characterization results; (C) Phase prediction results obtained using different methods. 2D-SFG: Two-dimensional symbolic feature generation; HEA: high-entropy alloy; XRD: X-ray diffraction; BCC: body-centered cubic; PCA: principal component analysis; KPCA: kernel principal component analysis; LLE: locally linear embedding; MDS: multidimensional scaling.
Figure 5 illustrates the application of the constructed hardness and conductivity visualization models to the unexplored composition space of the Cu-Ni-Si system. A promising copper alloy composition, Cu-1.87Ni-0.55Si-0.47Co-0.11Mg-0.07Zr-0.21Zn, was identified on the performance Pareto front as exhibiting a favorable combination of high hardness and medium conductivity. The designed alloy was synthesized via vacuum induction melting, achieving a peak hardness of 275 HV and a corresponding electrical conductivity of 47.2 %IACS (International Annealed Copper Standard). As summarized in Table 5, the prediction performance of different design methods was compared. The 2D-SFG model demonstrated superior generalization capability, with all errors between experimental measurements and model predictions remaining below 7%, confirming its effectiveness in supporting the rational design of high-performance alloys.
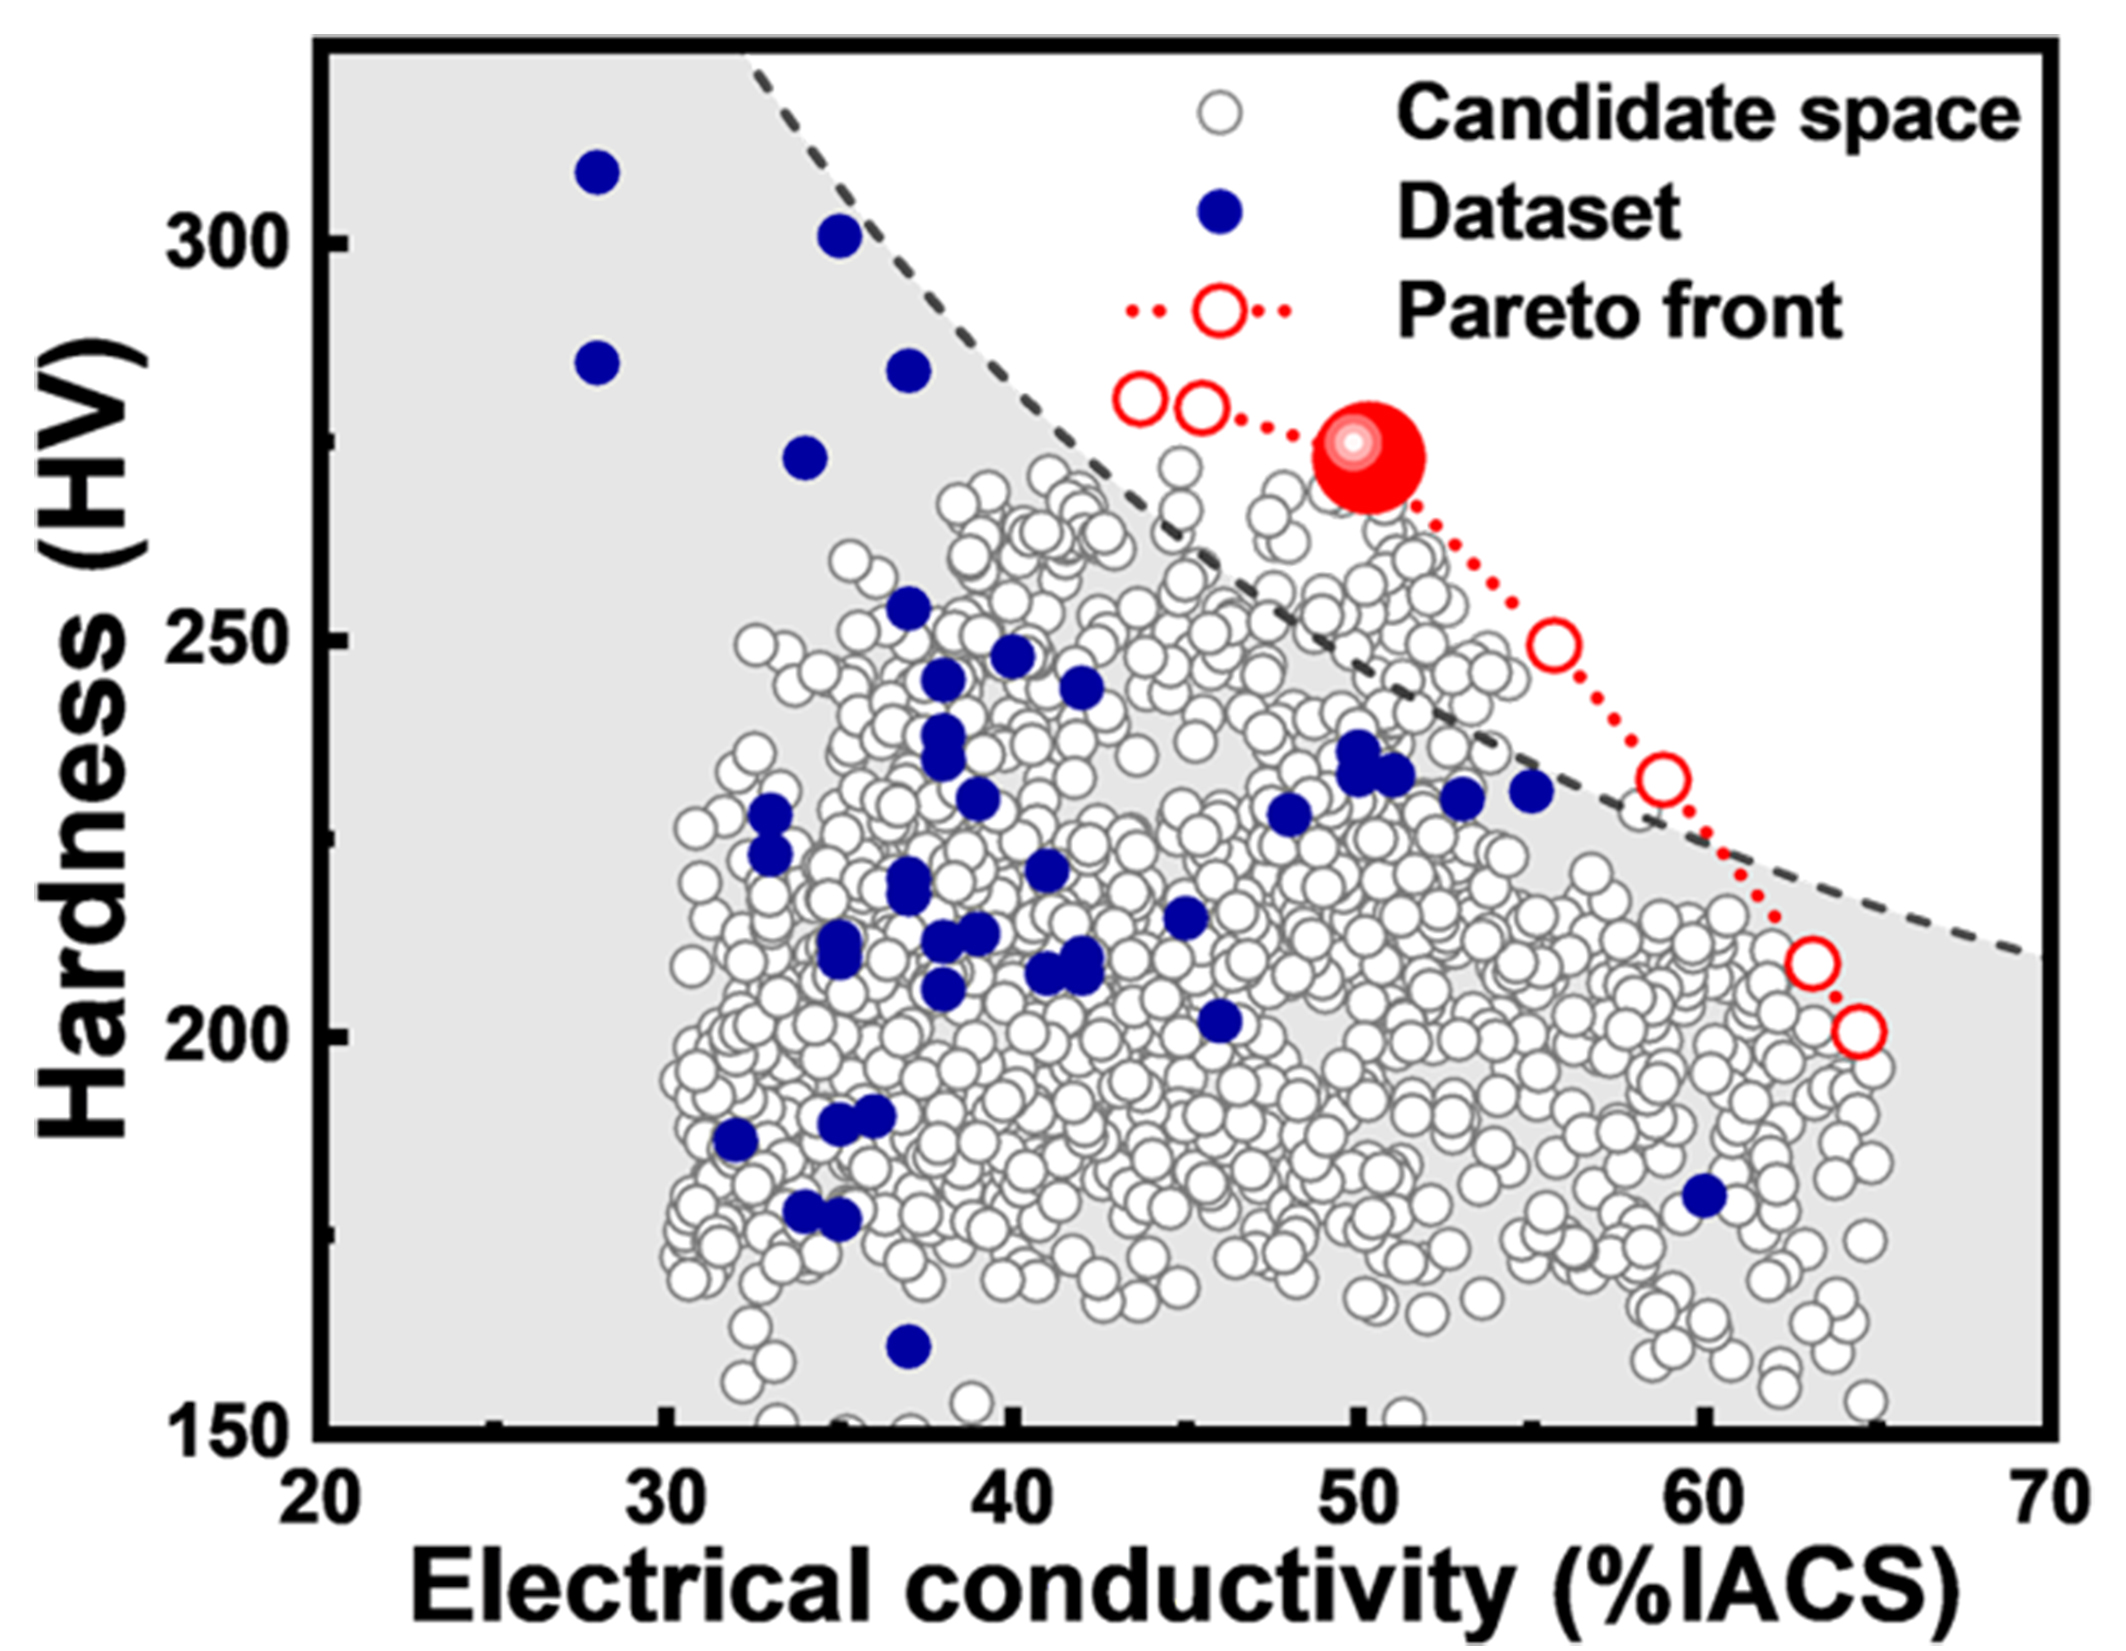
Figure 5. Properties of the designed alloys within the Cu-Ni-Si system. Blue solid dots represent the collected experimental dataset, while white hollow dots represent the explored composition design space. The dashed line indicates the identified Pareto front, and the solid red sphere marks the optimal alloy composition selected through the 2D-SFG-guided design approach. 2D-SFG: Two-dimensional symbolic feature generation; IACS: International Annealed Copper Standard.
Prediction results of properties obtained using different methods
| Methods | 2D-SFG | Direct | PCA | KPCA | LLE | Isomap | MDS |
| HVpred (HV) | 273 | 268 | 209 | 233 | 213 | 215 | 216 |
| Percentage error | 0.7% | 2.5% | 24.1% | 15.3% | 22.5% | 21.8% | 21.5% |
| ECpred (%IACS) | 50.3 | 43.8 | 54.2 | 46.6 | 58.1 | 37.6 | 43.7 |
| Percentage error | 6.6% | 7.2% | 14.8% | 1.3% | 23.1% | 20.3% | 7.4% |
Performance of the intelligent visualization-driven materials design model
To evaluate the performance of the 2D-SFG method in classification tasks, a comprehensive assessment was conducted using multiple metrics, including accuracy, precision, recall, F1 score, and area under the curve (AUC), as shown in Figure 6A and B. The model constructed using 2D-SFG features achieved accuracy and precision rates above 90% on both the training and test sets, with only minor differences between them, indicating no significant overfitting. The F1 score remained consistently above 0.9, reflecting a well-balanced trade-off between precision and recall. Furthermore, the AUC values for both the training and test sets were significantly higher than the 0.9 threshold, demonstrating the model’s strong discriminative ability for classification boundaries and reliability for practical applications.
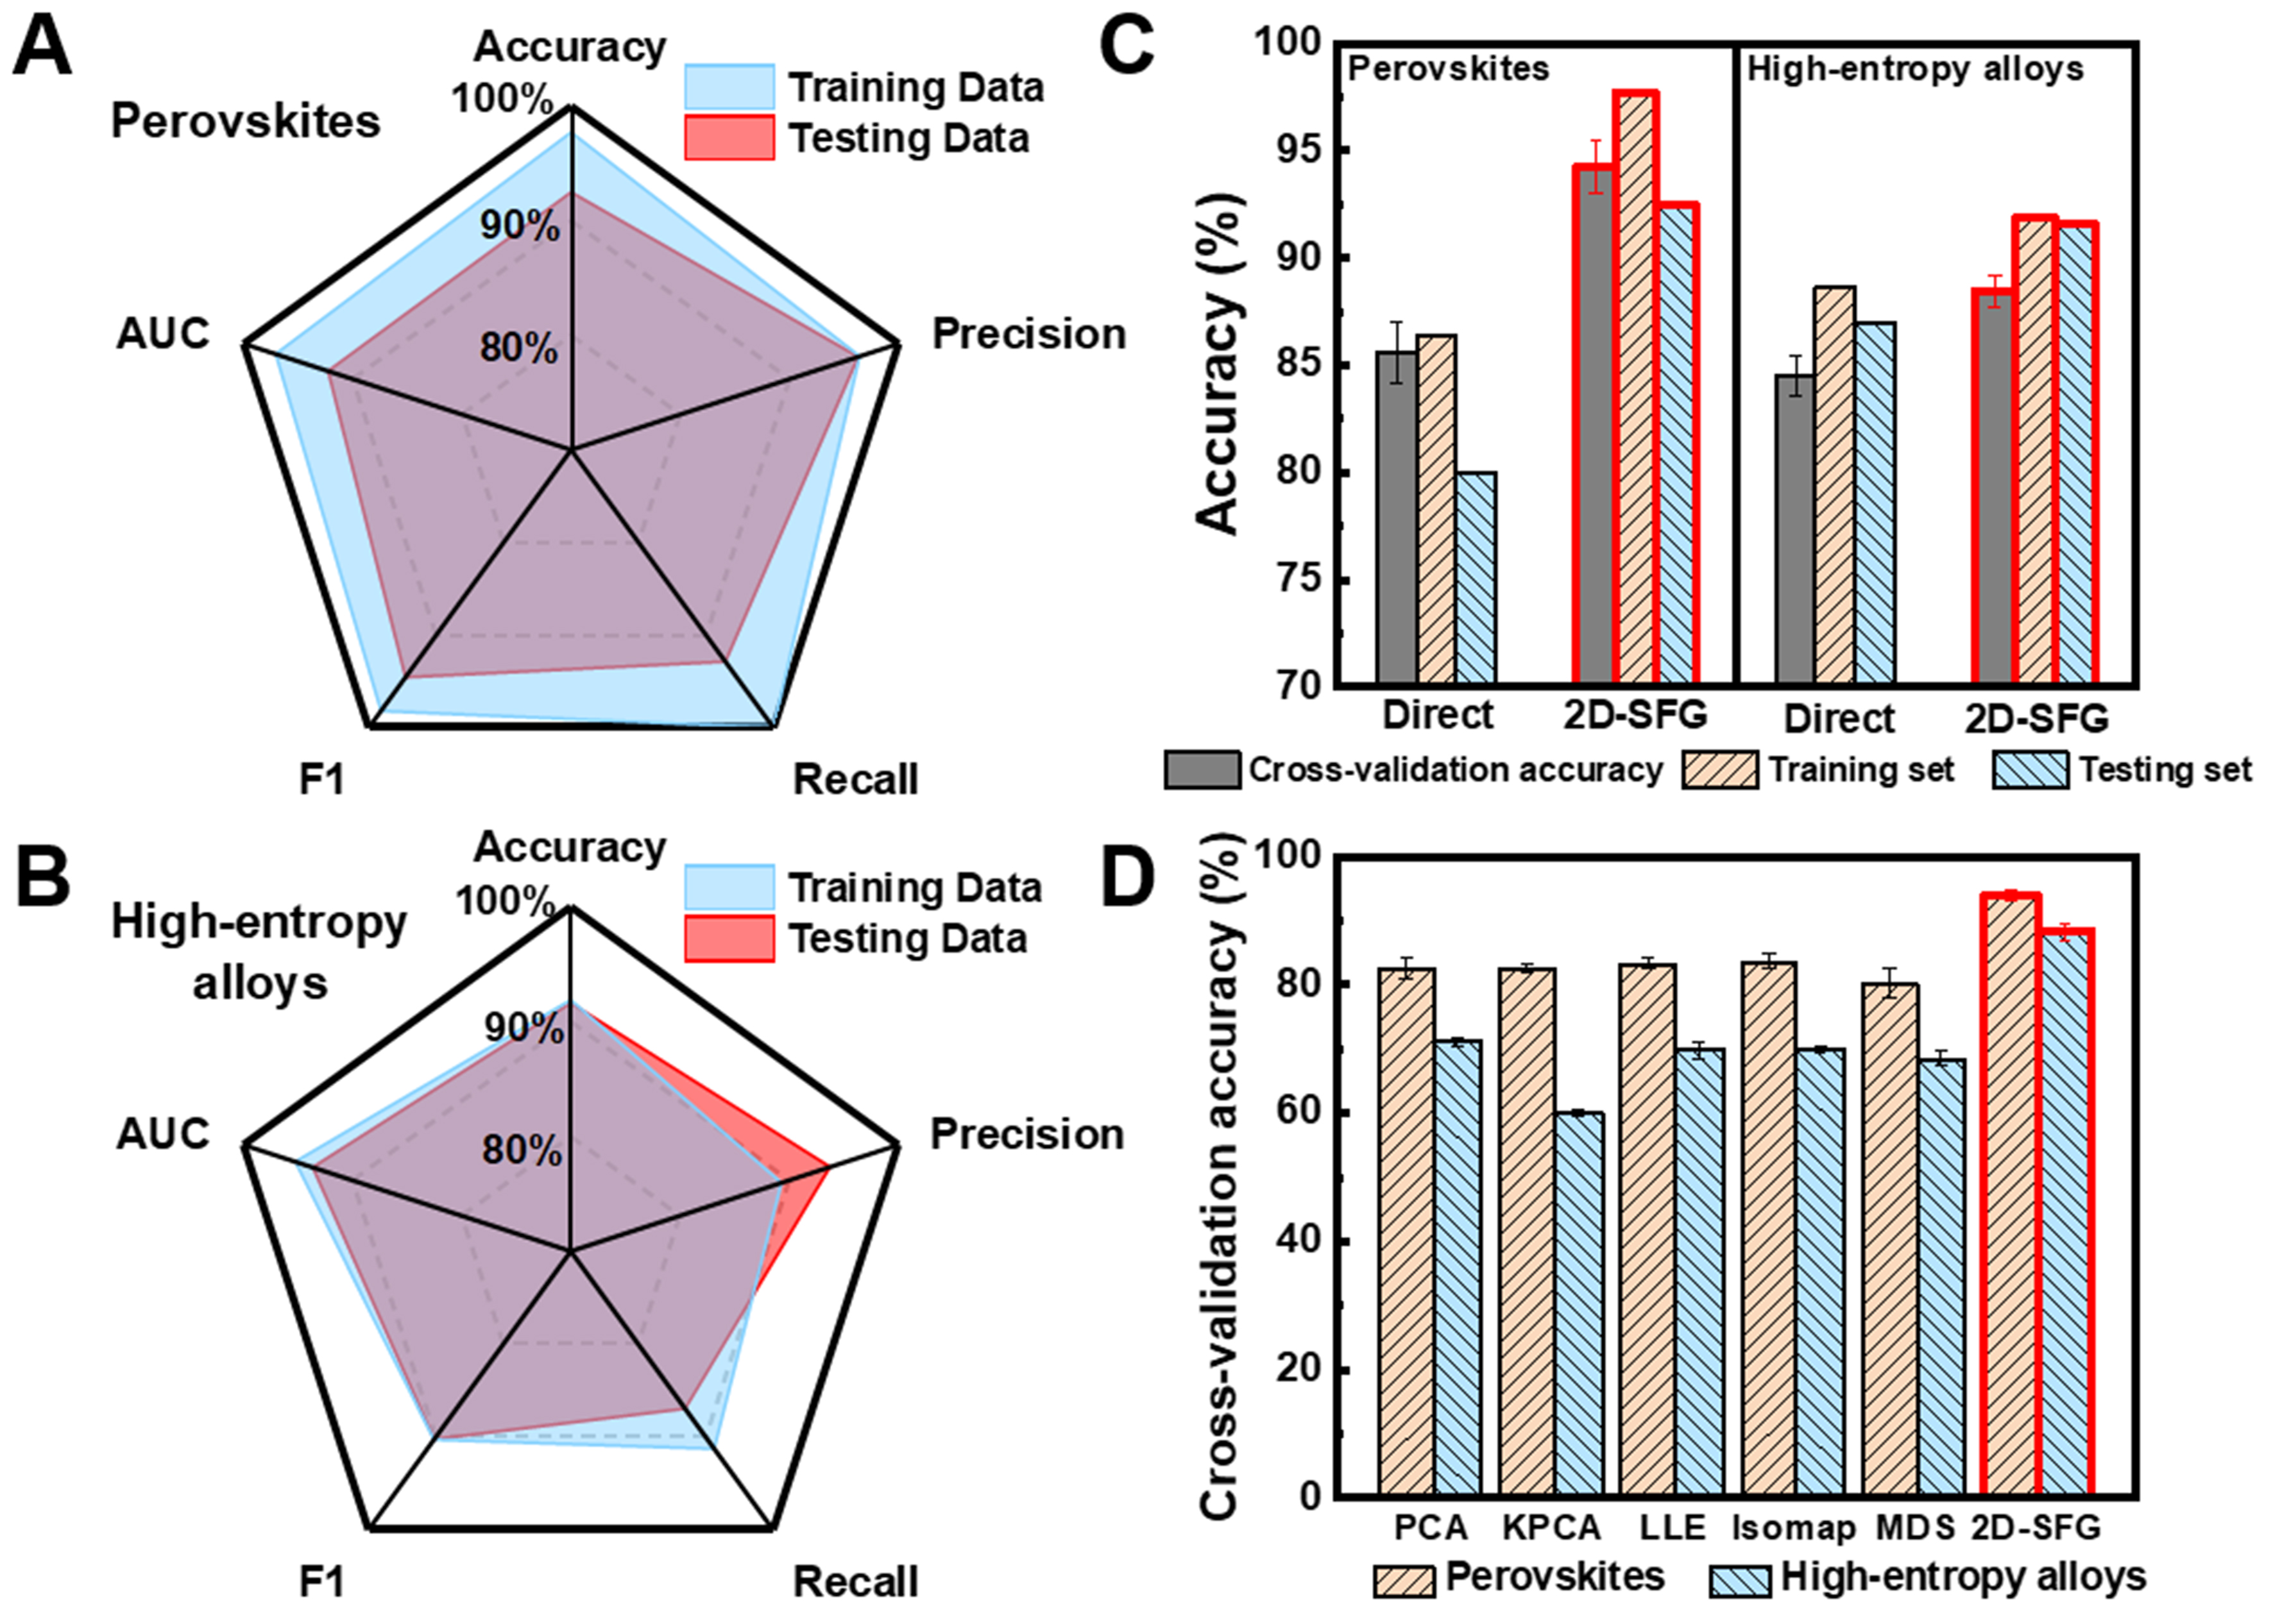
Figure 6. Performance of the 2D-SFG method on classification problems. (A and B) Evaluation metrics of the classification models; (C) Comparison of modeling accuracy between direct modeling and symbolic feature generation; (D) Comparison of multiple dimensionality reduction methods with the 2D-SFG method. Error bars indicate the standard deviation obtained from 10-fold cross-validation. 2D-SFG: Two-dimensional symbolic feature generation; AUC: area under the curve; PCA: principal component analysis; KPCA: kernel principal component analysis; LLE: locally linear embedding; MDS: multidimensional scaling.
A comparative analysis was conducted between direct modeling and the 2D-SFG approach, as illustrated in Figure 6C. The direct modeling method utilized the initial feature set from Table 2 as input, while the 2D-SFG approach employed the new features defined in Equations (1) to (4). It should be noted that both methods were evaluated using the same training and test datasets and underwent hyperparameter optimization. The 2D-SFG model achieved prediction accuracies of 94.2% for perovskite structure classification and 88.4% for HEA phase classification, outperforming the initial feature-based model, which achieved 85.6% and 84.5%, respectively. These results demonstrate that the 2D-SFG method effectively extracts meaningful information from the original features while reducing interference from redundant or irrelevant data.
From the perspective of feature reduction, the proposed 2D-SFG method can also be regarded as a dimensionality reduction technique. To evaluate its effectiveness, this work compared it against several common dimensionality reduction methods, including PCA, kernel principal component analysis (KPCA)[54], locally linear embedding (LLE)[55], Isomap, and multidimensional scaling (MDS)[56]. All methods were configured to reduce the original features to two dimensions before model construction. As shown in Figure 6D, models using features from conventional reduction methods exhibited varying degrees of accuracy degradation, indicating the loss of critical information during the reduction process. In contrast, the 2D-SFG approach not only preserved essential information but also enhanced predictive accuracy, demonstrating its superior applicability for classification tasks.
For the regression tasks, a similar comparative analysis was performed among direct modeling, 2D-SFG modeling, and models built using common dimensionality reduction methods, evaluated through 10-fold cross-validation. The evaluation was based on RMSE and percentage error metrics. As shown in Figure 7, models using conventional dimensionality reduction methods showed either no significant improvement or a slight increase in error, indicating the substantial limitations of these methods for regression tasks. In contrast, the 2D-SFG approach achieved prediction errors of 1.1 K, 3.7%, and 6.2% for the thermal hysteresis of shape memory alloys, and the hardness and electrical conductivity of copper alloys, respectively. These results are lower than the corresponding errors of 2.9 K, 5.9%, and 9.7% obtained using the original feature set, demonstrating the strong applicability of the 2D-SFG method to regression tasks.
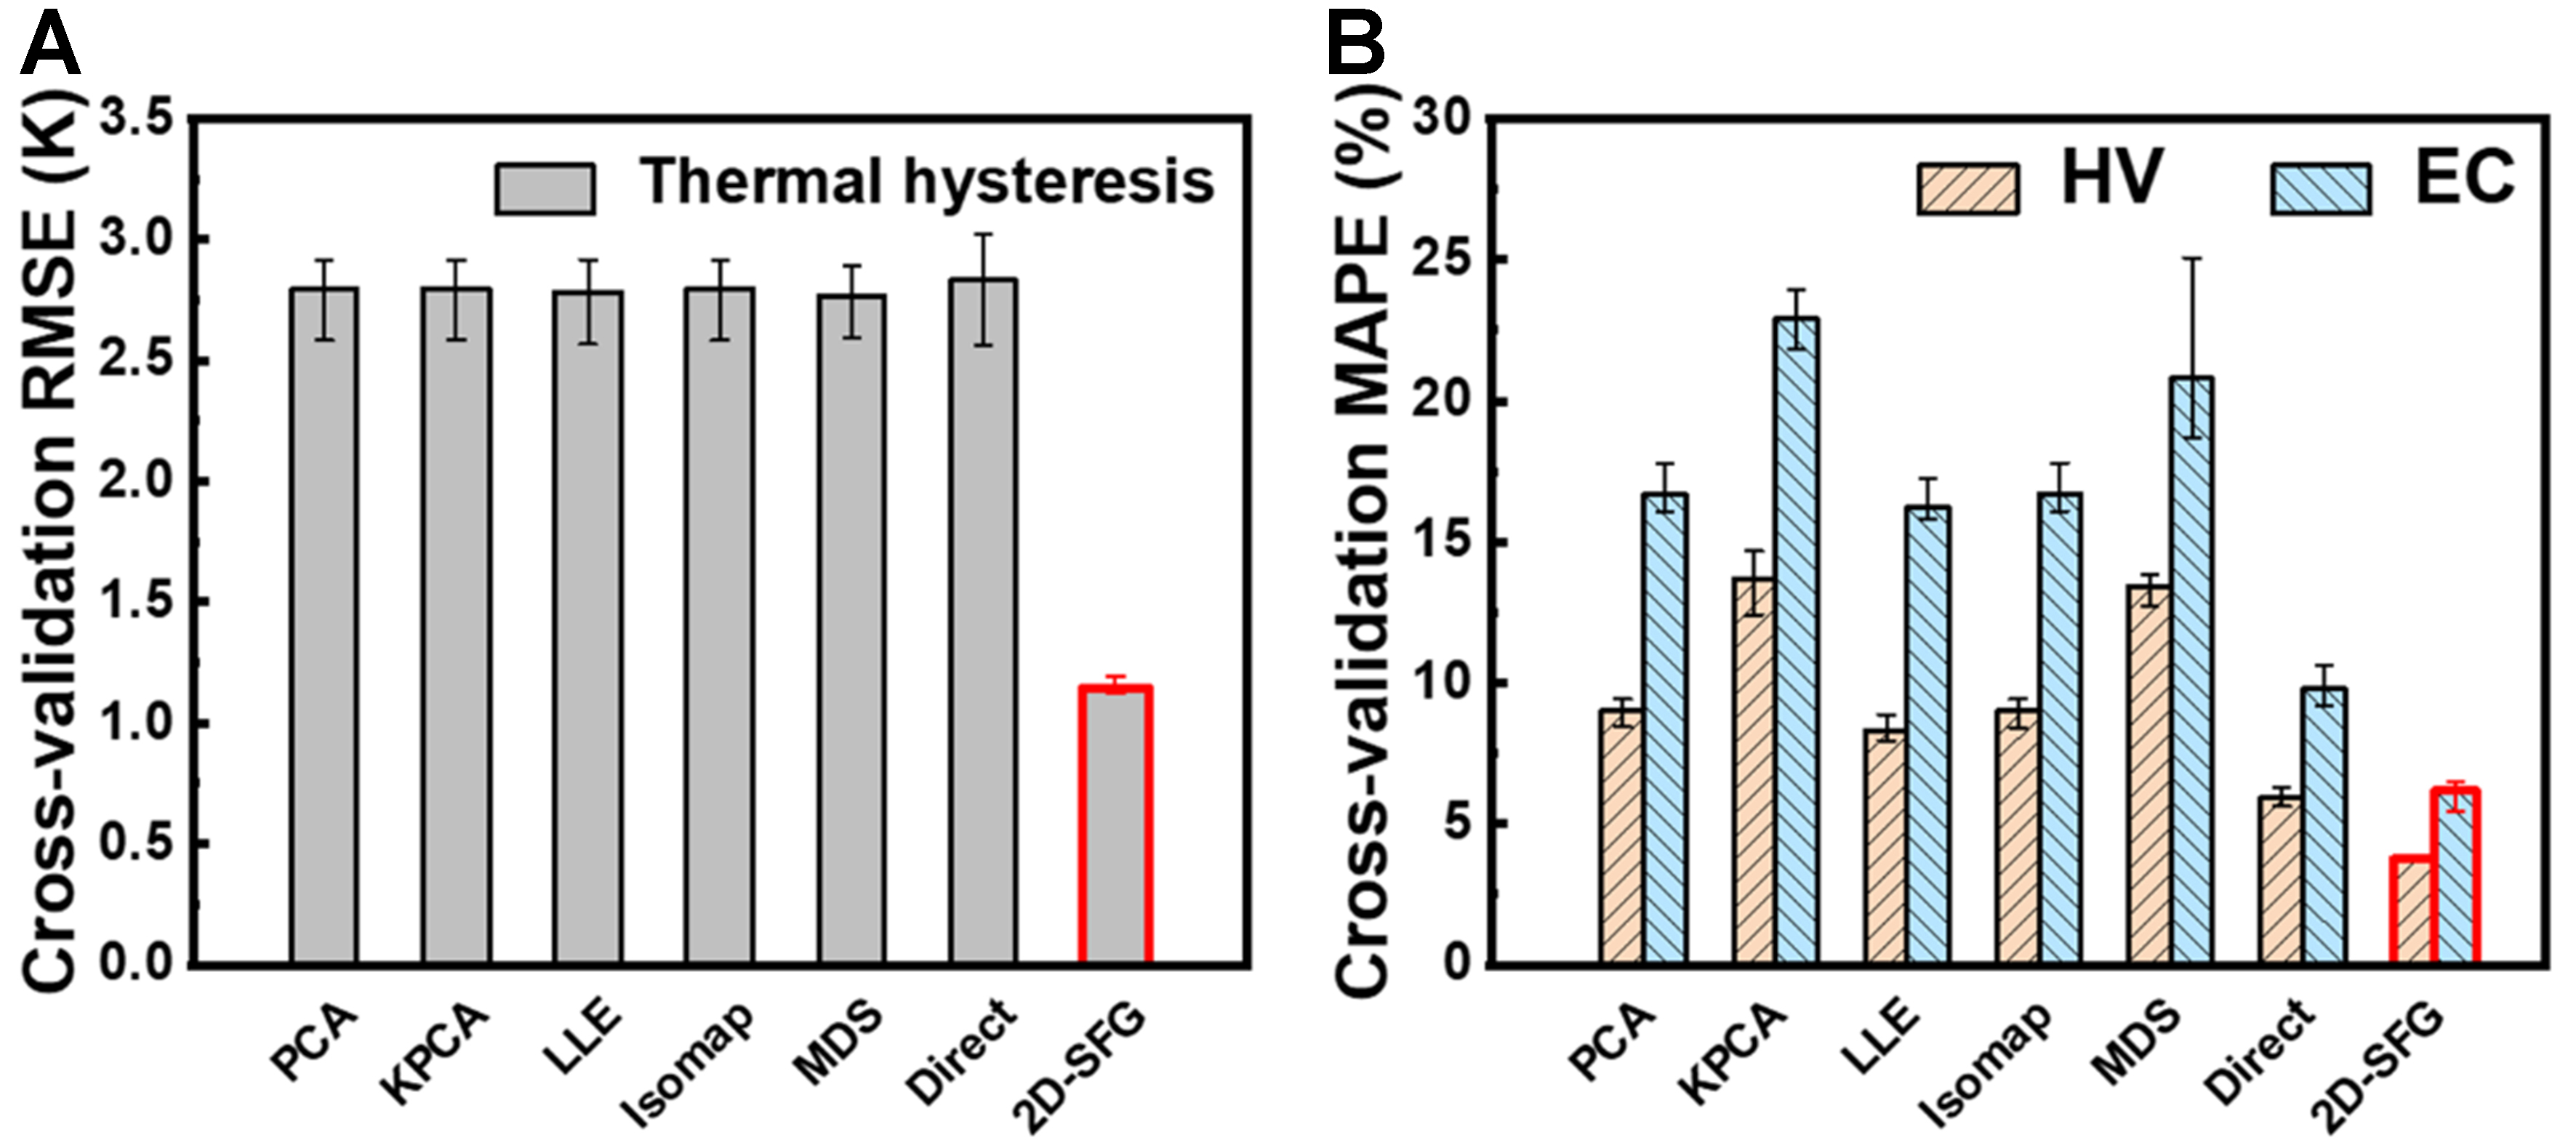
Figure 7. Comparison between multiple dimensionality reduction methods and the 2D-SFG method. (A) Thermal hysteresis of shape memory alloys; (B) Hardness and electric conductivity of copper alloys. Error bars indicate the standard deviations obtained from 10-fold cross-validation. 2D-SFG: Two-dimensional symbolic feature generation; RMSE: root mean square error; PCA: principal component analysis; KPCA: kernel principal component analysis; LLE: locally linear embedding; MDS: multidimensional scaling; MAPE: mean absolute percentage error.
Although our primary analysis and discussion focused on the support vector machine algorithm due to its robustness in small-sample materials science problems, the core advantage of 2D-SFG, as a feature generation method for physics-informed knowledge discovery, lies in its ability to generate mathematical descriptors that explicitly encode physical mechanisms. This capability alleviates the burden on black-box models to implicitly extract features, thereby enhancing both predictive accuracy and generalization capability. To verify whether these performance gains are algorithm-agnostic, we conducted additional comparative studies using random forest (RF) and gradient boosting (GB) algorithms. The results, presented in Supplementary Table 3, demonstrate that models trained on symbolic features generated by 2D-SFG consistently outperform those based on original feature inputs across all tested algorithms. These findings indicate that 2D-SFG serves as a versatile and seamlessly compatible module that can be integrated into diverse ML workflows. Extending the 2D-SFG framework to guide more complex architectures, such as Deep Neural Networks, will be a primary focus of our future work.
Generated feature importance and interpretability analysis
The occurrence frequency of each original feature in the explicit expressions generated over 100 iterations was counted to assess feature importance, as illustrated in Figure 8. A higher frequency indicates greater importance of the corresponding feature. For instance, feature f0 does not appear in Equation (2), suggesting that its information is either redundant with that of the other four features or has limited influence on the target property. Consequently, it was discarded in later iterations, resulting in an overall frequency of less than 20. In the case of copper alloy hardness, all features exhibited occurrence frequencies above 100, reflecting their substantial individual importance and joint contribution to the target property. This also explains why the final explicit expression for hardness is mathematically more complex. In contrast, the electrical conductivity of precipitation-strengthened copper alloys is governed by a relatively simpler mechanism compared to hardness. As a result, meaningful information could be extracted from the original features using simpler mathematical operations, leading to a less complex symbolic expression for conductivity.
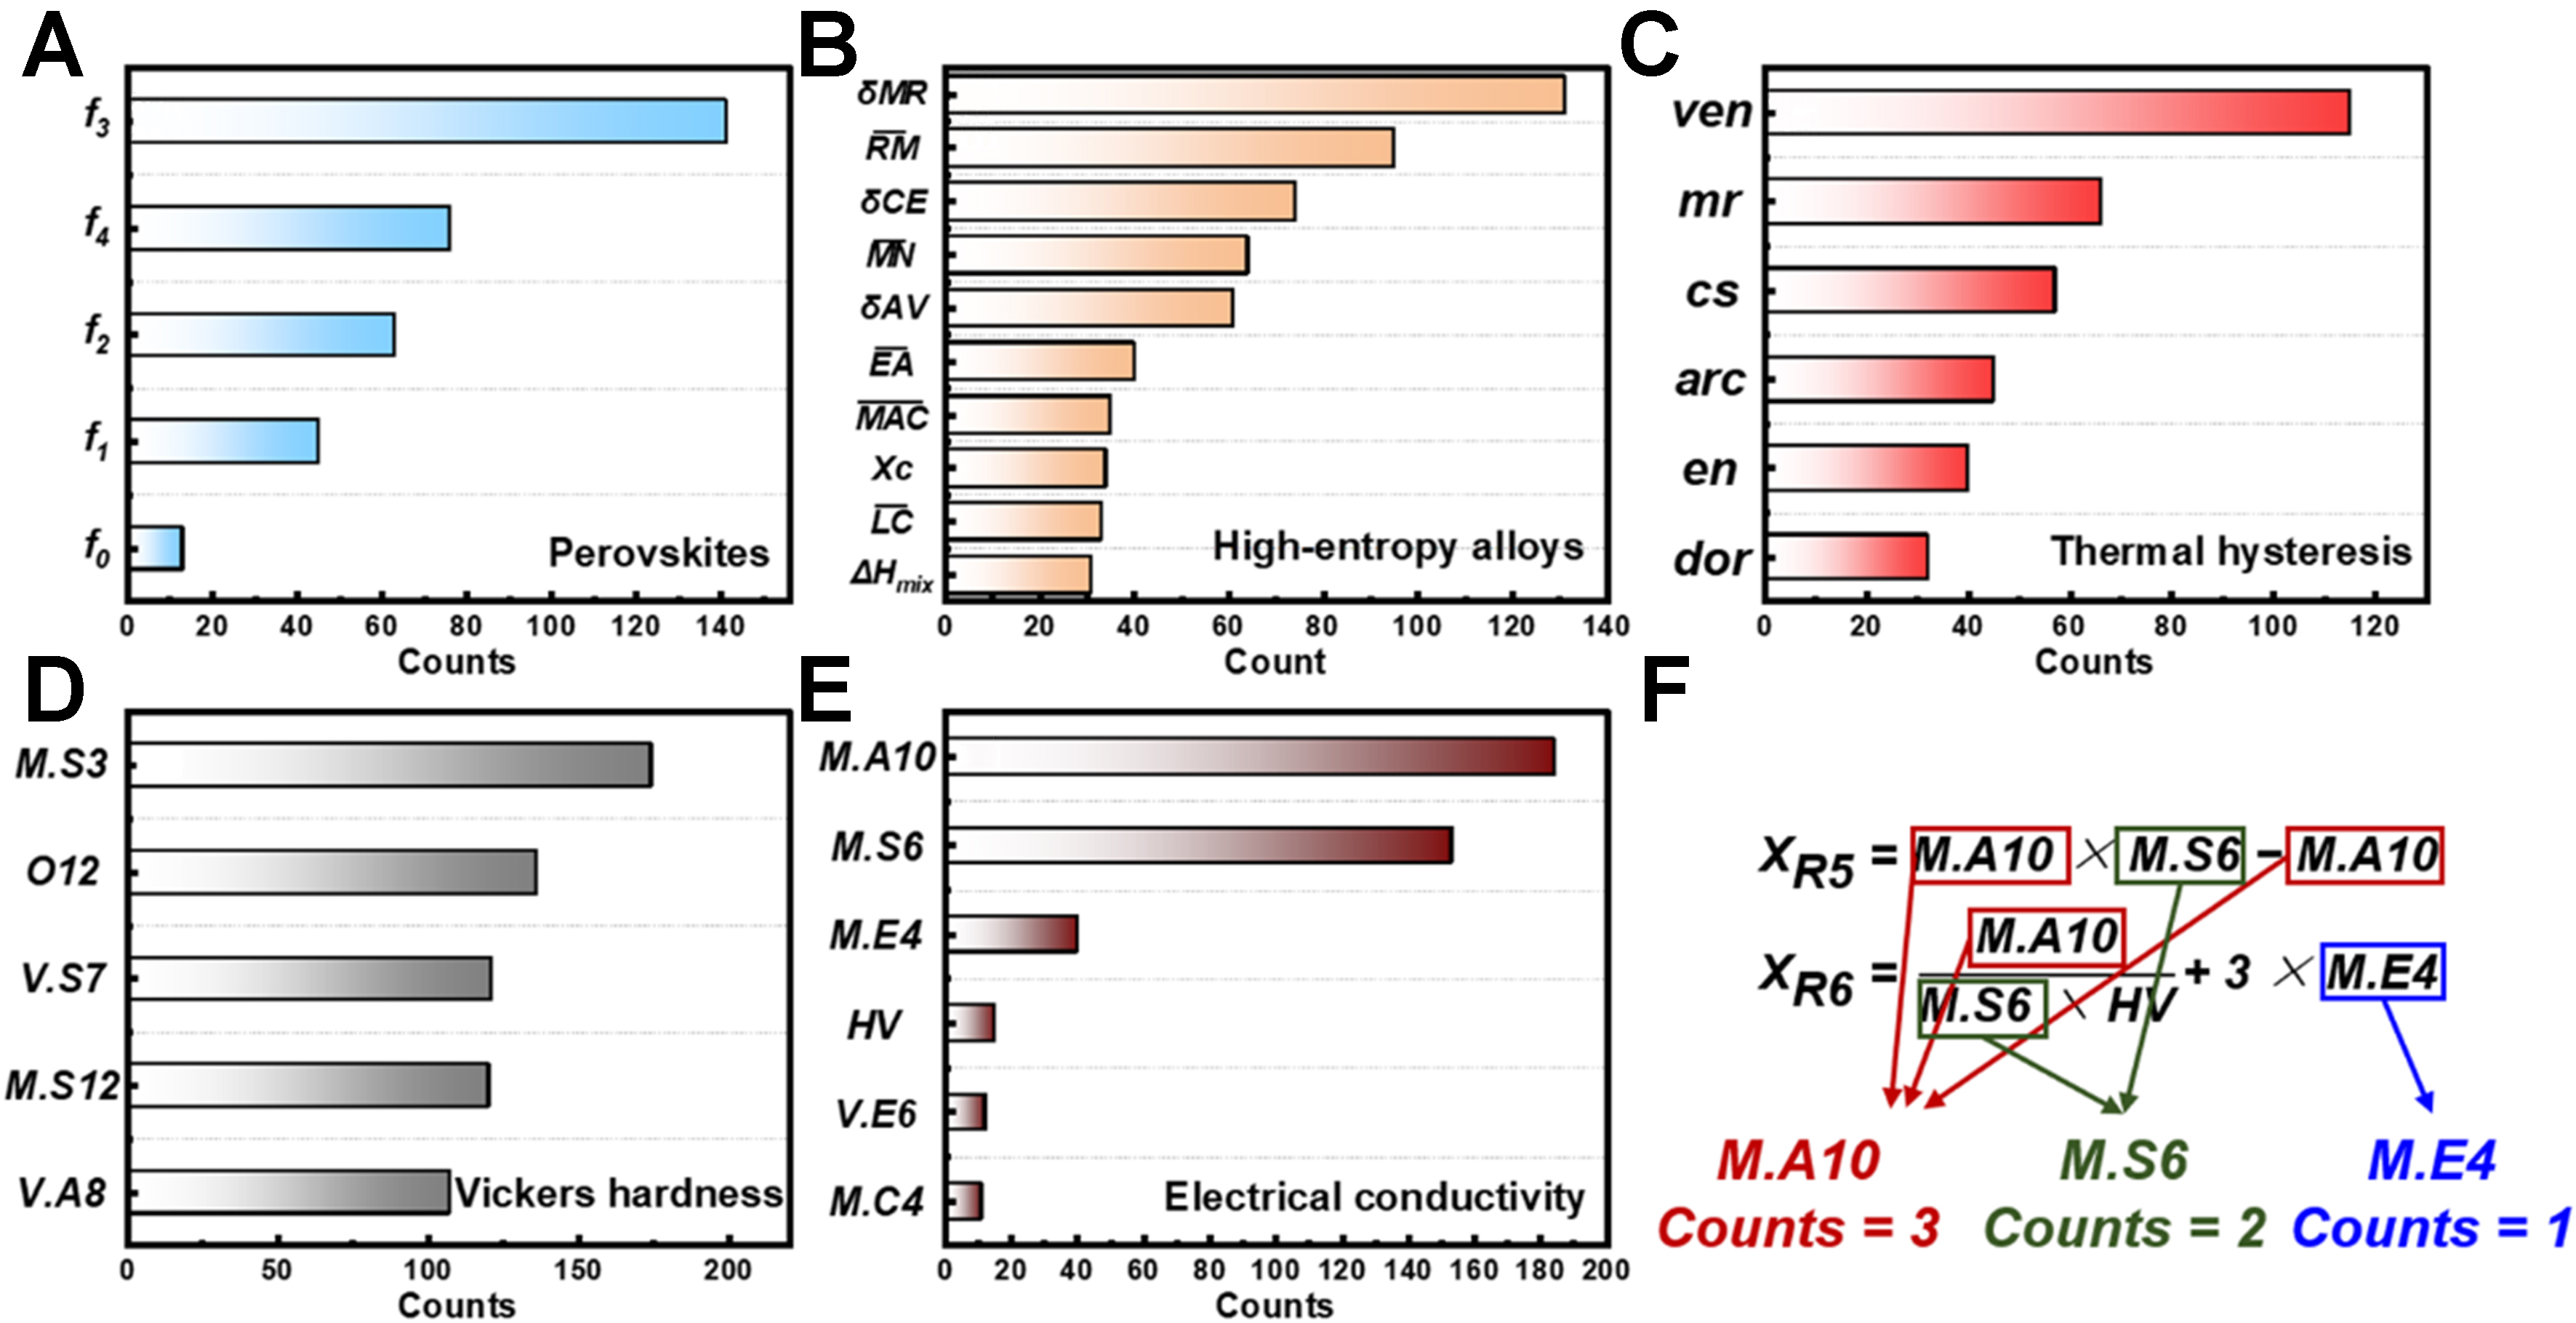
Figure 8. Feature importance ranking. (A) Structure classification task for perovskites; (B) Phase classification task for HEAs; (C) Thermal hysteresis regression task for shape memory alloys; (D and E) Comprehensive property regression task for copper alloys; (F) Example of counting rules. HEAs: High-entropy alloys.
This work successfully constructed new features for various material classification and regression problems through the 2D-SFG method. These features not only significantly enhance the predictive performance of ML models but also maintain explicit quantitative relationships with the original features, thereby improving physical interpretability in specific materials research problems. The 2D-SFG method is capable of constructing meaningful nonlinear combinations that capture complex physical interactions. Analysis of the specific mathematical forms of the generated symbolic features, such as products, ratios, and linear corrections, can further elucidate how feature co-occurrence influences target properties.
In the classification tasks, the new feature XC1 couples the bonding strength driven by electronegativity (f2) with the valence electron number (f1). This formulation reflects the electronic shielding effect, whereby a lower valence electron count amplifies the impact of charge rearrangement induced by electronegativity differences on lattice distortion. The formula demonstrates that perovskite formation requires not only geometric matching but also weighted correction of chemical bond polarity strength by electron concentration[57]. The new feature XC3 employs a multiplicative form to quantify the nonlinear geometric distortion driving force arising from dual deviations in metal radius (δMR) and atomic volume (δAV). The formation of HEA solid solutions requires not only minimal geometric distortion but also sufficient intrinsic electronic properties and mechanical stiffness to effectively buffer and accommodate inevitable lattice strains[58,59].
In the regression tasks, the original features atomic radius (arc) and pseudopotential radius (dor), both associated with atomic size mismatch, frequently co-occur. Increases in these values can raise the distortion energy barrier, thereby increasing thermal hysteresis. The new feature XR1 multiplies atomic size-related features by a chemical scaling parameter to capture the synergistic effect between atomic size mismatch and the chemical bonding environment, while subtracting the valence electron number (ven) to correct for the shielding effect on lattice distortion in systems with high electron concentrations. This formulation comprehensively reflects their combined influence on thermal hysteresis[60]. Furthermore, the new feature XR2 is expressed as a ratio of electronegativity to multi-scale structural parameters. Physically, a larger denominator indicates stronger lattice distortion and greater resistance to the phase transformation driving force, while a larger numerator reflects more intense electron transfer and a higher phase transformation energy barrier. Consequently, a smaller XR2 value facilitates easier phase transformation and corresponds to lower thermal hysteresis[61,62]. The new feature XR5 is formulated as the product of the mass attenuation coefficient and the extranuclear electron distance. This construction captures the coupling between electron scattering efficiency and atomic size effects, where the extranuclear electron distance governs electron cloud distribution. Enhanced electron cloud overlap driven by this interaction leads to significantly improved conductivity. Additionally, the new feature XR6 incorporates measured Vickers hardness and absolute electronegativity. This combination accounts for the effects of lattice distortion and dislocation density. The formulation aligns well with the established understanding that electrical conductivity in metallic systems is collectively determined by the interplay among lattice defects, solute atoms, and polarization effects[63-65].
The 2D-SFG method demonstrates a unique capability to automatically discover nonlinear descriptors that are difficult to predefine empirically. Although the resulting feature expressions may appear mathematically complex, each term corresponds to established physical models or empirical relationships in materials science. Furthermore, these explicit mathematical expressions effectively overcome the lack of physical insights inherent in black-box models. However, it is important to acknowledge certain limitations of the generated features: the physical universality of these expressions requires validation across broader material systems, and certain high-order interaction terms might introduce singularities. Future work should focus on enhancing the physical consistency and stability of the feature engineering process.
Analysis of the reuse effect of generated features
To further evaluate whether the symbolic feature generation method successfully integrates and learns universal knowledge, the authors collected a dataset of aluminum alloys subjected to solution and aging treatments. This dataset includes alloy composition, processing parameters, hardness, and electrical conductivity. The initial features listed in Table 3 were calculated, with the solid solubility of elements in aluminum used as a substitute for their solubility in copper. As shown in Table 6, calculating features XR3 to XR6 using the aluminum alloy dataset and retraining the model (Method A) yielded better predictive performance than the model trained with the original aluminum alloy features (Method B). For hardness prediction, Method A achieved cross-validation, training, and test errors of 9.9%, 7.5%, and 8.4%, respectively, representing an average reduction of 2.0% compared to Method B (10.9%, 9.6%, and 11.3%). Similarly, for electrical conductivity prediction, the errors decreased from 3.8%, 3.6%, and 5.3% to 2.9%, 1.1%, and 2.4%, corresponding to an average improvement of 2.1%. When a RF classifier was used instead, the 2D symbolic features still reduced the average hardness prediction error by 1.8% and the conductivity prediction error by 2.2%, confirming that the advantage stems from the features themselves rather than from algorithmic coincidence.
Prediction results of models under different methods
| Methods | Hardness | Electrical conductivity | ||||
| CV | Training | Testing | CV | Training | Testing | |
| Method A (SVR) | 9.9% | 7.5% | 8.4% | 2.9% | 1.1% | 2.4% |
| Method B (SVR) | 10.9% | 9.6% | 11.3% | 3.8% | 3.6% | 5.3% |
| Method A (RF) | 12.3% | 10.8% | 13.3% | 3.2% | 3.1% | 7.6% |
| Method B (RF) | 14.5% | 11.6% | 15.7% | 4.3% | 5.7% | 10.5% |
The distributional differences in feature values between copper and aluminum alloys pose a challenge for out-of-distribution generalization when copper alloy models are directly applied to aluminum alloy data. Although Method B was retrained using aluminum alloy data, the original features may still fail to capture the complex nonlinear relationships governing material properties. In contrast, the symbolically generated features derived from copper alloy data preserve the underlying mappings associated with alloy performance, as evidenced by the superior predictive performance of the aluminum alloy regression model (Method A) built with these features. The strong performance of Method A confirms both the applicability and effectiveness of the symbolically generated features, which not only retain key physical information learned through the 2D-SFG method but also adapt effectively to aluminum alloy data through refitting. The demonstrated predictive capability across both copper and aluminum alloy systems validates the transferability of the 2D-SFG method, offering a novel approach for cross-system materials modeling.
CONCLUSIONS
This study aimed to overcome the dual challenges of limited model interpretability and the difficulty of extracting reusable design routes in materials informatics by developing a novel 2D-SFG method. Our findings demonstrate that integrating symbolic regression with genetic algorithms not only significantly enhances predictive accuracy across diverse material systems, but also yields compact mathematical formulas that align with classical physical models, thereby ensuring visualization and physically interpretable dimensionality reduction. Furthermore, the generated 2D feature maps provide intuitive visualizations of phase boundaries and property contours, effectively guiding the successful design of high-performance alloys without relying on black-box predictions. This interpretable framework lays the foundation for a fundamental shift in materials design methodology, moving from “black-box” exploration to “white-box” rational design by exploring the relationship between data and fundamental physical mechanisms.
DECLARATIONS
Authors’ contributions
Carried out the majority of the modeling and experimental work: Yong, W.; Zhang, H.
Contributed to the discussion and data analysis: Li, Z.; He, J.
Conducted data collection: Chen, C.; Gao, Y.
Designed the modeling approaches and supervised the research: Fu, H.; Xie, J.
All authors interpreted the results and contributed to the writing of the paper.
Availability of data and materials
The data that support the findings of this study are available from the corresponding author upon reasonable request.
AI and AI-assisted tools statement
Not applicable.
Financial support and sponsorship
This work was supported by the National Major Science and Technology Projects of China (2024ZD0608100), the National Natural Science Foundation for Distinguished Young Scholars of China (No. 52425409), the National Natural Science Foundation of China (Nos. 52404387, 52374379, and U24A2029), the Xiaomi Young Scholars Program, and the Interdisciplinary Research Project for Young Teachers of USTB (Fundamental Research Funds for the Central Universities) (No. FRF-IDRY-23-002). The Article Processing Charge (APC) was fully funded by Shaanxi Sirui Advanced Materials Co., Ltd.
Conflicts of interest
Fu, H. is a Guest Editor of the Special Topic “AI-Driven Design and Intelligent Manufacturing of Advanced Copper Alloy” in Journal of Materials Informatics. He was not involved in any stage of the editorial process, notably including reviewer selection, manuscript handling, or decision making. The other authors declared that there are no conflicts of interest.
Ethical approval and consent to participate
Not applicable.
Consent for publication
Not applicable.
Copyright
© The Author(s) 2026.
Supplementary Materials
REFERENCES
1. Rahman, A.; Hossain, M. S.; Siddique, A. Review: machine learning approaches for diverse alloy systems. J. Mater. Sci. 2025, 60, 12189-221.
2. Hu, M.; Tan, Q.; Knibbe, R.; et al. Recent applications of machine learning in alloy design: a review. Mater. Sci. Eng. R. Rep. 2023, 155, 100746.
3. Kumar, A.; Mukhopadhyay, N. K.; Yadav, T. P. Recent progresses on high entropy alloy development using machine learning: a review. Comput. Mater. Today. 2025, 8, 100038.
4. Cheng, M.; Fu, C. L.; Okabe, R.; et al. Artificial intelligence-driven approaches for materials design and discovery. Nat. Mater. 2026, 25, 174-90.
5. Hart, G. L. W.; Mueller, T.; Toher, C.; Curtarolo, S. Machine learning for alloys. Nat. Rev. Mater. 2021, 6, 730-55.
6. Merchant, A.; Batzner, S.; Schoenholz, S. S.; Aykol, M.; Cheon, G.; Cubuk, E. D. Scaling deep learning for materials discovery. Nature 2023, 624, 80-5.
7. Feng, L.; Li, J.; Lu, Q.; et al. Accelerated development of high-strength and high-conductivity Cu-Cr-Ti alloys based on data-driven design and experimental validation. Mater. Design. 2025, 253, 113948.
8. Yin, J.; Lei, Q.; Li, X.; et al. A novel neural network-based alloy design strategy: gated recurrent unit machine learning modeling integrated with orthogonal experiment design and data augmentation. Acta. Mater. 2023, 243, 118420.
9. Zhang, H.; Fu, H.; Zhu, S.; Yong, W.; Xie, J. Machine learning assisted composition effective design for precipitation strengthened copper alloys. Acta. Mater. 2021, 215, 117118.
10. Zhang, H.; Fu, H.; He, X.; et al. Dramatically enhanced combination of ultimate tensile strength and electric conductivity of alloys via machine learning screening. Acta. Mater. 2020, 200, 803-10.
11. Li, L.; Liu, G.; Yu, H.; et al. A machine learning strategy to achieve strength-conductivity-ductility synergy of high‐performance Cu-Ni-Co-Si alloys via rolling and aging process. J. Mater. Sci. Technol. 2026, 267, 184-97.
12. Sohail, Y.; Zhang, C.; Xue, D.; et al. Machine-learning design of ductile FeNiCoAlTa alloys with high strength. Nature 2025, 643, 119-24.
13. Vazquez, G.; Chakravarty, S.; Gurrola, R.; Arróyave, R. A deep neural network regressor for phase constitution estimation in the high entropy alloy system Al-Co-Cr-Fe-Mn-Nb-Ni. npj. Comput. Mater. 2023, 9, 1021.
14. Li, H.; Wang, J.; Xu, Q.; et al. High-strength medium-entropy alloy designed by precipitation-strengthening mechanism via machine learning. Mater. Sci. Eng. A. 2023, 882, 145443.
15. Vela, B.; Khatamsaz, D.; Acemi, C.; Karaman, I.; Arróyave, R. Data-augmented modeling for yield strength of refractory high entropy alloys: a Bayesian approach. Acta. Mater. 2023, 261, 119351.
16. Wang, J.; Kwon, H.; Kim, H. S.; Lee, B. A neural network model for high entropy alloy design. npj. Comput. Mater. 2023, 9, 1010.
17. Yin, J.; Rao, Z.; Wu, D.; et al. Interpretable predicting creep rupture life of superalloys: enhanced by domain-specific knowledge. Adv. Sci. 2024, 11, e2307982.
18. Lian, L.; Bao, Z.; Xiong, Q.; et al. Intelligent design of crack-resistant nickel-based superalloys for additive manufacturing by machine learning and multilayer filtering strategy. Mater. Today. Commun. 2025, 46, 112387.
19. Zhuang, X.; Antonov, S.; Li, W.; Lu, S.; Li, L.; Feng, Q. Alloying effects and effective alloy design of high-Cr CoNi-based superalloys via a high-throughput experiments and machine learning framework. Acta. Mater. 2023, 243, 118525.
20. Ma, Q.; Li, X.; Xin, R.; et al. Thermodynamic calculation and machine learning aided composition design of new nickel-based superalloys. J. Mater. Res. Technol. 2023, 26, 4168-78.
21. Yang, F.; Zhao, W.; Ru, Y.; et al. Deep learning accelerates the development of Ni-based single crystal superalloys: a physical-constrained neural network for creep rupture life prediction. Mater. Design. 2023, 232, 112174.
22. Xin, Y.; Zhong, Z.; Xie, A.; Luo, F.; Qiu, G.; Wang, Z. Building an effective deep learning model for mechanical properties prediction of steel. Mater. Lett. 2026, 402, 139262.
23. Kannan, R.; Nandwana, P. Accelerated alloy discovery using synthetic data generation and data mining. Scr. Mater. 2023, 228, 115335.
24. Wei, X.; van der Zwaag, S.; Jia, Z.; Wang, C.; Xu, W. On the use of transfer modeling to design new steels with excellent rotating bending fatigue resistance even in the case of very small calibration datasets. Acta. Mater. 2022, 235, 118103.
25. Ren, D.; Wang, C.; Wei, X.; Lai, Q.; Xu, W. Building a quantitative composition-microstructure-property relationship of dual-phase steels via multimodal data mining. Acta. Mater. 2023, 252, 118954.
26. Wu, J.; Torresi, L.; Hu, M.; et al. Inverse design workflow discovers hole-transport materials tailored for perovskite solar cells. Science 2024, 386, 1256-64.
27. Xu, P.; Chang, D.; Lu, T.; Li, L.; Li, M.; Lu, W. Search for ABO3 type ferroelectric perovskites with targeted multi-properties by machine learning strategies. J. Chem. Inf. Model. 2022, 62, 5038-49.
28. He, J.; Li, J.; Liu, C.; et al. Machine learning identified materials descriptors for ferroelectricity. Acta. Mater. 2021, 209, 116815.
29. Min, K.; Cho, E. Accelerated discovery of potential ferroelectric perovskite via active learning. J. Mater. Chem. C. 2020, 8, 7866-72.
30. Balachandran, P. V.; Kowalski, B.; Sehirlioglu, A.; Lookman, T. Experimental search for high-temperature ferroelectric perovskites guided by two-step machine learning. Nat. Commun. 2018, 9, 1668.
31. Liu, Q.; Polak, M. P.; Kim, S. Y.; et al. Beyond designer’s knowledge: generating materials design hypotheses via a large language model. Acta. Mater. 2025, 297, 121307.
32. Tian, S.; Jiang, X.; Wang, W.; et al. Steel design based on a large language model. Acta. Mater. 2025, 285, 120663.
33. Wang, P.; Jiang, Y.; Liao, W.; et al. Generalizable descriptors for automatic titanium alloys design by learning from texts via large language model. Acta. Mater. 2025, 296, 121275.
34. Polak, M. P.; Morgan, D. Extracting accurate materials data from research papers with conversational language models and prompt engineering. Nat. Commun. 2024, 15, 1569.
35. Senior, A. W.; Evans, R.; Jumper, J.; et al. Improved protein structure prediction using potentials from deep learning. Nature 2020, 577, 706-10.
36. Tep, P.; Bernacki, M. High-fidelity grain growth modeling: leveraging deep learning for fast computations. Acta. Mater. 2025, 301, 121486.
37. Yang, H.; Wang, W.; Li, C.; et al. Deep learning-based X-ray computed tomography image reconstruction and prediction of compression behavior of 3D printed lattice structures. Addit. Manuf. 2022, 54, 102774.
38. Lundberg, S.; Lee, S. I. A unified approach to interpreting model predictions. arXiv 2017, arXiv:1705.07874. https://doi.org/10.48550/arXiv.1705.07874. (accessed 2026-05-21).
39. Ribeiro, M. T.; Singh, S.; Guestrin, C. “Why should I trust you?”: Explaining the predictions of any classifier. arXiv 2016, arXiv:1602.04938. https://doi.org/10.48550/arXiv.1602.04938. (accessed 2026-05-21).
40. Alibagheri, E.; Ranjbar, A.; Khazaei, M.; Kühne, T. D.; Vaez Allaei, S. M. Remarkable optoelectronic characteristics of synthesizable square‐octagon haeckelite structures: machine learning materials discovery. Adv. Funct. Mater. 2024, 34, 2402390.
41. Xu, H.; Sun, X.; Peng, R. L.; et al. Machine learning enabled the prediction of γ′-depleted depth during interdiffusion of bond-coated IN792 superalloy. Surf. Coat. Technol. 2025, 513, 132448.
42. Chen, W.; Hilhorst, A.; Bokas, G.; Gorsse, S.; Jacques, P. J.; Hautier, G. A map of single-phase high-entropy alloys. Nat. Commun. 2023, 14, 2856.
43. Pearson, K. LIII. On lines and planes of closest fit to systems of points in space. Lond. Edinb. Dublin. Philos. Mag. J. Sci. 1901, 2, 559-72.
44. Srinivasan, S.; Broderick, S. R.; Zhang, R.; et al. Mapping chemical selection pathways for designing multicomponent alloys: an informatics framework for materials design. Sci. Rep. 2015, 5, 17960.
45. Tenenbaum, J. B.; de Silva, V.; Langford, J. C. A global geometric framework for nonlinear dimensionality reduction. Science 2000, 290, 2319-23.
46. McInnes, L.; Healy, J.; Melville, J. UMAP: uniform manifold approximation and projection for dimension reduction. arXiv 2018, arXiv:1802.03426. https://doi.org/10.48550/arXiv.1802.03426. (accessed 2026-05-21).
47. Zhao, S.; Li, J.; Wang, J.; Lookman, T.; Yuan, R. Closed-loop inverse design of high entropy alloys using symbolic regression-oriented optimization. Mater. Today. 2025, 88, 263-71.
48. Xue, D.; Xue, D.; Yuan, R.; et al. An informatics approach to transformation temperatures of NiTi-based shape memory alloys. Acta. Mater. 2017, 125, 532-41.
49. Pokorny, V. J.; Sponheim, S. R.; Rawls, E. Impact of reduced-dimensionality independent components analysis on event-related potential measurements. Psychophysiology 2023, 60, e14223.
50. Miracle, D.; Senkov, O. A critical review of high entropy alloys and related concepts. Acta. Mater. 2017, 122, 448-511.
51. Zhang, Y.; Wen, C.; Wang, C.; et al. Phase prediction in high entropy alloys with a rational selection of materials descriptors and machine learning models. Acta. Mater. 2020, 185, 528-39.
52. Machaka, R.; Motsi, G. T.; Raganya, L. M.; Radingoana, P. M.; Chikosha, S. Machine learning-based prediction of phases in high-entropy alloys: a data article. Data. Brief. 2021, 38, 107346.
53. Xue, D.; Balachandran, P. V.; Hogden, J.; Theiler, J.; Xue, D.; Lookman, T. Accelerated search for materials with targeted properties by adaptive design. Nat. Commun. 2016, 7, 11241.
54. Schölkopf, B.; Smola, A.; Müller, K. Nonlinear component analysis as a kernel eigenvalue problem. Neural. Comput. 1998, 10, 1299-319.
55. Roweis, S. T.; Saul, L. K. Nonlinear dimensionality reduction by locally linear embedding. Science 2000, 290, 2323-6.
56. Hefner, R. Warren S. Torgerson, Theory and methods of scaling. New York: John Wiley and Sons, Inc., 1958. Pp. 460. Syst. Res. 1959, 4, 245-7.
57. Tao, Q.; Xu, P.; Li, M.; Lu, W. Machine learning for perovskite materials design and discovery. npj. Comput. Mater. 2021, 7, 495.
58. Zhang, Y.; Zhou, Y.; Lin, J.; Chen, G.; Liaw, P. Solid‐solution phase formation rules for multi‐component alloys. Adv. Eng. Mater. 2008, 10, 534-8.
59. Zhang, Y.; Zuo, T. T.; Tang, Z.; et al. Microstructures and properties of high-entropy alloys. Prog. Mater. Sci. 2014, 61, 1-93.
60. Zarinejad, M.; Liu, Y. Dependence of transformation temperatures of NiTi‐based shape‐memory alloys on the number and concentration of valence electrons. Adv. Funct. Mater. 2008, 18, 2789-94.
61. Liu, Y.; Fu, X.; Yu, Q.; Zhang, M.; Liu, J. Significant reduction of phase-transition hysteresis for magnetocaloric (La1-xCex)2Fe11Si2Hy alloys by microstructural manipulation. Acta. Mater. 2021, 207, 116687.
62. Zhou, Y.; Cheng, J.; Hong, M.; et al. Orchestrating phase transition in GeTe thermoelectrics: an investigation into the role of electronegativity. Nano. Energy. 2024, 127, 109723.
63. Zurcher, R.; Muller, M.; Sachslehner, F.; Groger, V.; Zehetbauer, M. Dislocation resistivity in Cu: dependence of the deviations from Matthiessen’s rule on temperature, dislocation density and impurity content. J. Phys. Condens. Matter. 1995, 7, 3515-28.
64. Žnidarič, M. Modified Matthiessen’s rule: more scattering leads to less resistance. Phys. Rev. B. 2022, 105, 045140.
Cite This Article
How to Cite
Download Citation
Export Citation File:
Type of Import
Tips on Downloading Citation
Citation Manager File Format
Type of Import
Direct Import: When the Direct Import option is selected (the default state), a dialogue box will give you the option to Save or Open the downloaded citation data. Choosing Open will either launch your citation manager or give you a choice of applications with which to use the metadata. The Save option saves the file locally for later use.
Indirect Import: When the Indirect Import option is selected, the metadata is displayed and may be copied and pasted as needed.
About This Article
Special Topic
Copyright

Data & Comments
Data
0


Comments
Comments must be written in English. Spam, offensive content, impersonation, and private information will not be permitted. If any comment is reported and identified as inappropriate content by OAE staff, the comment will be removed without notice. If you have any queries or need any help, please contact us at [email protected].