


fig2
From: Intelligent visualization-driven materials design via two-dimensional symbolic feature generation
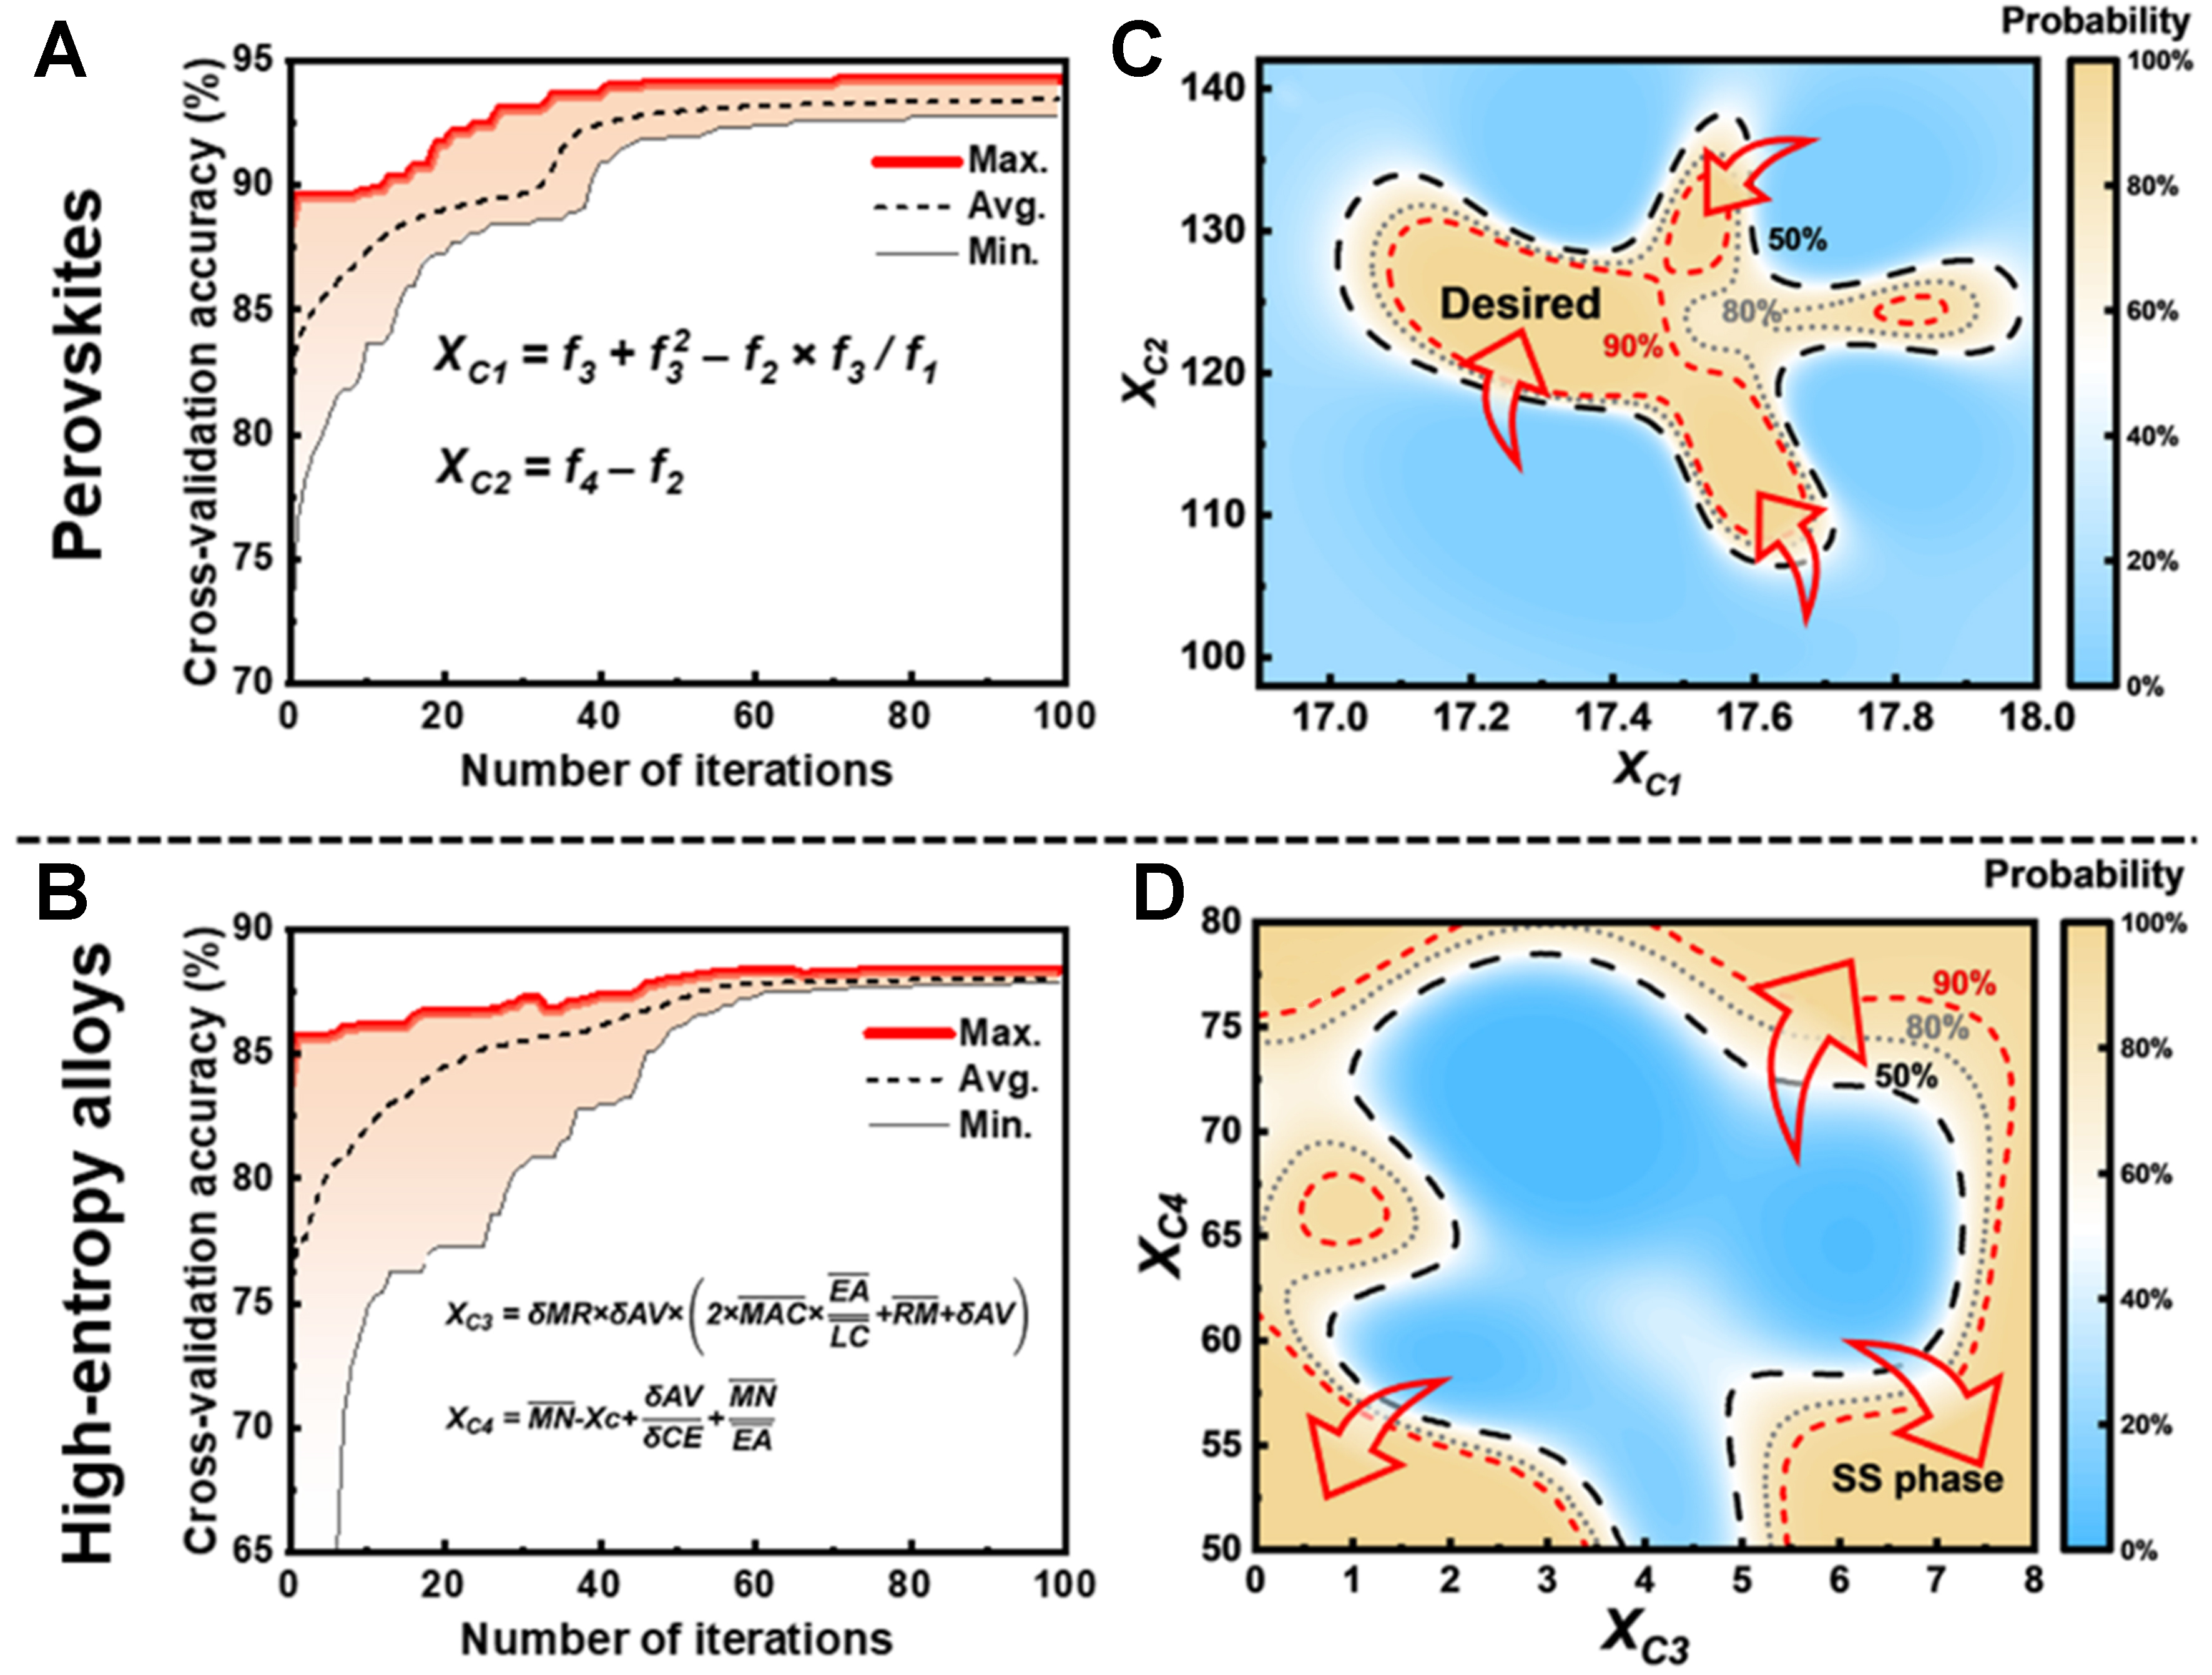
Figure 2. Application of the 2D-SFG method to classification tasks. (A and B) Iterative feature generation process; the red curve indicates the variation in optimal performance within the population; (C and D) Classification probability maps; the red arrows indicate the direction of increasing probability for the target property. 2D-SFG: Two-dimensional symbolic feature generation.


