


fig3
From: Intelligent visualization-driven materials design via two-dimensional symbolic feature generation
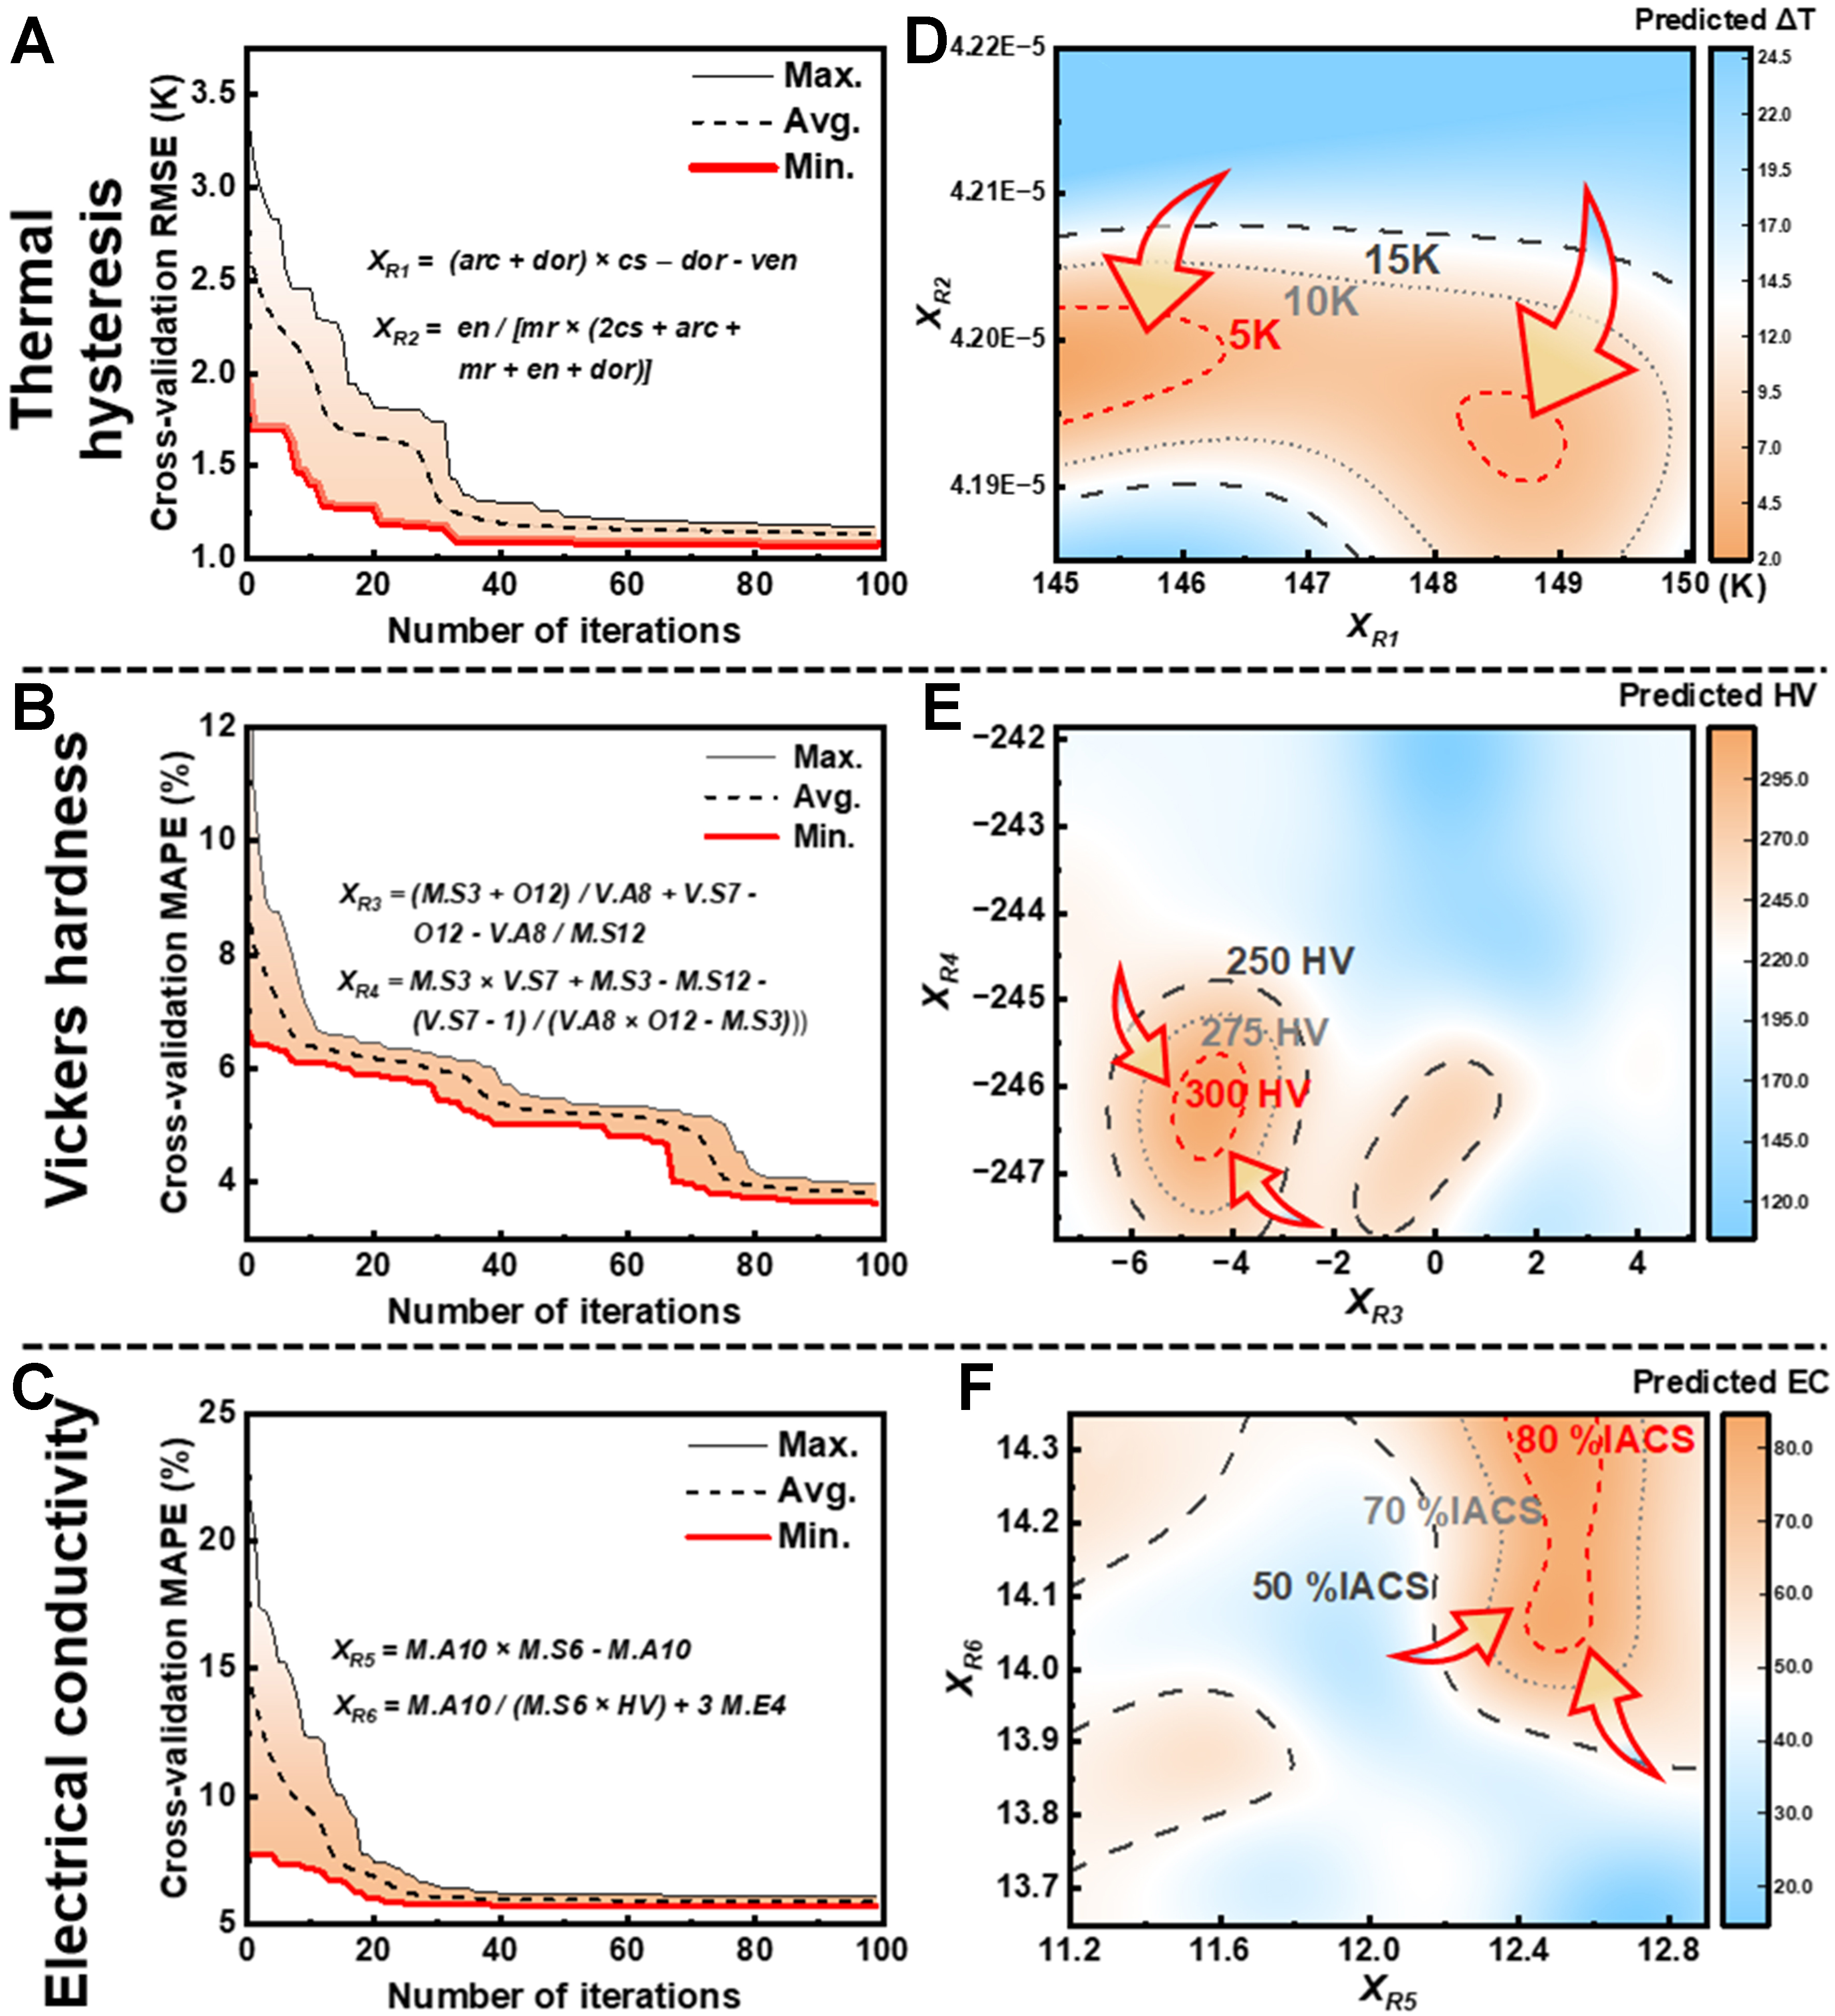
Figure 3. Application of the 2D-SFG method to regression tasks. (A-C) Iterative feature generation process; the red curve indicates the vibration in optimal performance within the population; (D-F) Contour maps of alloy properties; the red arrows indicate the gradient variation of the target property. 2D-SFG: Two-dimensional symbolic feature generation; RMSE: root mean square error; MAPE: mean absolute percentage error.


