


Application of deep learning for predicting carbon segregation in large-diameter continuously cast steel billets
 0
0 Abstract
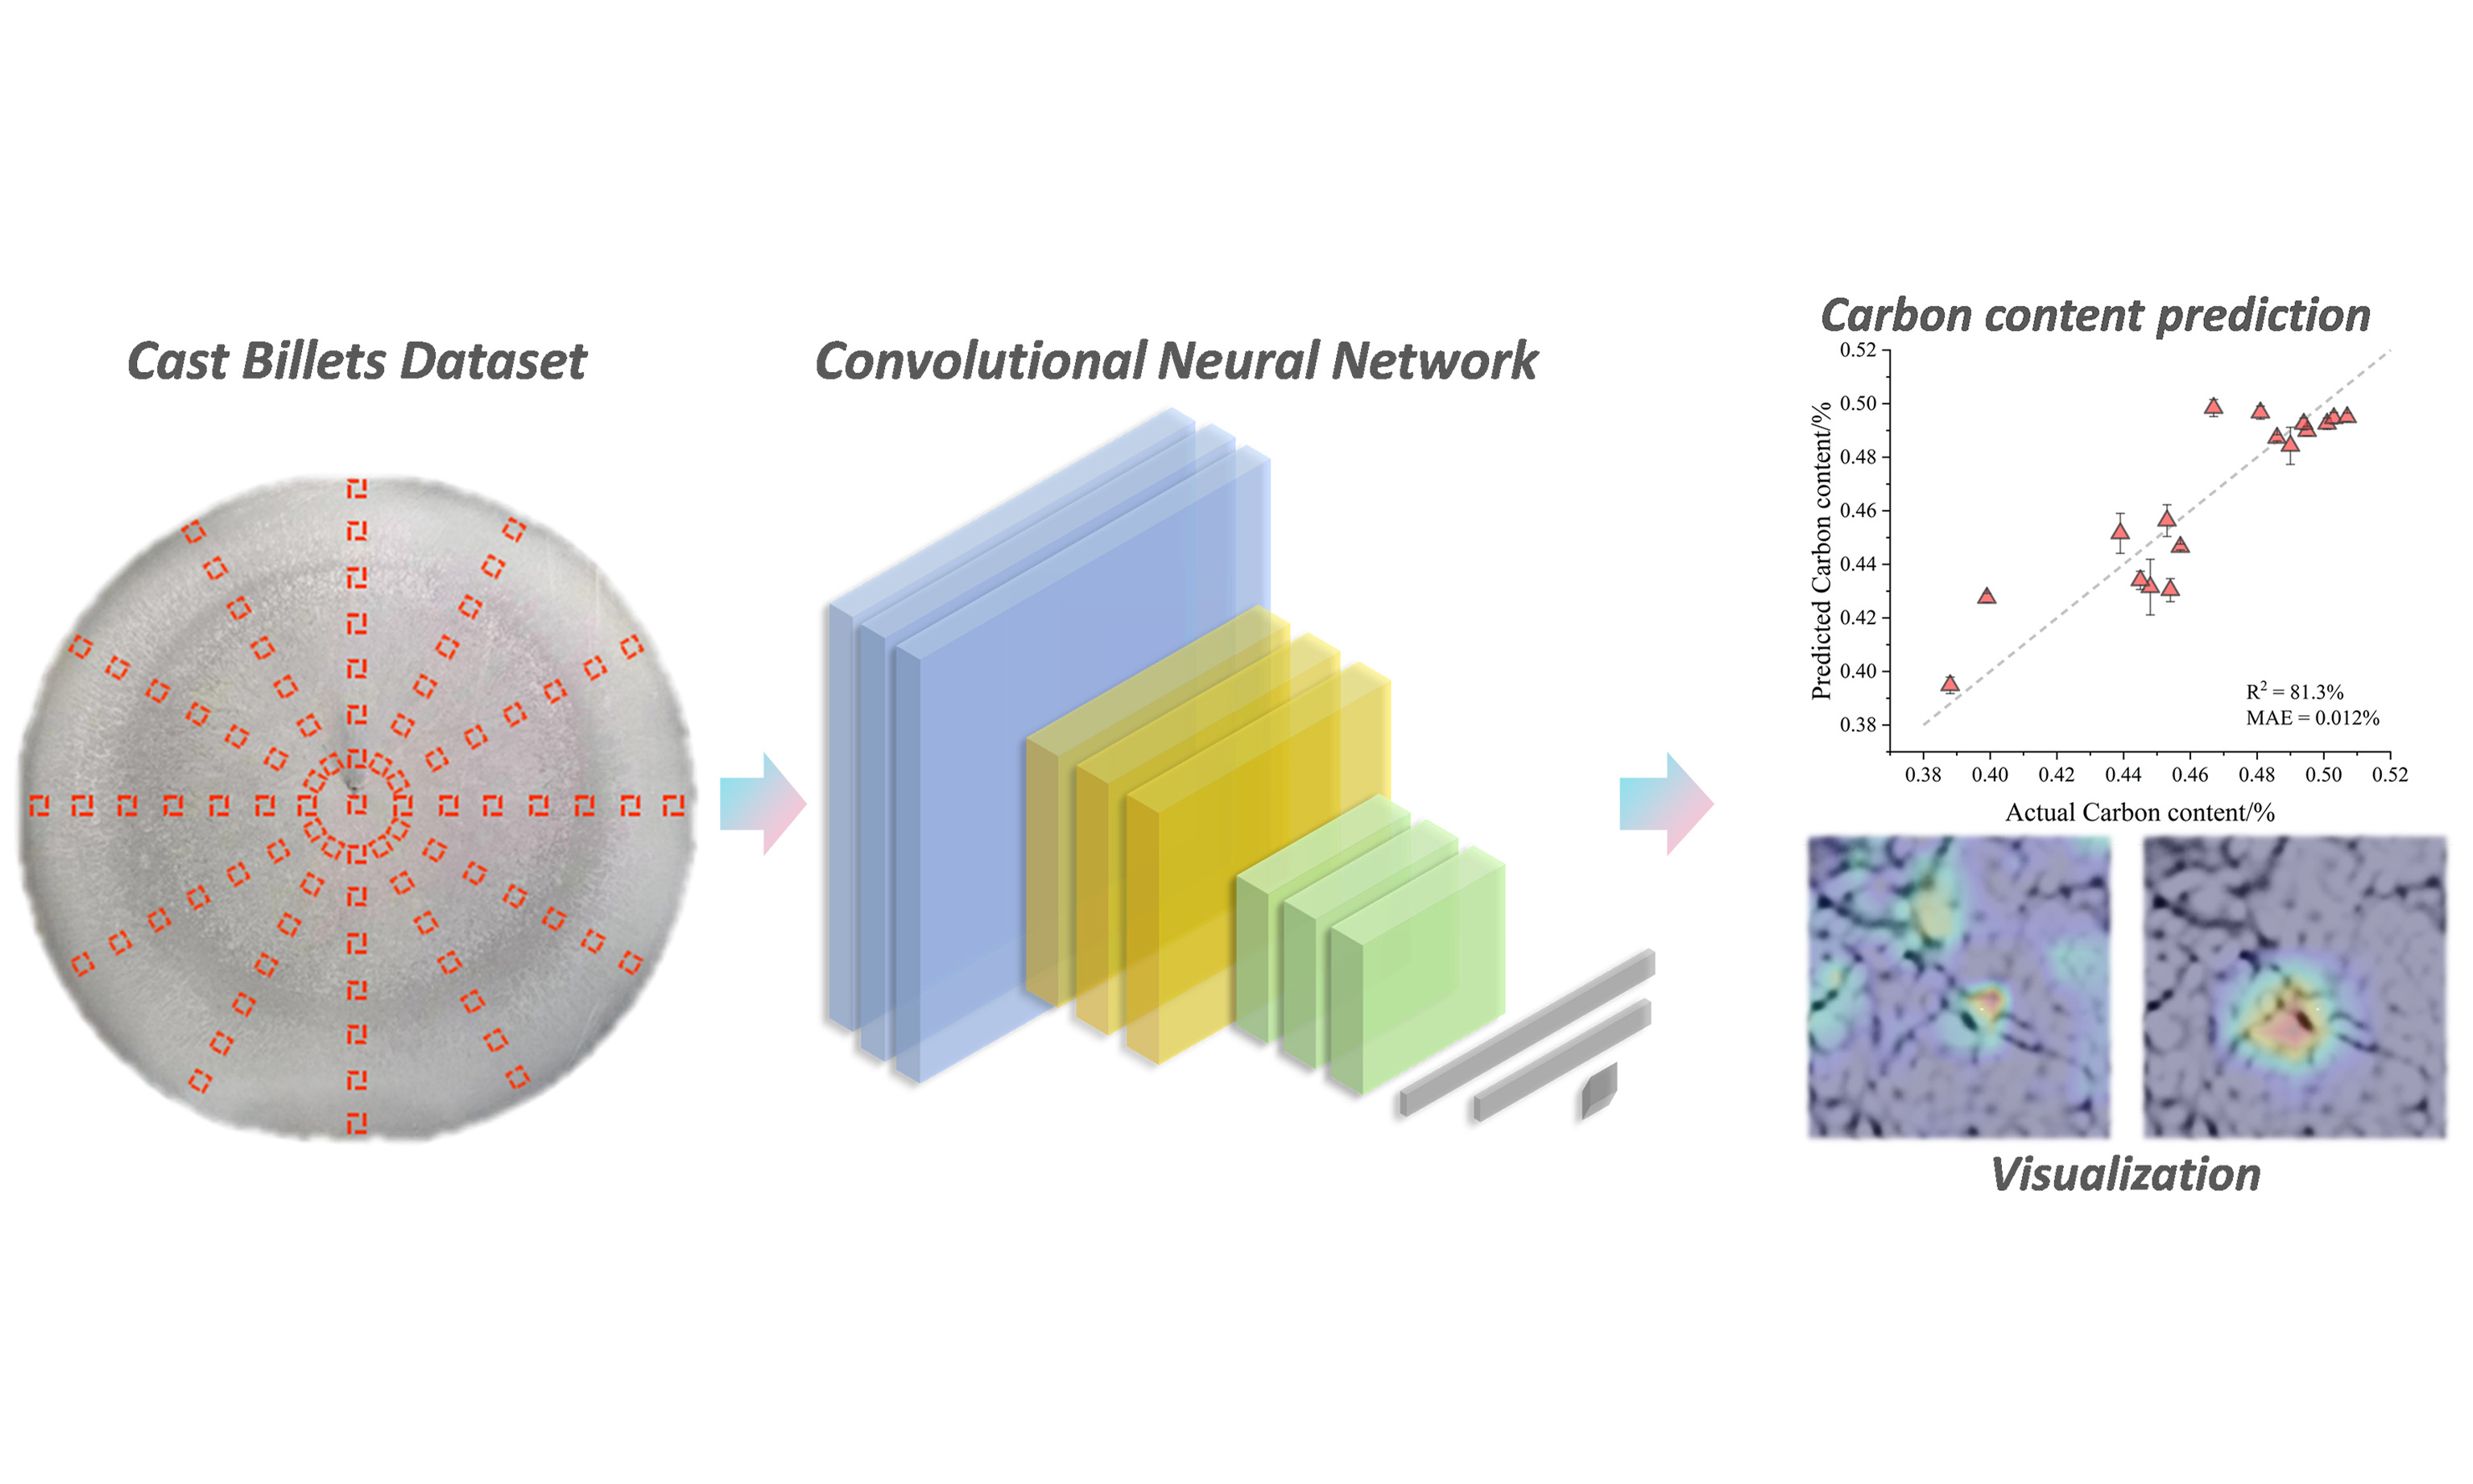
Carbon segregation is a persistent defect in continuous casting of large-diameter steel billets, leading to deteriorated mechanical properties and compromised service reliability. Conventional empirical or machine learning models generally estimate segregation indices but cannot resolve local variations of carbon distribution across billet sections. In this work, a microstructure-informed convolutional neural network (CNN) framework is proposed to predict and map carbon segregation in 600 mm round 42CrMo steel billets. A comprehensive dataset comprising microstructural images and corresponding carbon content measurements was established. The customized CNN achieved a testing accuracy of 81.3% with a mean absolute error of 0.012 wt.% and showed good robustness in out-of-sample validation. Compared with transfer learning models (VGG16, VGG19, etc.), the customized architecture exhibited superior generalization on this domain-specific dataset. Contrast-enhanced imaging significantly improved predictive performance, while Gradient-weighted Class Activation Mapping visualizations highlighted key microstructural regions correlated with carbon distribution, providing interpretability. This study demonstrates a proof-of-concept methodology to achieve quantitative mapping of segregation patterns in large-diameter 42CrMo billets, offering a complementary tool to traditional metallurgical analysis and providing a workflow that may support future data-driven research on segregation formation mechanisms and process optimization in steel casting when extended to additional steels and casting conditions.
Keywords
INTRODUCTION
The continuous casting of steel is a critical process in modern steel production, in which molten metal solidifies into a semi-finished billet, bloom, or slab for subsequent rolling in finishing mills. A major challenge in this process is the occurrence of defects, particularly carbon segregation, which significantly affects the mechanical properties and quality of the final product[1,2]. Carbon segregation occurs when the distribution of carbon within the steel matrix becomes uneven during solidification, leading to areas with higher or lower carbon concentrations than desired. This phenomenon can cause detrimental effects, such as reduced ductility and increased brittleness, and ultimately compromise the structural integrity of the material.
Conventionally, the prediction and control of carbon macrosegregation have relied on empirical models based on theoretical assumptions and limited experimental data[3-7]. Dong et al.[8] developed a macroscopic segregation model based on a continuum mechanical framework. This model couples the fluid flow, heat transfer, and solute transport to predict the evolution of macroscopic segregation during the casting of round billets. This study provides a comprehensive approach for understanding and controlling carbon segregation by integrating the interactions between fluid dynamics and solute redistribution during solidification. Hatič et al.[9] established a multi-physics numerical model to predict macrosegregation in direct-chill casting. Despite their success, the conventional methods described above lack generalizability and reliability and may not capture the complex interplay between factors influencing the carbon distribution within castings. Moreover, post-processing inspection techniques, including chemical analyses and microstructural examinations, are often time-consuming, expensive, and limited in their ability to provide real-time feedback during casting. Hence, there is a need for innovative approaches that can offer timely and accurate predictions of carbon segregation to facilitate immediate corrective actions and improve the overall production efficiency.
In recent years, advancements in machine learning have shown great potential in addressing complex problems across various domains including materials science and manufacturing[10-14]. For example, machine learning can be used to evaluate mechanical properties and further enable alloy design[15-20] and process optimization[21,22]. Recently, some studies have utilized machine learning to predict defects in cast billets. Zou et al.[23] proposed a data-driven regularized extreme learning machine (R-ELM) model to predict the carbon segregation index. Another model based on a principal component analysis and a deep neural network was established to assess internal cracks[24]. Although a relatively accurate mapping relationship between the continuous casting parameters and defects was established, the internal carbon or crack distribution within the billet could not be determined.
Deep learning methods, such as convolutional neural networks (CNNs), have shown tremendous potential, with remarkable success in image-processing tasks owing to their ability to automatically extract and learn hierarchical features from raw image data. Currently, they have been successfully applied to establish composition-structure-property relationships in steels[25-31]. Yang et al. proposed a CNN model to predict the thermodynamic properties of steels[32]. Recently, several studies have explored the use of CNNs in metallurgical applications, e.g., to determine the temperature distribution and defects in continuously cast billets. Lee et al. proposed a spatial and sequential deep learning approach to predict the temperature distribution in a continuous casting process[33]. Lu et al. built a real-time prediction model using the deep learning technology to forecast the 3D temperature field distribution in continuous casting, enabling the intelligent adaptation of operating parameters[34]. Lian et al. used the UNet-VGG16 transfer learning model for a semantic segmentation of central shrinkage defects in continuously cast billets[35]. The above research indicates that utilizing deep learning for defect detection and prediction in metallurgical processes is a promising approach for enhancing quality control measures in steel production. However, the focus has often been on surface defects or other types of anomalies, such as central shrinkage or cracking. The prediction of internal composition variations, such as carbon segregation, poses additional challenges due to the complexity of the solidification process and the subtle nature of the compositional differences that may not be apparent using standard imaging techniques.
To address this gap, the present work focused on the application of CNNs for predicting carbon segregation defects in continuously cast steel billets. Specifically, we propose a CNN-based prediction model that takes low-magnification images of billet cross sections as input and predicts the carbon content at specific locations within the billet. The present study is deliberately restricted to 600 mm round 42CrMo billets produced on a single industrial casting line and should be regarded as a proof-of-concept demonstration rather than a fully generalized solution. By training the model on a dataset comprising labeled images and corresponding carbon content measurements, we aim to explore whether spatially resolved segregation patterns can be inferred from routine metallographic images. In addition, we discuss how such an image-driven framework could ultimately complement conventional segregation assessment and process optimization once it is extended and validated across broader alloy systems and process conditions.
MATERIALS AND METHODS
Dataset establishment and data preprocessing
In this study, a dataset comprising microstructural images of the cross-sections of continuously cast billets and the corresponding carbon contents at these sections was established. Samples of 42CrMo steel billets with a diameter of 600 mm produced in industrial settings were collected. After etching the cross sections of these billets, low-magnification images were captured to ensure a clear visualization of the microstructural features. Subsequently, 85 evenly distributed points on each cross-section were selected, and the carbon content at each point was measured using a carbon-sulfur analyzer. Figure 1A shows the locations of the selected points. A corresponding microstructural image with a size of 224 × 224 pixels was captured at each carbon content measurement point. The precise locations of these points were marked to accurately correlate the carbon content measurements with the corresponding microstructural features. Data augmentation techniques were employed to enrich the image dataset and enhance the robustness of the model. The augmentation strategies included the rotation and mirroring of the images, as illustrated in Figure 1B-I. These techniques effectively improved the diversity of the training samples and a total of 650 microstructural images were obtained. It is also recognized that rotation and mirroring augmentations, while commonly used, do not generate fully independent samples, as images from the same spatial location may still share correlated features. An ablation comparison was further performed to evaluate the effect of augmentation. The results showed that augmentation provided a measurable regularization benefit
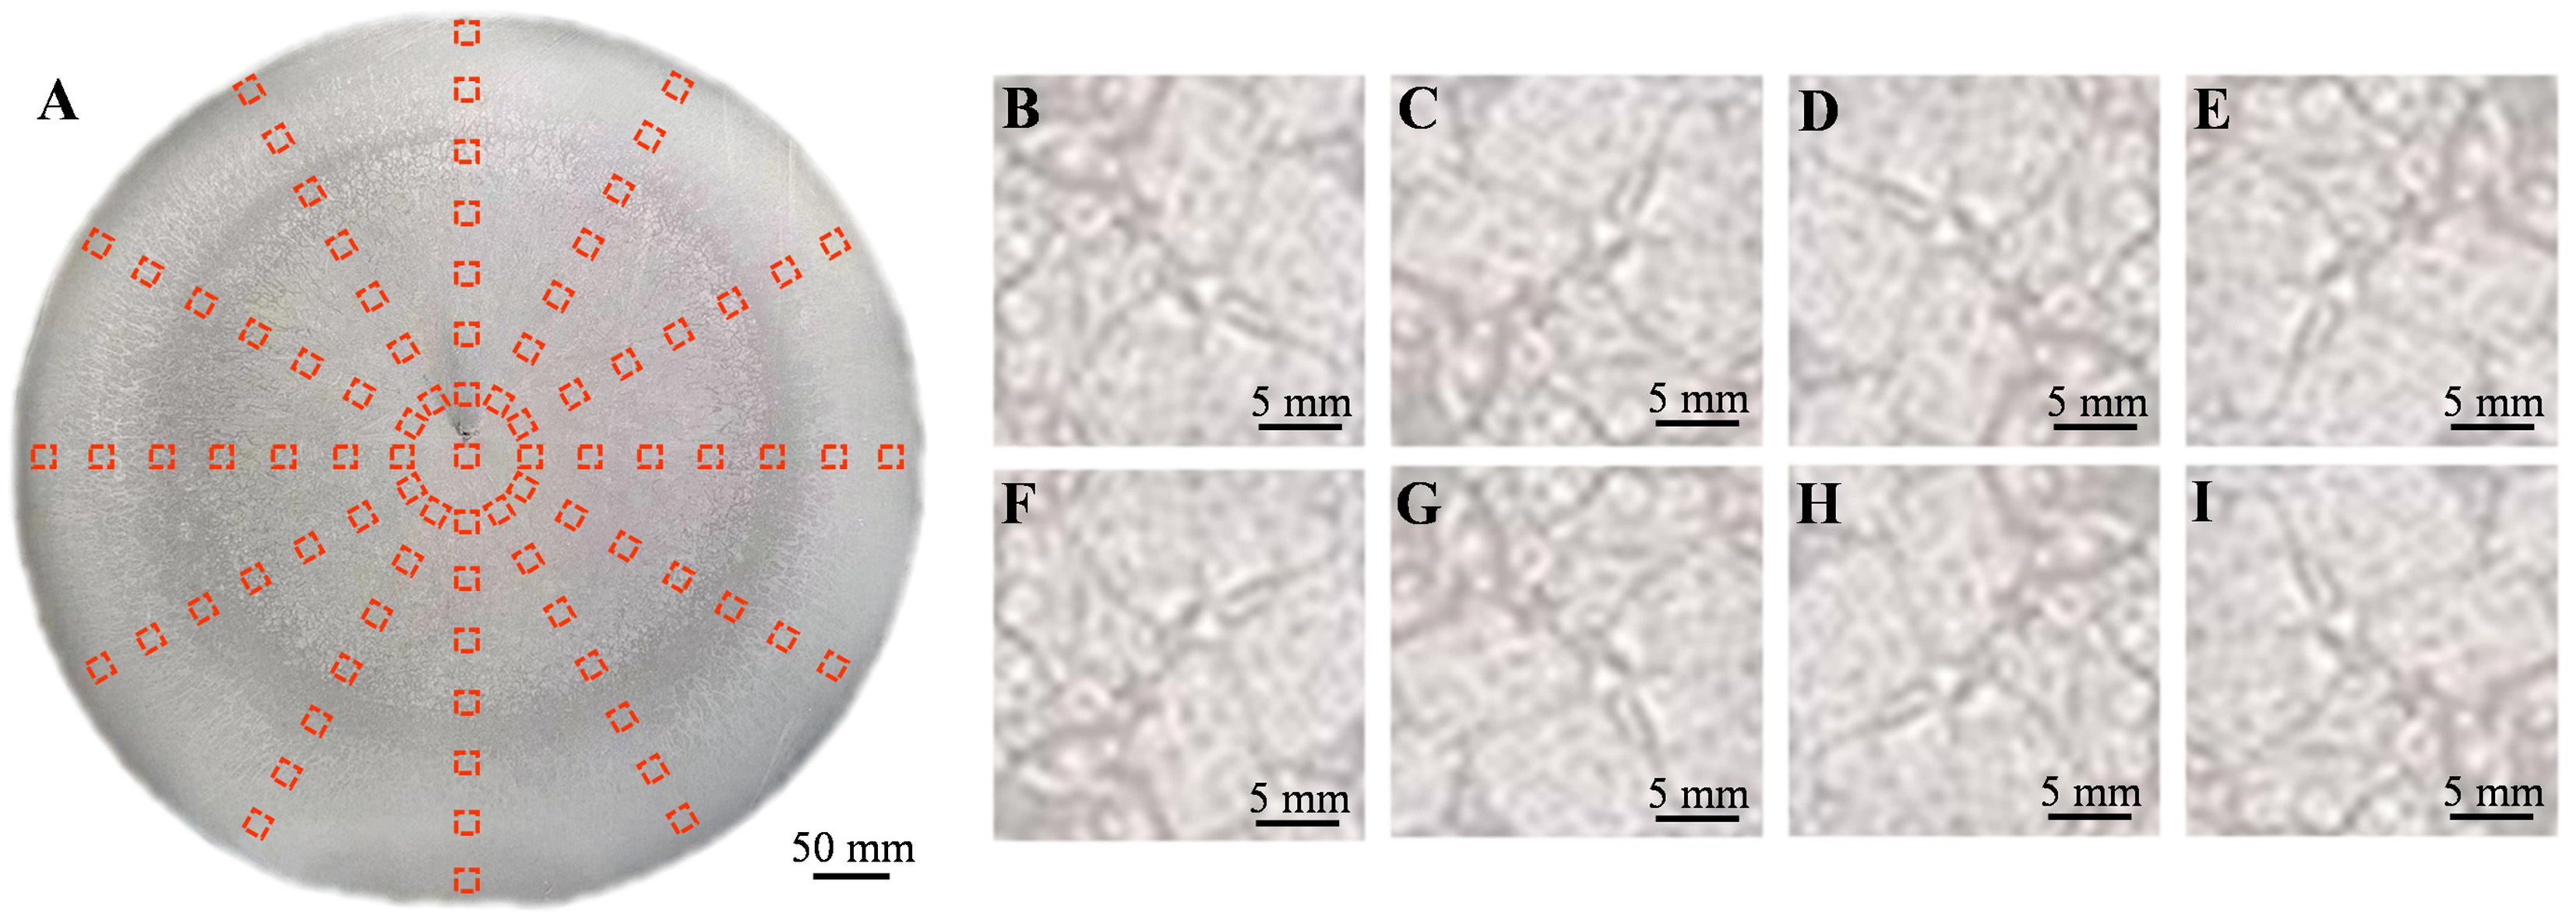
Figure 1. Construction of a dataset containing images of 42CrMo steel billets. (A) Low-magnification microstructural image and sampling points at the cross-section of the cast billet; (B) Original sub-image at one sampling point; (C) 90° rotation of (B); (D) 180° rotation of (B); (E) 270° rotation of (B); (F) Mirror image of (B); (G) Mirror image of (C); (H) Mirror image of (D); (I) Mirror image of (E).
Figure 2A shows the distribution of the carbon content across the 85 sampling points. The carbon content generally increased from the edges toward the center of the cross section. The central region exhibited a higher carbon content, while the peripheral regions showed lower values, indicating the presence of carbon segregation at the billet cross section. This distribution pattern well correlated with the structural zones at the billet cross-section, with columnar grains near the edges and equiaxed grains at the center. To facilitate model training and evaluation, the dataset was randomly divided into two subsets: training and testing. The training set comprising 80% of the data was used to train the model parameters. The testing set, comprising the remaining 20% of the data unseen during model development, was reserved to evaluate the performance and generalizability of the model. This data-splitting process was repeated randomly 5 times to obtain statistical results. Figure 2B shows the carbon content distribution in both the training and testing sets under one split, demonstrating a good fit to the independent and identically distributed principle. During training, 10% of the samples in the training set were randomly selected as the validation set to optimize the hyperparameters of the model.
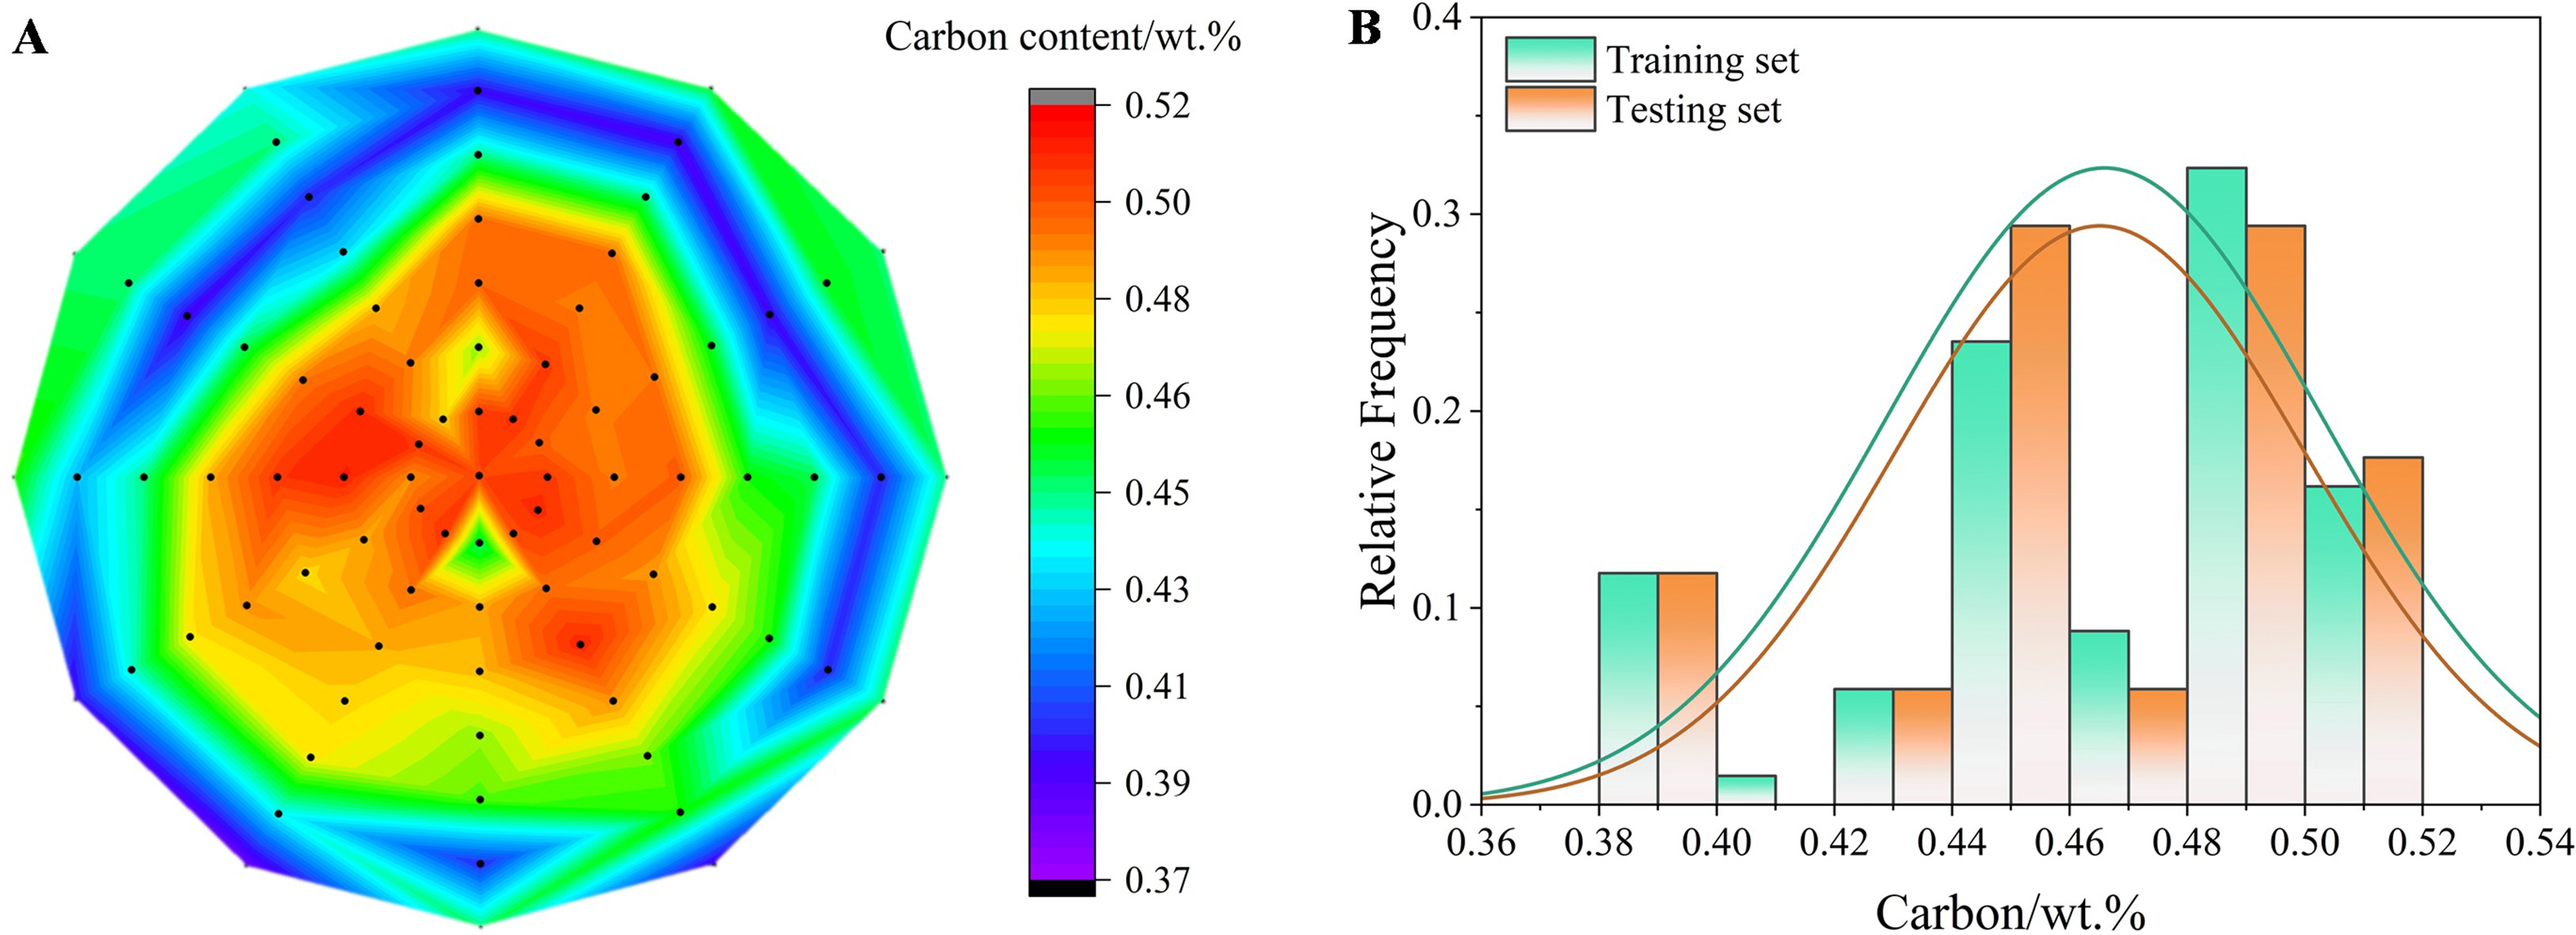
Figure 2. (A) Distribution of the carbon content over the cross-section of the billet; (B) Distribution of the carbon content in the training and testing sets.
CNN modeling
In this study, a deep CNN was designed and implemented to predict the carbon content of continuously cast billets using low-magnification microstructural images. The network, which is based on a sequential model, includes multiple convolutional layers followed by fully connected layers, as shown in Figure 3. The input is an image representing a low-magnification microstructure. The CNN starts with two convolutional layers with 32 filters (size: 3 × 3), producing an output of 32 feature maps, followed by a max-pooling layer with a pooling size of 2 × 2, thereby reducing the spatial dimensions by half. This pattern continues with increasing filter sizes and additional maximum pooling layers, reducing the spatial dimensions while increasing the feature map depth. The subsequent layers have 64, 128, 256, 512, and 1,024 filters, with the corresponding max-pooling layers further reducing the dimensions. The output from the final convolutional layer is flattened into a 1D vector, which is then passed through a series of fully connected layers with dropout to prevent overfitting. The dense layers include 256, 128, 64, 32, and 16 units, each followed by a dropout layer at a rate of 0.2. The final dense layer has a single unit with linear activation to predict the carbon content.
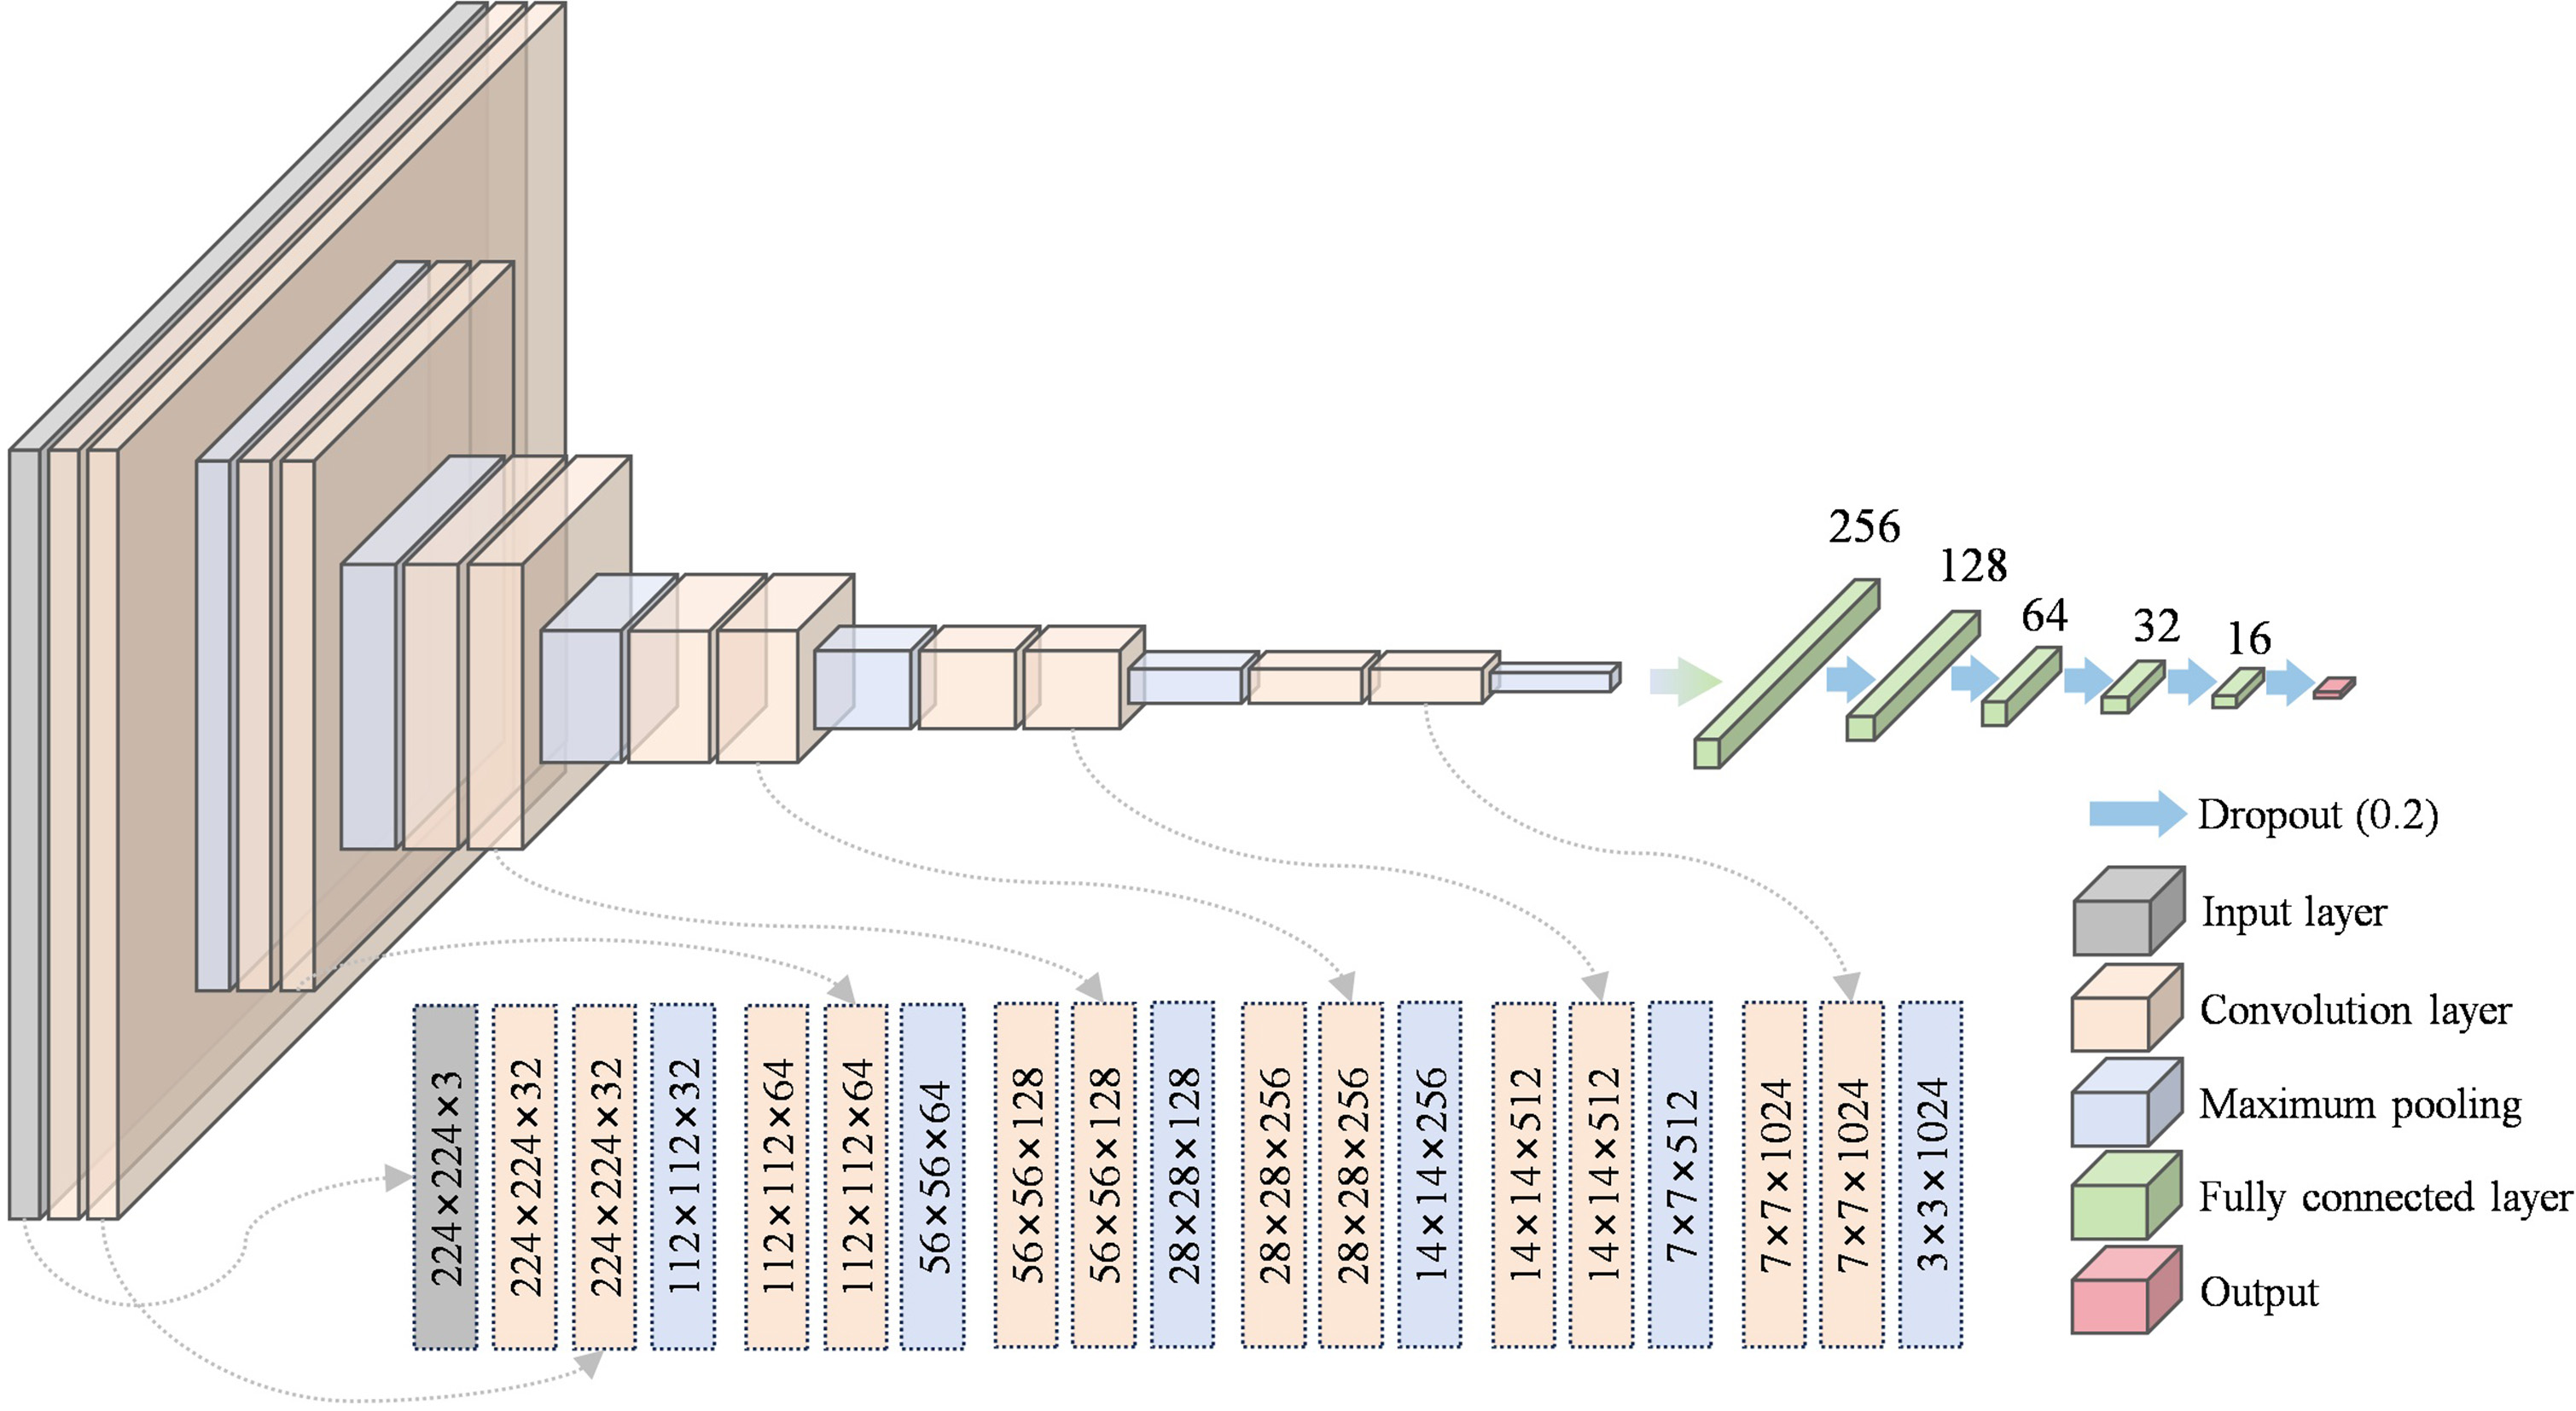
Figure 3. Architecture of the convolutional neural network developed in this work.
The architectural configuration was selected through iterative adjustments of depth and width to balance feature expressiveness and generalization. The goal is to leverage hierarchical feature extraction for predicting the spatial distribution of carbon in continuously cast billets and to address challenges in modeling carbon segregation from metallographic images. Although the full layer configuration is reported for reproducibility, the model’s effective capacity is constrained by strong regularization (dropout) and early stopping based on validation loss, which together mitigate over-parameterization under limited data while preserving hierarchical texture learning. Additionally, L2 weight decay was explored during hyperparameter tuning, with λ ∈ [1 × 10⁻⁵, 1 × 10⁻³]. A mild regularization level (λ = 1 × 10⁻⁴) yielded slightly improved validation stability but did not reduce test-set mean absolute error (MAE) compared with using dropout alone. Therefore, dropout was retained as the primary regularization strategy in the final model configuration, though L2/L1 regularization may become more beneficial as broader datasets are incorporated in future extensions. It is emphasized that the architectural components themselves are standard; the contribution of this work lies in tailoring the network depth, width, and regularization strategy to the specific task of inferring local carbon content from low-magnification etched images, and in embedding this model within a workflow that includes quantitative image quality optimization, systematic baseline comparison, and metallurgically informed interpretability analysis.
The model was trained to minimize the MAE between predicted and actual carbon content. The batch size was chosen from [16, 32, 64] to ensure stable convergence and feasible GPU memory usage. Optimization employed the Adam optimizer with an initial learning rate of 1 × 10⁻⁴, selected from a coarse search range of [1 × 10⁻⁵, 5 × 10⁻⁴]. Training was performed for up to 500 epochs, with early stopping (patience = 50). The best model checkpoint was selected according to the minimum validation MAE. The model was developed in Python using TensorFlow and Keras. The model performance was evaluated using the MAE and squared correlation coefficient (R2), given by[36]:
RESULTS AND DISCUSSION
Carbon content prediction
Figure 4 shows the performance of the optimal model. Figure 4A shows the training history of the model. The training loss decreased rapidly with increasing number of epochs and dropped to a low level after 200 epochs. Although there was slight overfitting, the loss for the testing set was as low as 0.04 after 500 epochs, and a sufficiently accurate model was obtained. Figure 4B shows the prediction results on the training set obtained by comparing the actual and predicted values. The majority of the data points are closely aligned along the line of slope 1, indicating that the model had been well-trained on the current dataset. The model successfully captured the underlying patterns and relationships within the training data and achieved a remarkable prediction R2 of 95.2%. Moreover, the minimal MAE of 0.006 wt.% underscored the high precision of the model in reproducing carbon content values across the training samples. Figure 4C shows the results on the testing set. Clearly, the carbon content in most of the samples in the testing set could be accurately predicted, with prediction deviations of up to 0.03% for only a few samples. The final R2 on the testing set was 81.3% with an MAE of 0.012 wt.%. The performance gap between the training and testing sets indicates that some overfitting still exists on the limited dataset. Under multiple random splits, the model’s mean test R2 is 78.4% ± 2.8%, and the mean MAE is 0.013 ± 0.001 wt.%, indicating that predictive stability is maintained across different splits. For comparison, several conventional machine-learning models trained on handcrafted image features achieved markedly lower performance, as summarized in Supplementary Table 2 and the Baseline comparison section in Supplementary Material. This indicates that the proposed end-to-end CNN, although architecturally standard, is better suited to capturing the nonlinear and spatially distributed microstructural cues that govern local carbon variations. Overall, these results demonstrate that the proposed model could relatively predict the carbon content at various positions across the billet cross section with good accuracy and stability under data-constrained conditions.
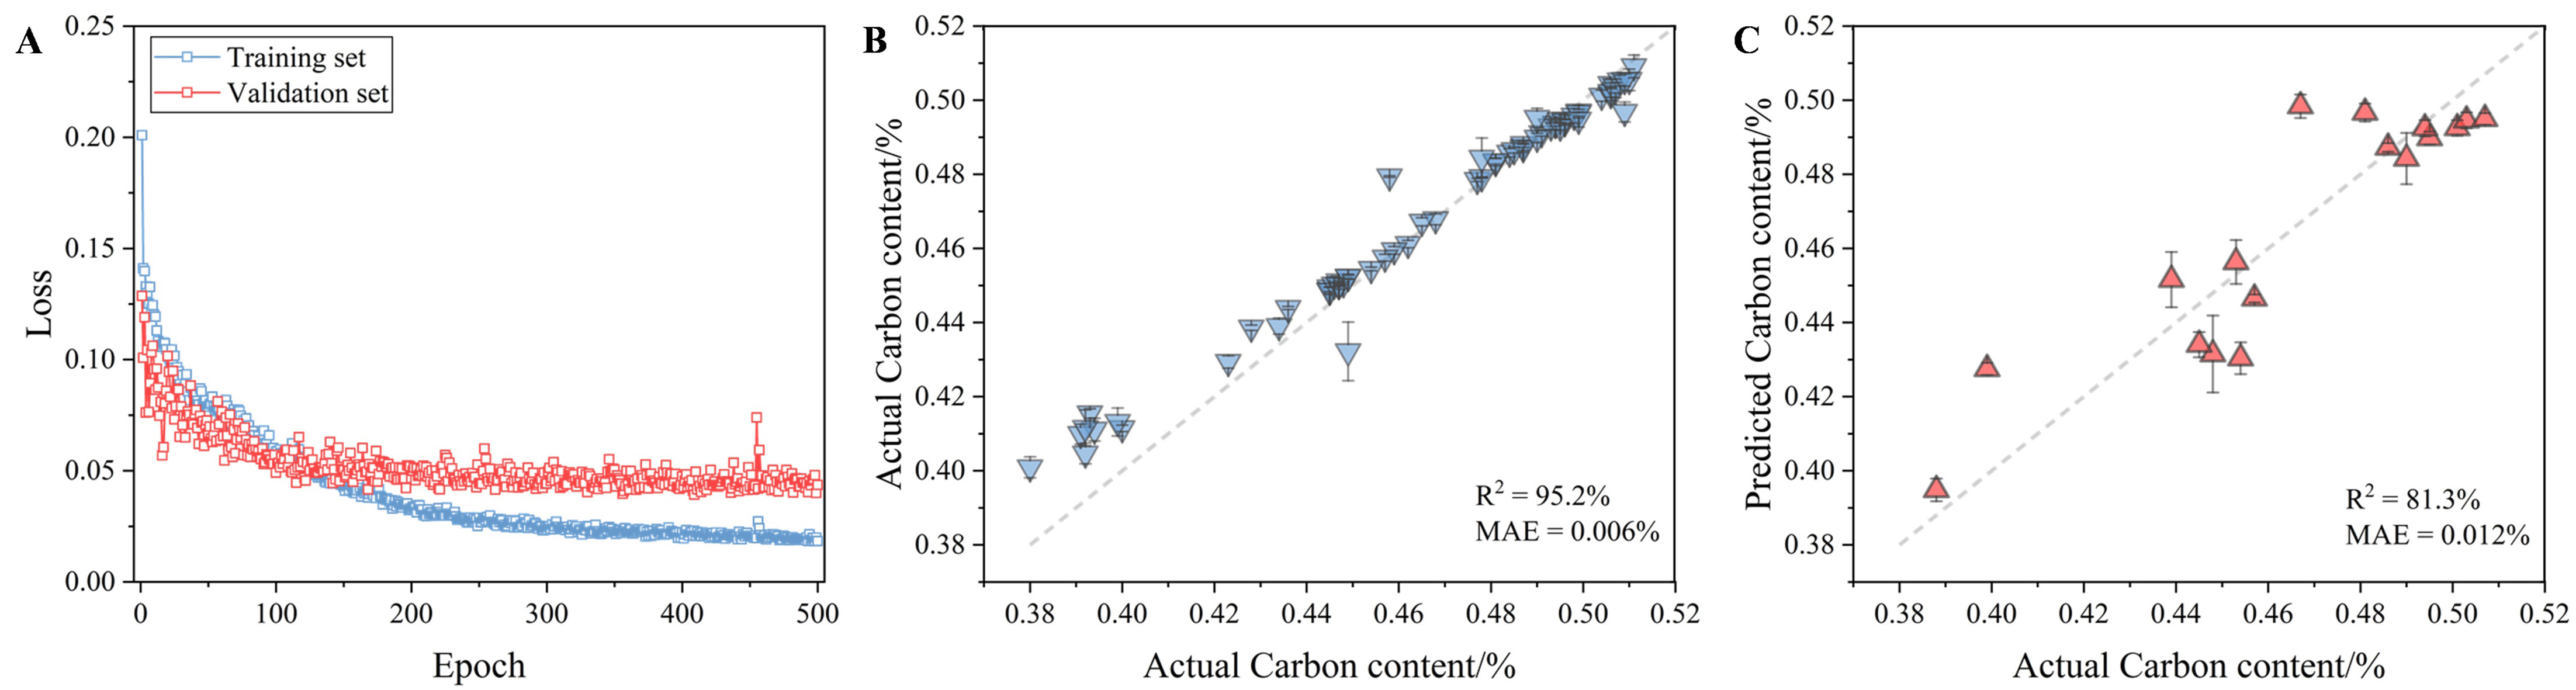
Figure 4. (A) Training history of the CNN model. Predicted versus actual carbon content for the (B) training set and (C) testing set. R2: Squared correlation coefficient; MAE: mean absolute error; CNN: convolutional neural network.
Figure 5 shows the distribution of the relative prediction errors (prediction error/actual value) for the carbon content at different positions in the cross-section of the 42CrMo billet. In most regions, particularly within the equiaxed crystal zone, the prediction errors were relatively low, whereas the columnar dendritic zone exhibited slightly higher deviations. This behavior can be attributed to the solidification conditions near the billet surface, where strong thermal gradients and directional dendrite growth promote interdendritic fluid flow and channel-type macrosegregation. Some sub-surface segregation features or porosity may not be fully resolved in low-magnification etched images, increasing the uncertainty of image-based prediction in these regions. In contrast, the equiaxed core generally exhibits more uniform dendrite morphology and solute redistribution, which is more consistently reflected in the micrographs.
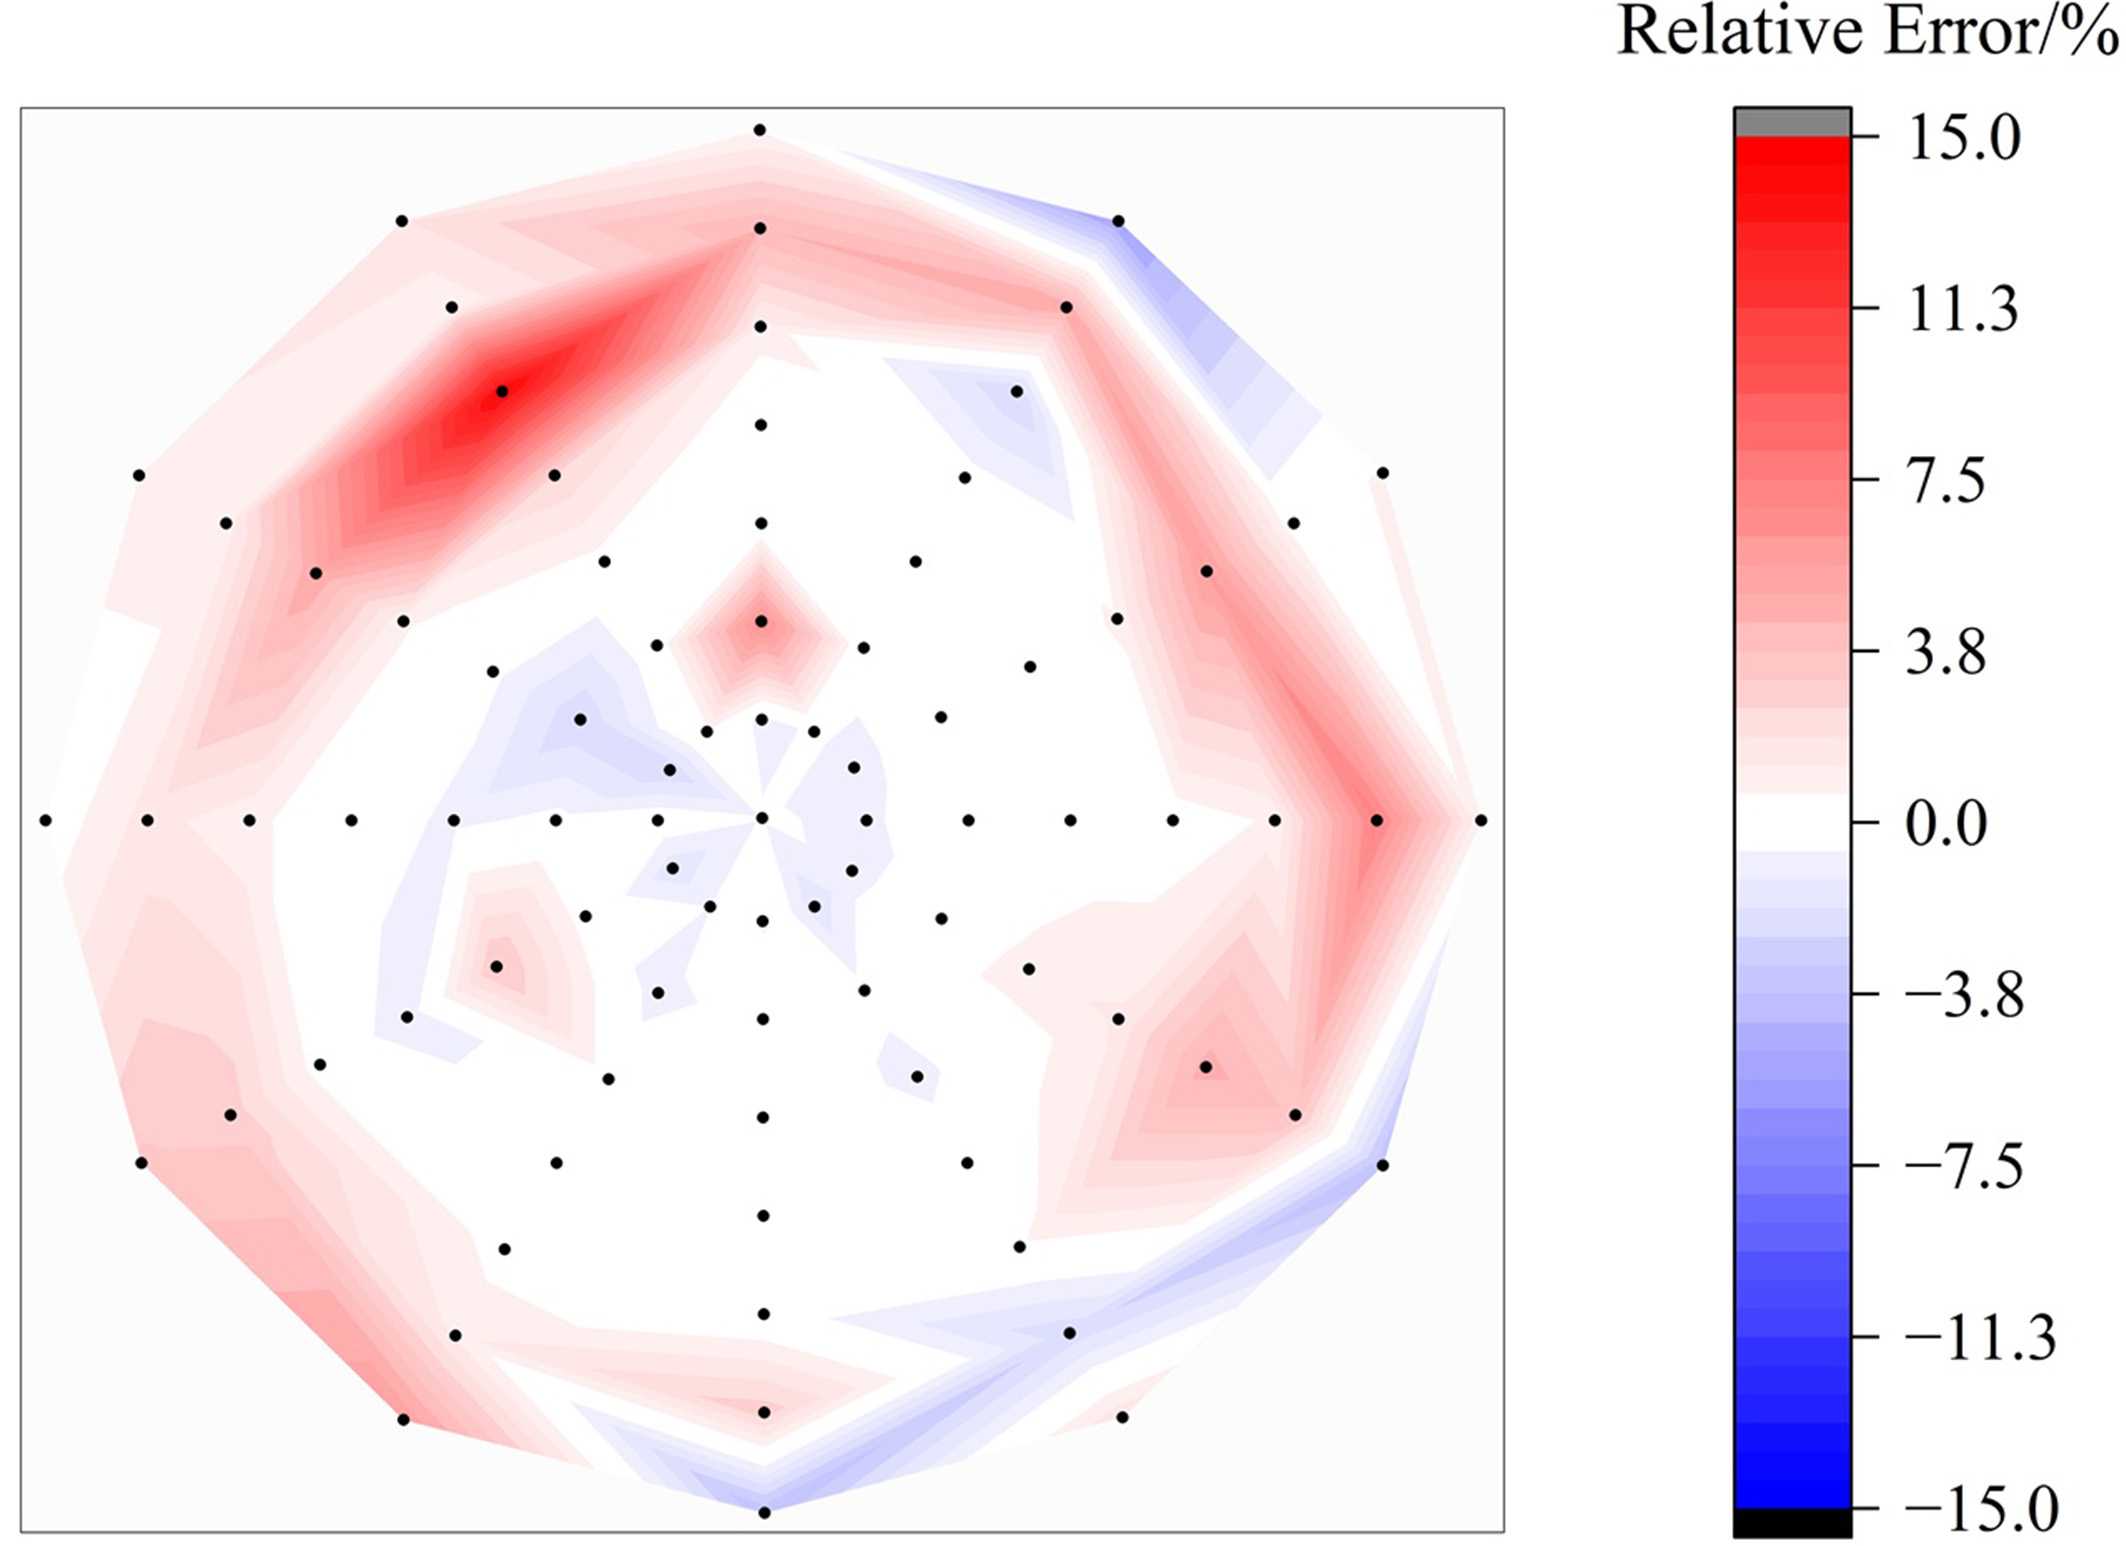
Figure 5. Relative prediction error distribution of the carbon content at billet cross-section.
Overall, the model could accurately assess the carbon content at different positions across the billet cross section, with most relative prediction errors remaining below 5%. These results confirm the robustness of the proposed model under data-constrained conditions and demonstrate its potential to support segregation evaluation and quality control during billet production.
In addition to the proposed data-driven models, it is important to note that many physics-based macrosegregation models have been developed for continuously cast steels, where coupled flow, heat transfer, and solute transport equations are solved to predict segregation at the billet scale. These mechanistic models offer valuable insight into solidification, but require detailed thermal-fluid boundary conditions and do not directly provide point-wise carbon content at image resolution. By contrast, the present CNN directly infers local carbon content from low-magnification microstructural images. Thus, the two approaches are complementary: physics-based models are well suited for mechanistic analysis and process optimization, whereas the CNN is advantageous for rapid, image-based assessment of segregation patterns. Future hybrid or physics-informed frameworks could integrate both to improve interpretability and predictive reliability.
Out-of-sample validation
To further examine the model’s generalization capability, out-of-sample validations were performed on two additional 42CrMo billets produced under conditions different from those used for training. The first billet was cast with modified electromagnetic swirling flow in nozzle (EMSFN) parameters, while the second billet was produced under identical casting parameters but exhibited a slightly lower overall carbon content compared with the billet used in the training. Specifically, the EMSFN current was adjusted to generate a stronger stirring effect in the mold, while other casting parameters such as casting speed and superheat remained unchanged. This adjustment was intended to introduce a controlled variation in melt flow and solidification dynamics, enabling evaluation of the model’s robustness under altered process conditions. Low-magnification microstructural images were collected from 25 representative locations on the first billet and 16 locations on the second billet, covering both columnar and equiaxed regions. The sampling distributions and corresponding low-magnification microstructures are provided in Supplementary Figures 1 and 2, respectively, illustrating that the additional billets exhibit both process-induced and compositional variations relative to the training billet while retaining the same overall alloy designation.
As shown in Figure 6A, the predictions for the first billet closely follow the measured carbon contents, yielding an R2 of 77.4% and an MAE of 0.008 wt.%, with a maximum deviation of 0.02 wt.%. The error bars denote the standard deviations of predictions obtained from rotation/mirroring-augmented image patches per sampling point. For the second billet [Figure 6B], which differs primarily in chemical composition, the model achieved an R2 of 65.4% and an MAE of 0.005 wt.%, indicating that the model can still capture the overall segregation trend even when the baseline carbon content varies.
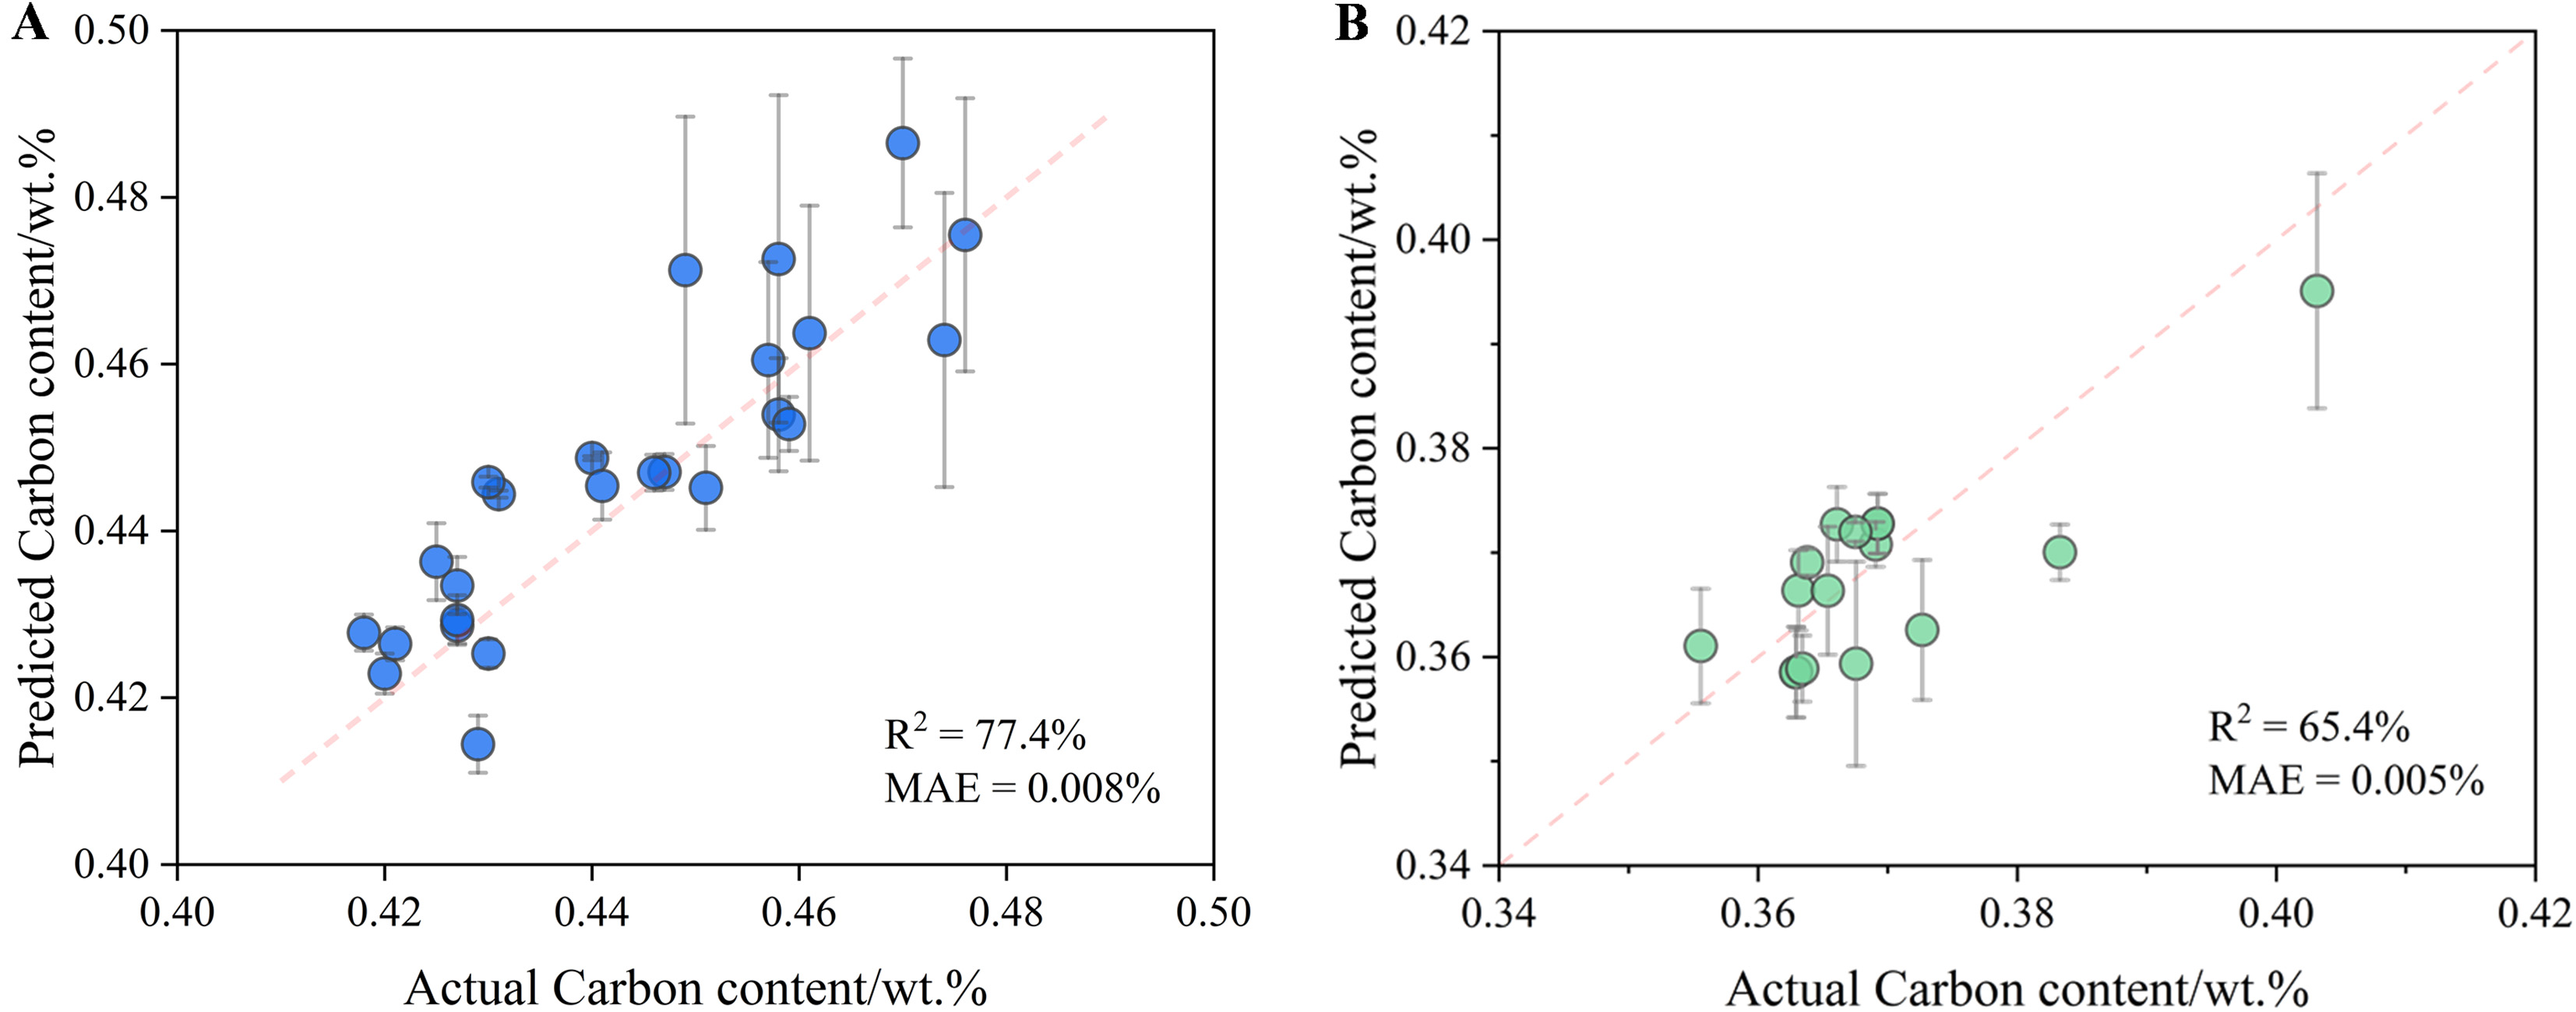
Figure 6. Model validation for the new samples. (A) Predicted vs. actual carbon contents for the billet cast with modified electromagnetic swirling flow in nozzle (EMSFN) parameters; (B) Predicted vs. actual carbon contents for the billet cast under the same process parameters but with slightly lower carbon content.
Collectively, these results demonstrate that the model maintains reasonably consistent predictive behavior across billets produced under both varied process parameters and modest compositional differences. Nevertheless, this validation should be regarded as an initial demonstration of generalization, and future work will involve a broader evaluation using multiple steel grades and casting conditions to rigorously establish robustness and industrial applicability.
Comparison of different model architectures
In this study, a comprehensive comparison of various model architectures was conducted to assess their effectiveness in predicting the carbon content of continuously cast billets. This comparison involved varying the number of convolutional blocks from two to seven and the number of fully connected layers from one to six. Through an analysis of the training and testing datasets, as depicted in Figure 7, the R2, MAE, and degree of overfitting associated with each architecture were evaluated.
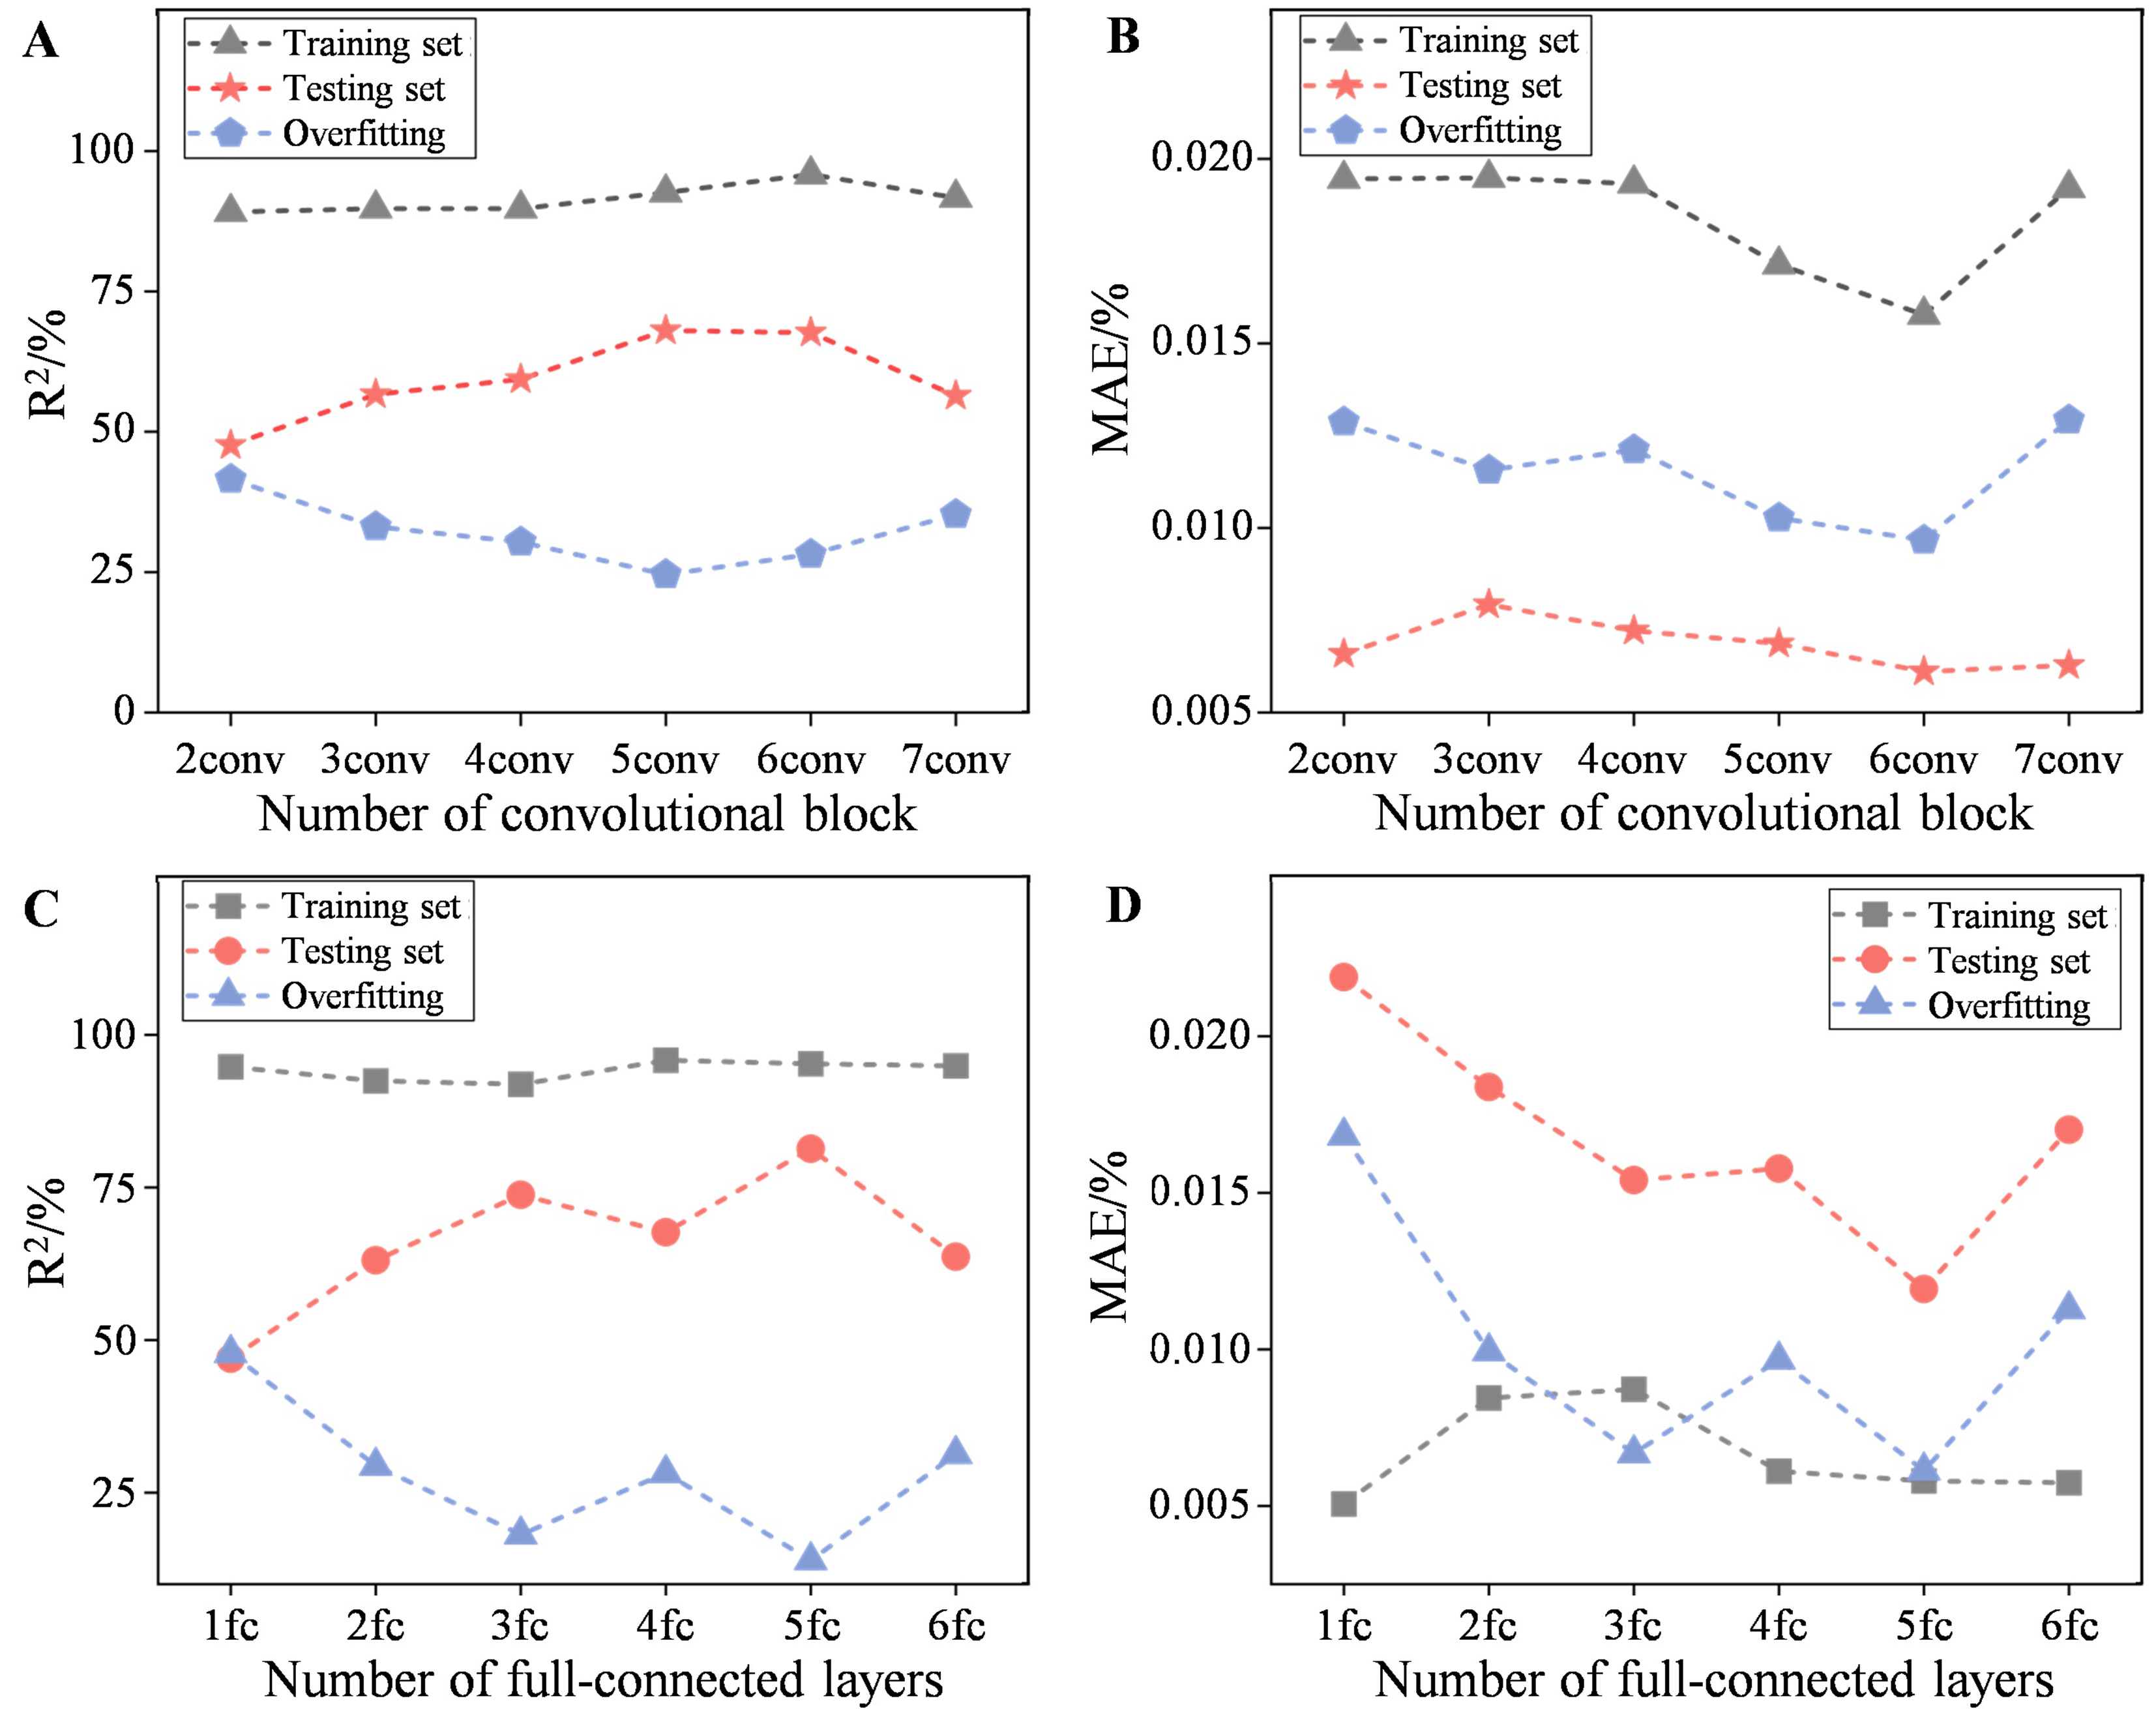
Figure 7. Comparison of the prediction results under different model architectures. (A) R2 and (B) MAE under various numbers of convolutional blocks; (C) R2 and (D) MAE under various numbers of fully connected layers. R2: Squared correlation coefficient; MAE: mean absolute error.
The models with six convolutional blocks demonstrated the highest predictive R2 on the testing set, accompanied by the lowest degree of overfitting. This indicates that an optimal balance between the model complexity and generalizability could be achieved with this configuration. Moreover, the trend observed in the performance of models with varying numbers of convolutional blocks suggests a point of diminishing returns beyond six blocks, with further increase leading to a decline in the predictive performance. This trend can be likely attributed to the increasing complexity of the network, which may compromise its ability for effective generalization.
Similarly, in the case of fully connected layers, models with five layers exhibited the highest predictive R2 on the testing set, while maintaining minimal overfitting. The trend observed in the performance of the models with different numbers of fully connected layers mirrored that of the convolutional blocks, with an initial improvement followed by a decline beyond a certain point.
Overall, the results highlight the importance of optimizing the model architecture to achieve optimal generalization performance. By selecting configurations with six convolutional blocks and five fully connected layers, we could enhance the predictive R2 of the model, while minimizing the risk of overfitting. This optimization strategy holds promise for improving the ability of the model to predict the carbon content in continuously cast billets, thereby enhancing its applicability in real-world industrial settings. Rather than proposing a radically new CNN architecture, this systematic exploration demonstrates that a moderately deep, strongly regularized network is sufficient to capture the relevant microstructural cues for carbon segregation, while avoiding unnecessary complexity that would exacerbate overfitting under limited data.
Image quality optimization
The significant impact of image quality and preprocessing on model construction and prediction performance was further explored. This section presents a comparative analysis of the originally captured images and the images subjected to contrast enhancement. Figure 8A-F show the original images and their contrast-enhanced counterparts. Quantitative image quality evaluation averaged over the entire image set demonstrated that contrast enhancement substantially improved microstructural feature separability, increasing the root mean square contrast from 0.137 to 0.188 and the gray-level co-occurrence matrix texture contrast from 3.17 to 18.84, while entropy decreased from 9.33 to 6.43, indicating reduced noise and stronger structural definition in the enhanced images. These improvements may enhance feature extraction, thereby improving model performance.
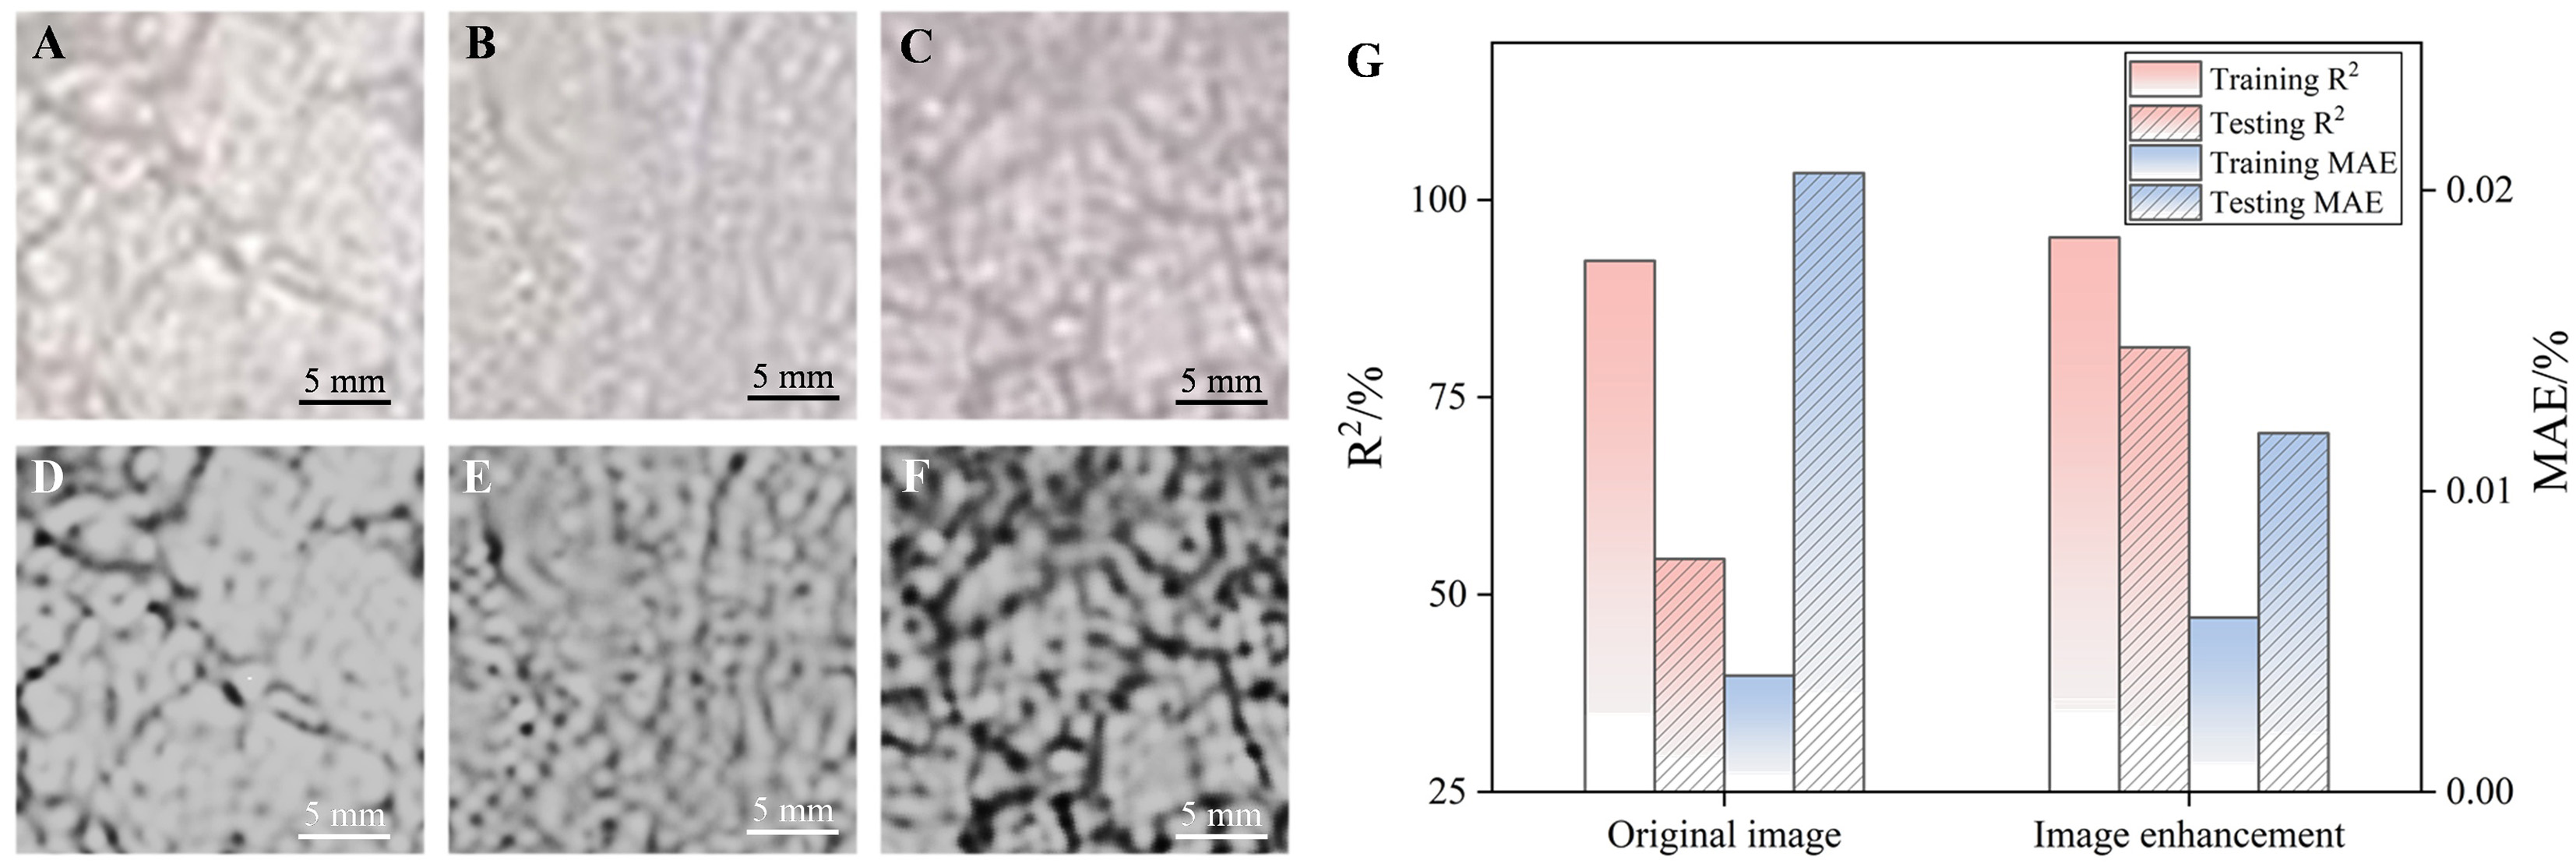
Figure 8. Effect of image enhancement on model prediction performance. (A) Original microstructure sub-image #1; (B) Original microstructure sub-image #2; (C) Original microstructure sub-image #3; (D) Contrast-enhanced version of (A); (E) Contrast-enhanced version of (B); (F) Contrast-enhanced version of (C); (G) Comparison of model performance before and after enhancement on both training and testing sets. R2: Squared correlation coefficient; MAE: mean absolute error.
Figure 8G presents the modeling prediction results in both scenarios. Despite achieving a consistently high predictive R2 on the training set, exceeding 90% in both cases, substantial differences were evident in the results obtained on the testing set. Modeling using the original images yielded a predictive R2 of only approximately 55% on the testing set, with the MAE exceeding 0.02 wt.%. In contrast, the modeling results obtained using the processed images demonstrated a distinct improvement, with the predictive R2 exceeding 80% on the testing set and a significantly reduced MAE of approximately 0.012 wt.%. Similarly, contrast enhancement also improved model performance under conventional machine learning algorithms.
These outcomes underscore the pivotal role of appropriate image preprocessing in enhancing the prediction and generalizability of the model. With the use of contrast-enhanced images, the model exhibited enhanced performance in predicting the carbon content in continuously cast billets, highlighting the crucial importance of optimizing image quality during the modeling process. Nevertheless, contrast enhancement should be interpreted as a visualization aid rather than a substitute for higher-resolution characterization, and future work will evaluate robustness under alternative illumination and etching conditions to ensure that the model does not become sensitive to dataset-specific preprocessing characteristics.
Model interpretability
In this study, Gradient-weighted Class Activation Mapping (Grad-CAM)[37] was used to visualize and analyze the feature extraction and prediction processes of our model. Grad-CAM was applied not only to the final convolutional layer but also sequentially to intermediate convolutional blocks. For each target layer, gradients of the predicted carbon content with respect to its feature maps were globally averaged to obtain channel importance weights, which were linearly combined and passed through ReLU before bilinear upsampling to input resolution. This layer-wise visualization was used qualitatively to illustrate progressive feature refining through the network depth. By examining the hotspot distributions across 12 convolutional layers within six convolutional blocks (as shown in Figure 9), we gained a deeper understanding of the model behavior. The color gradient from blue to red in the Grad-CAM visualizations highlights the regions of the image the model considers important for predicting the carbon content, with red indicating a higher importance. This analysis provides valuable insights into how the model interprets the microstructural features relevant to the prediction of the carbon content.
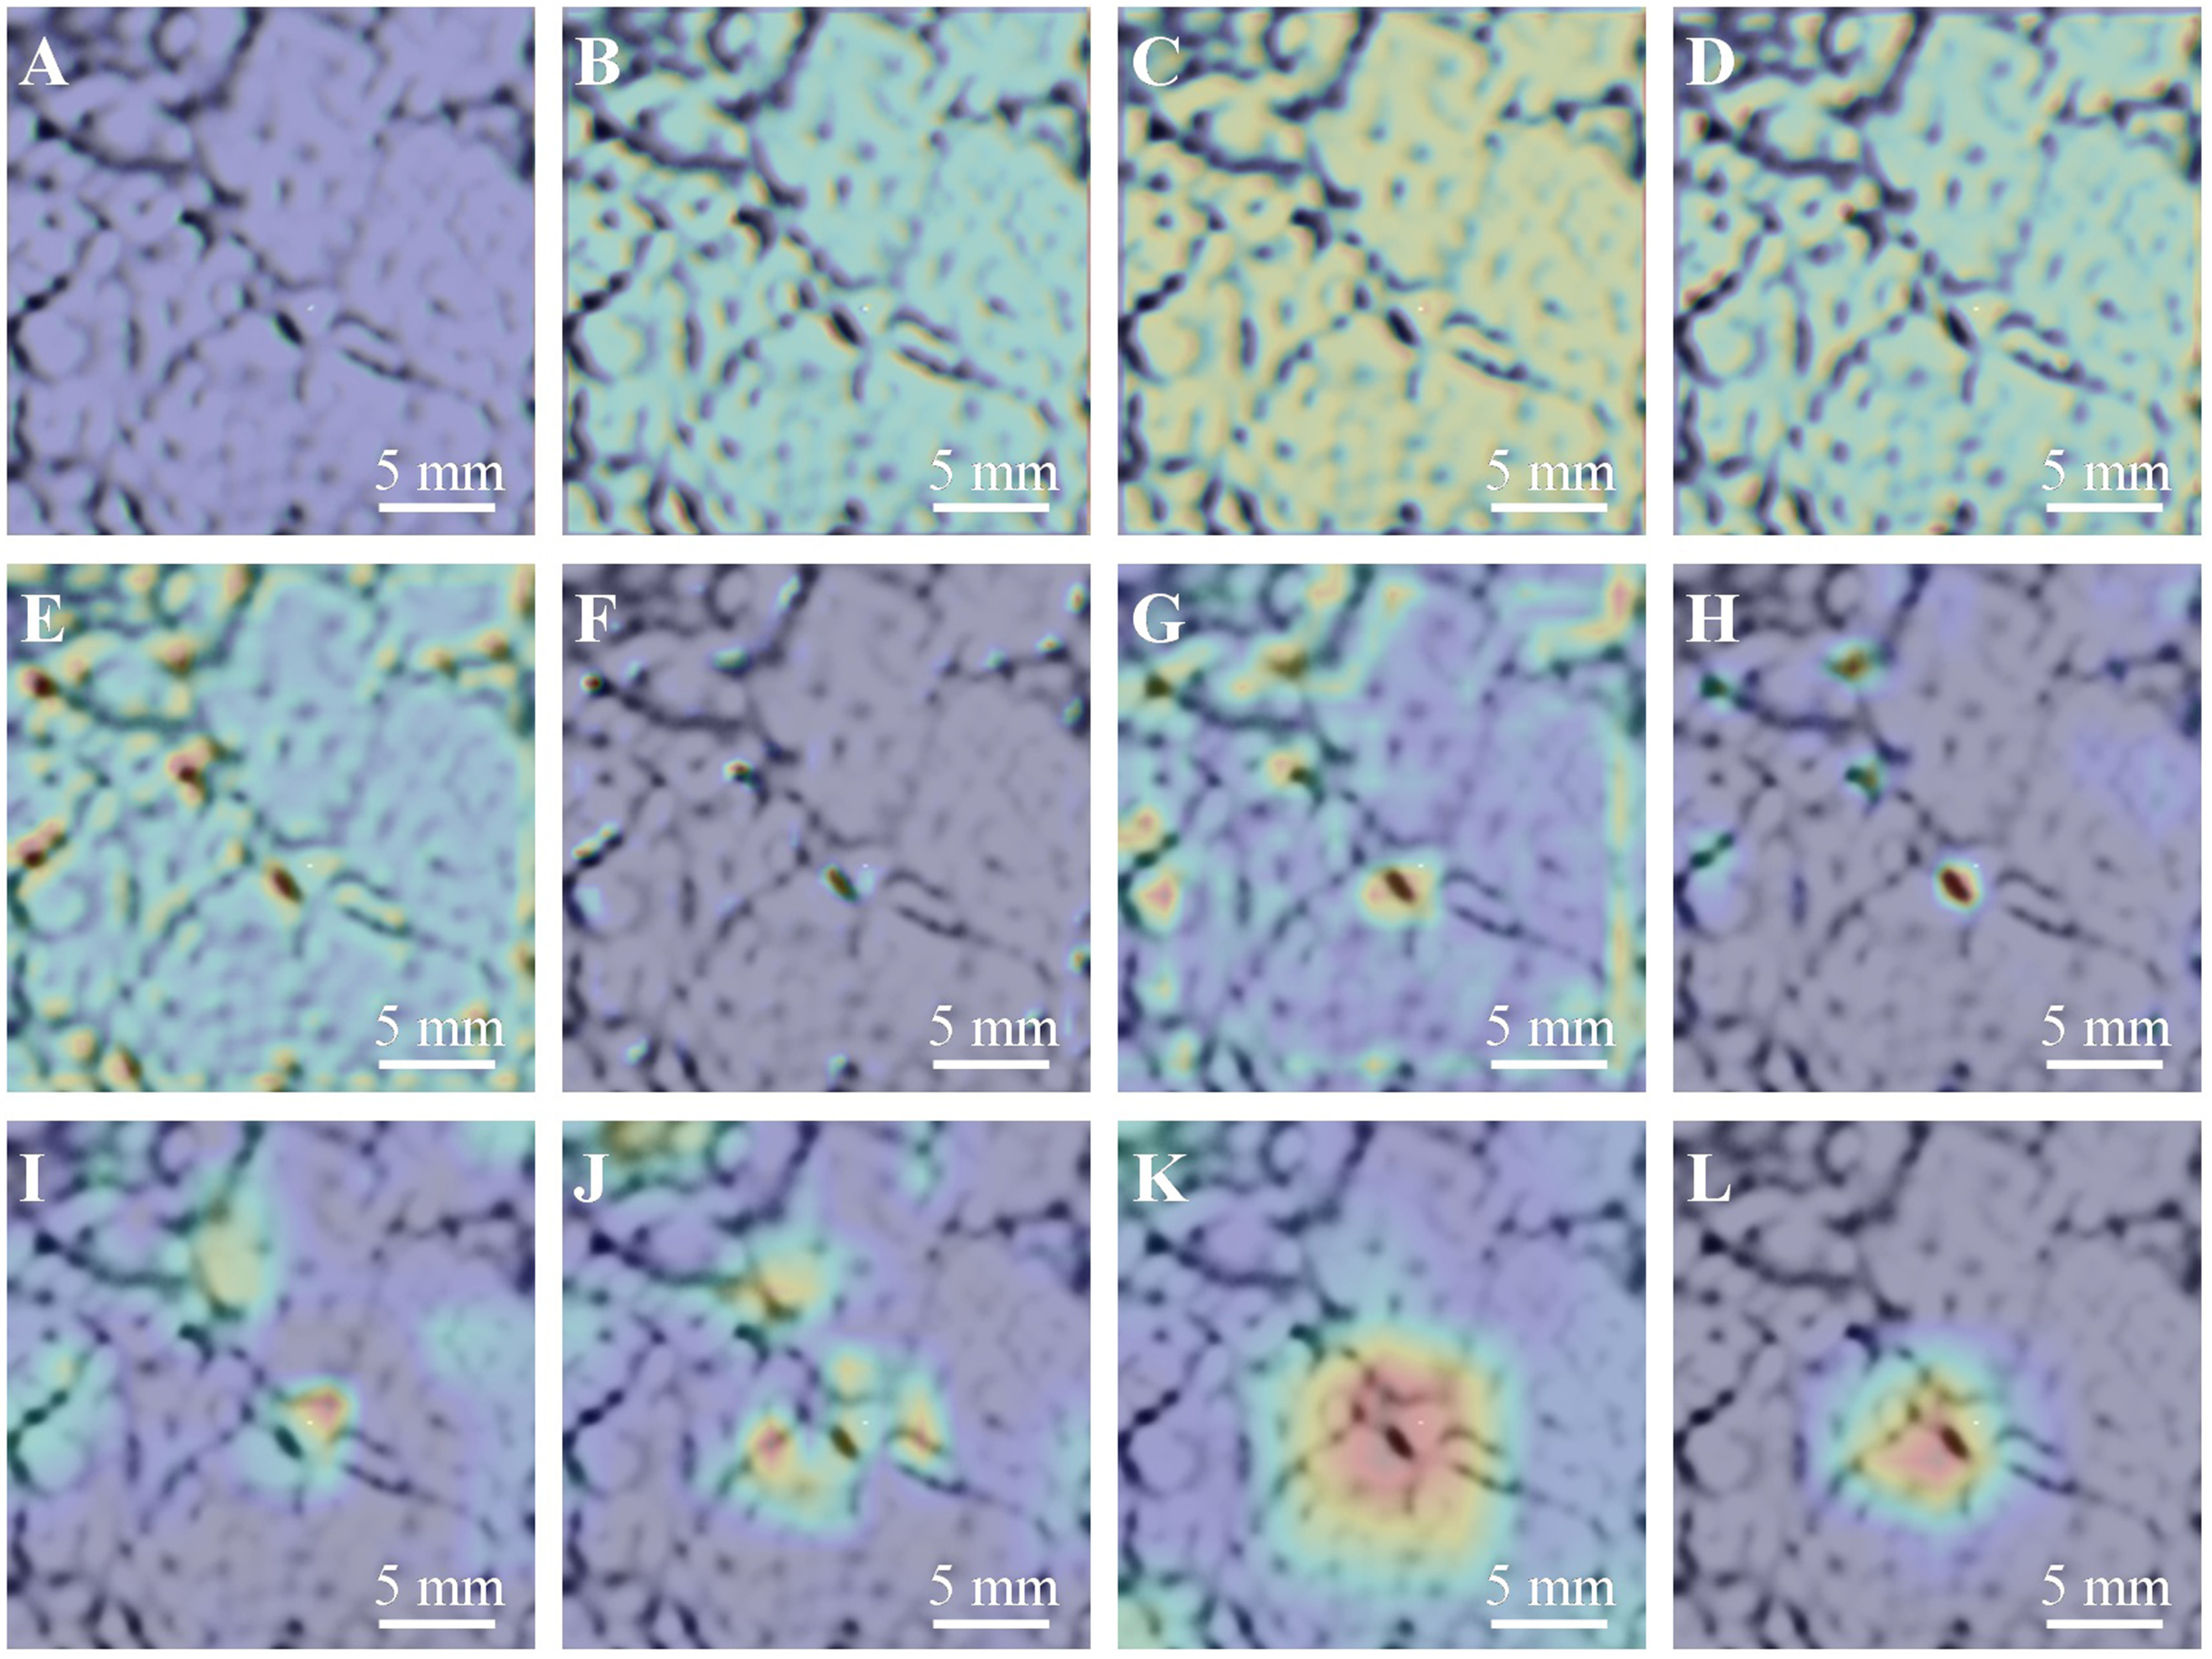
Figure 9. Grad-CAM heatmaps of the six convolutional blocks of the CNN model. (A) Hotspot result of the 1st convolutional layer; (B) 2nd; (C) 3rd; (D) 4th; (E) 5th; (F) 6th; (G) 7th; (H) 8th; (I) 9th; (J) 10th; (K) 11th; (L) 12th. Grad-CAM: Gradient-weighted Class Activation Mapping; CNN: convolutional neural network.
In the shallow layers (layer 1-layer 4), activation is diffusely distributed, reflecting sensitivity to low-level morphological features such as grain/dendrite boundaries and porosity. In the intermediate layers (layer 5-layer 8), attention becomes increasingly localized around interdendritic channels, where enrichment of carbon and other solute elements is known to occur during solidification. In the deepest layers (layer 9-layer 12), activation is strongly concentrated along continuous segregation pathways, consistent with the carbon-rich interdendritic liquid redistribution and microsegregation behavior reported in continuously cast steels.
To provide quantitative evidence that Grad-CAM indeed focuses on metallurgically relevant regions, we performed a region-based activation analysis on eight representative validation patches. Binary masks were created to separate (i) dendrite cores and (ii) interdendritic/segregation-channel areas. The mean Grad-CAM activation was significantly higher in interdendritic regions (0.302 ± 0.170) than in dendrite cores (0.264 ± 0.176), confirmed by a Wilcoxon signed-rank test (P = 0.018, alternative = “inter > core”). This indicates that the CNN preferentially attends to carbon-segregation-prone pathways rather than random texture fluctuations or imaging noise.
Overall, these findings show that the deep layers of the model emphasize microstructural regions consistent with established principles of solute redistribution and carbon segregation during dendritic solidification. This improves confidence that the CNN is not only performing accurate prediction, but also learning features that are physically meaningful within the metallurgical context of continuous casting.
Transfer learning
Transfer learning was explored to improve the prediction of carbon segregation in steel billets using pretrained image networks. In principle, transfer learning allows a model trained on large, general datasets to be adapted to smaller, domain-specific ones, and its success has been demonstrated in many prior studies. Here, pretrained architectures such as VGG16, VGG19, and InceptionV3 were fine-tuned for the task of predicting carbon content from microstructural images. During fine-tuning, earlier convolutional layers were kept fixed while new regression layers were added. Different learning rates were used, and dropout with early stopping was applied to reduce overfitting.
Under these conditions, the transfer learning models performed worse than the custom CNN developed for this study [Figure 10]. Although the pretrained networks achieved over 90% accuracy on the training data, their testing accuracy remained below 70% (the best result being 66.9% for InceptionV3 with MAE above 0.016 wt.%). In contrast, the custom CNN reached 81.3% testing accuracy with a lower MAE of approximately 0.012 wt.% and showed small deviations during out-of-sample validation, indicating better generalization under limited data.
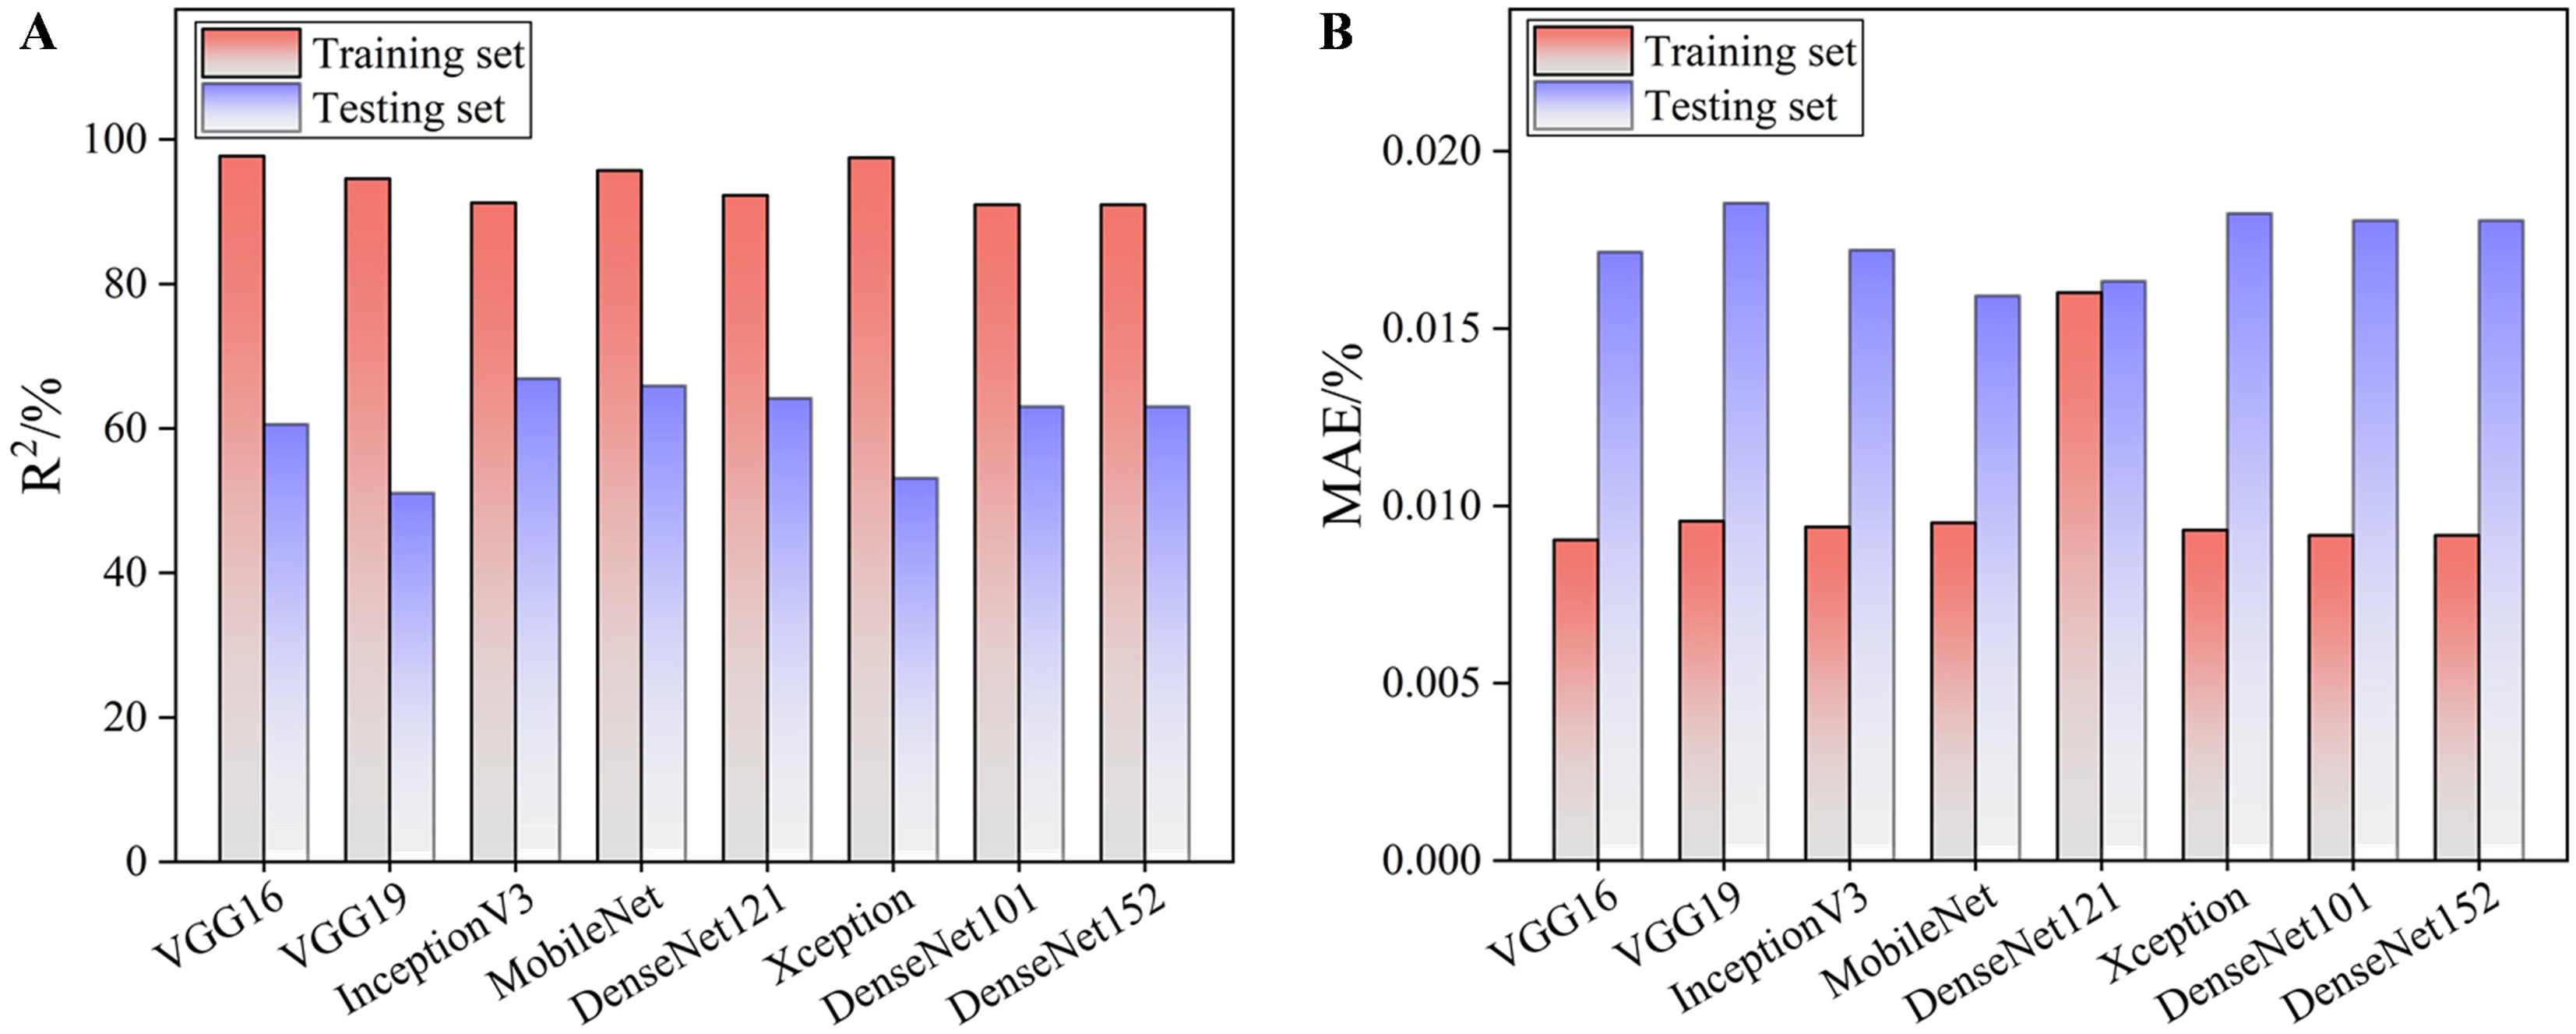
Figure 10. Comparison of pre-trained models with transfer learning in terms of (A) R2 and (B) MAE. R2: Squared correlation coefficient; MAE: mean absolute error.
The weaker performance of the pretrained models can be explained by three factors. First, features learned from natural images transfer poorly to etched metallographic textures, which rely mainly on grayscale and subtle structural patterns. Second, large pretrained networks tend to overfit small datasets even when part of the architecture is frozen. Third, the standard adaptation process may not adequately capture metallurgical characteristics without more targeted, domain-specific pretraining.
Overall, these findings reflect the constraints of the current dataset and experimental setup rather than a limitation of transfer learning itself. With larger and more diverse training data, improved adaptation methods, and pretraining on metallographic images, transfer learning could become a competitive approach for this type of materials prediction task.
Practical considerations and deployment limitations
Although the proposed approach demonstrates promising predictive capability, its current implementation relies on destructive sampling, metallographic preparation, and offline optical imaging, which limits its suitability for real-time, in-line quality control. As such, the method is presently more appropriate for periodic metallurgical evaluation, process validation, and research on segregation mechanisms rather than continuous production monitoring.
In comparison with existing quality control practices, traditional macro-etch inspections and pointwise chemical analysis remain lower in cost and are operationally simpler but provide only coarse segregation assessment and limited spatial resolution. The proposed image-driven CNN method introduces additional imaging and computational requirements but yields richer, spatially continuous information on carbon variation across the billet section. This may reduce the number of chemical analyses required per billet, support more informed adjustment of casting parameters, and improve validation of solidification models, thereby potentially offering downstream cost benefits. However, its practical advantages must be balanced against additional labor and processing time, and any future adoption would require further evaluation of cost-effectiveness within specific plant workflows.
Regarding computational efficiency, the trained CNN exhibits fast inference speed. On an NVIDIA RTX 3090 GPU, the average prediction time is approximately 4.2 ms per image (≈ 238 images/s), and a full billet cross-section containing 85 sampling locations can be evaluated in approximately 0.36 s. Since sample preparation and imaging are orders of magnitude slower than model inference, prediction time is not the rate-limiting step in the current workflow. In terms of accuracy-efficiency trade-offs, the proposed CNN requires higher training cost than conventional machine-learning baselines (e.g., Random Forest), but provides substantially higher predictive accuracy. Because training is offline and inference is extremely fast, the additional computational expense is considered acceptable for this application. Nonetheless, robustness and throughput should be reassessed if the framework is adapted to higher-resolution imaging or extended to larger billet areas.
Analysis of the prediction errors shows that the largest deviations (up to ~ 0.03 wt.%) mainly appeared in near-surface columnar regions, whereas the equiaxed central zone showed lower errors. This trend is consistent with the more complex solidification features near the billet shell, where channel segregation and subsurface porosity are not always visible under low-magnification imaging. Higher uncertainty was also observed in samples with insufficient etching contrast or surface artifacts, where the CNN may misinterpret texture as segregation. Therefore, the model should be applied with caution for: (i) surface/subsurface columnar areas, where microsegregation features may be incomplete; (ii) low-quality or artifact-affected images; and (iii) substantially modified casting conditions.
Because casting practices and alloy compositions may evolve over time, the predictive performance of the model may degrade if it is not regularly updated. In practical deployment, the framework would therefore require periodic or incremental retraining with newly obtained metallographic samples. Approaches such as transfer learning or domain adaptation could reduce the need for fully labeled datasets, helping maintain model accuracy under variations in electromagnetic stirring intensity, cooling conditions, or steel composition. Establishing suitable retraining policies and data-collection strategies will be essential for long-term use in production environments.
Future deployment in industrial environments would require adaptation to nondestructive or surface imaging modalities, automation of sample preparation, and integration with existing process monitoring systems. In addition, computational robustness, throughput, and consistency under varying etching and illumination conditions must be verified before the method can be considered for routine operational use.
CONCLUSIONS
The CNN-based framework presented in this work provides a promising proof-of-concept for predicting carbon segregation patterns in continuously cast 42CrMo billets from low-magnification microstructural images. The model achieves encouraging accuracy under limited data and offers preliminary interpretability via Grad-CAM. Out-of-sample validation on additional billets with modified electromagnetic stirring conditions and slightly different bulk carbon levels provides an initial indication of robustness within the studied alloy and process window. Nonetheless, its use is currently constrained by destructive sampling, restricted dataset diversity, and higher uncertainty in near-surface columnar regions. Future efforts should emphasize broader validation, uncertainty quantification, non-destructive imaging integration, and incremental retraining to support potential use in metallurgical monitoring and process optimization.
DECLARATIONS
Authors’ contributions
Made substantial contributions to conception and design of the study, writing and editing: Wei, X.; Wang, C.; Liu, X.; Lian, G.; Wang, Q.; Wang, G.; Xu, W.
Made substantial contributions to collation of literatures, figures preparation, and writing: Wei, X.; Wang, C.
Performed data acquisition, as well as provided administrative, technical, and material support: Wang, C.; Wang, Q.; Wang, G.
Availability of data and materials
The data and source code that support the findings of this study are available from the corresponding authors upon reasonable request.
AI and AI-assisted tools statement
Not applicable.
Financial support and sponsorship
This work was supported by the National Natural Science Foundation of China (Grant No. U22A20106, U21A20117 and 52311530082); the Postdoctoral Fellowship Program of CPSF under Grant Number GZC20240222. The financial support provided by the China Postdoctoral Science Foundation (2024M750370) is gratefully acknowledged. The authors gratefully acknowledge the financial support by the Fundamental Research Funds for the Central Universities (N2425034).
Conflicts of interest
All authors declared that there are no conflicts of interest.
Ethical approval and consent to participate
Not applicable.
Consent for publication
Not applicable.
Copyright
© The Author(s) 2026.
Supplementary Materials
REFERENCES
1. Liu, H.; Cheng, Z.; Yu, W.; Zhou, Z.; Cheng, L.; Cai, Q. Effect of high-temperature reduction pretreatment on internal quality of 42CrMo casting billet. J. Iron. Steel. Res. Int. 2020, 28, 693-702.
2. Li, G.; Ji, C.; Zhu, M. Prediction of internal crack initiation in continuously cast blooms. Metall. Mater. Trans. B. 2021, 52, 1164-78.
3. Kong, Y.; Chen, D.; Liu, Q.; Long, M. A prediction model for internal cracks during slab continuous casting. Metals 2019, 9, 587.
4. Thomas, B. G. Review on modeling and simulation of continuous casting. Steel. Res. Int. 2017, 89, 1700312.
5. Jiang, D.; Wang, W.; Luo, S.; Ji, C.; Zhu, M. Mechanism of macrosegregation formation in continuous casting slab: a numerical simulation study. Metall. Mater. Trans. B. 2017, 48, 3120-31.
6. Sun, H.; Zhang, J. Study on the Macrosegregation behavior for the bloom continuous casting: model development and validation. Metall. Mater. Trans. B. 2013, 45, 1133-49.
7. Zhang, Z.; Wu, M.; Zhang, H.; et al. Modeling of the as-cast structure and macrosegregation in the continuous casting of a steel billet: Effect of M-EMS. J. Mater. Process. Technol. 2022, 301, 117434.
8. Dong, Q.; Zhang, J.; Qian, L.; Yin, Y. Numerical modeling of macrosegregation in round billet with different microsegregation models. ISIJ. Int. 2017, 57, 814-23.
9. Hatič, V.; Mavrič, B.; Šarler, B. Simulation of macrosegregation in direct-chill casting - A model based on meshless diffuse approximate method. Eng. Anal. Boundary. Elem. 2020, 113, 191-203.
10. Geng, X.; Wang, F.; Wu, H. H.; et al. Data-driven and artificial intelligence accelerated steel material research and intelligent manufacturing technology. MGE. Advances. 2023, 1, e10.
11. Wang, H.; Gao, S.; Wang, B.; et al. Recent advances in machine learning-assisted fatigue life prediction of additive manufactured metallic materials: a review. J. Mater. Sci. Technol. 2024, 198, 111-36.
12. Zhang, N.; He, A.; Zhang, G.; et al. Interpretable machine learning-assisted design of Fe-based nanocrystalline alloys with high saturation magnetic induction and low coercivity. J. Mater. Sci. Technol. 2024, 188, 73-83.
13. Zhang, Y.; Ren, K.; Wang, W. Y.; et al. Discovering the ultralow thermal conductive A2B2O7-type high-entropy oxides through the hybrid knowledge-assisted data-driven machine learning. J. Mater. Sci. Technol. 2024, 168, 131-42.
14. Zhang, Y.; Wen, C.; Dang, P.; Lookman, T.; Xue, D.; Su, Y. Toward ultra-high strength high entropy alloys via feature engineering. J. Mater. Sci. Technol. 2024, 200, 243-52.
15. Wang, C.; Fu, H.; Jiang, L.; Xue, D.; Xie, J. A property-oriented design strategy for high performance copper alloys via machine learning. NPJ. Comput. Mater. 2019, 5, 87.
16. Song, K.; Yan, F.; Ding, T.; Gao, L.; Lu, S. A steel property optimization model based on the XGBoost algorithm and improved PSO. Comput. Mater. Sci.。. 2020, 174, 109472.
17. Wen, C.; Zhang, Y.; Wang, C.; et al. Machine learning assisted design of high entropy alloys with desired property. Acta. Mater. 2019, 170, 109-17.
18. Wu, Q.; Wang, Z.; Hu, X.; et al. Uncovering the eutectics design by machine learning in the Al–Co–Cr–Fe–Ni high entropy system. Acta. Mater. 2020, 182, 278-86.
19. Liu, Y.; Wu, J.; Wang, Z.; et al. Predicting creep rupture life of Ni-based single crystal superalloys using divide-and-conquer approach based machine learning. Acta. Mater. 2020, 195, 454-67.
20. Li, S.; Dong, Z.; Jin, J.; et al. Optimal design of high-performance rare-earth-free wrought magnesium alloys using machine learning. MGE. Advances. 2024, 2, e45.
21. Shi, B.; Lookman, T.; Xue, D. Multi-objective optimization and its application in materials science. MGE. Advances. 2023, 1, e14.
22. Gou, W.; Shi, Z. Z.; Zhu, Y.; et al. Multi-objective optimization of three mechanical properties of Mg alloys through machine learning. MGE. Advances. 2024, 2, e54.
23. Zou, L.; Zhang, J.; Liu, Q.; Zeng, F.; Chen, J.; Guan, M. Prediction of central carbon segregation in continuous casting billet using a regularized extreme learning machine model. Metals 2019, 9, 1312.
24. Zou, L.; Zhang, J.; Han, Y.; Zeng, F.; Li, Q.; Liu, Q. Internal crack prediction of continuous casting billet based on principal component analysis and deep neural network. Metals 2021, 11, 1976.
25. Xu, Z.; Liu, X.; Zhang, K. Mechanical properties prediction for hot rolled alloy steel using convolutional neural network. IEEE. Access. 2019, 7, 47068-78.
26. Zhang, Q.; Wang, Y. Research on mechanical property prediction of hot rolled steel based on lightweight multi-branch convolutional neural network. Mater. Today. Commun. 2023, 37, 107445.
27. Ma, Y.; Deng, C.; Sun, Z.; Gong, B.; Liu, Y. Prediction of sequential stress-strain fields in dual-phase steels via convolutional neural network. Mater. Today. Commun. 2025, 46, 112645.
28. Zhu, L.; Luo, Q.; Chen, Q.; et al. Prediction of ultimate tensile strength of Al-Si alloys based on multimodal fusion learning. MGE. Advances. 2024, 2, e26.
29. Wang, W. Y.; Zhang, S.; Li, G.; et al. Artificial intelligence enabled smart design and manufacturing of advanced materials: the endless Frontier in AI+ era. MGE. Advances. 2024, 2, e56.
30. Zong, B.; Li, J.; Zhou, C.; Wang, P.; Tang, B.; Yuan, R. Enhancing creep rupture life prediction of high-temperature titanium alloys using convolutional neural networks. MGE. Advances. 2024, 2, e68.
31. Xu, N.; Wang, L.; Hu, J.; et al. Enabling strong and formable advanced high-strength steels through inherited homogeneous microstructure. Scr. Mater. 2025, 259, 116560.
32. Yang, Z.; Li, Y.; Wei, X.; Wang, X.; Wang, C. Martensite start temperature prediction through a deep learning strategy using both microstructure images and composition data. Materials. (Basel). 2023, 16, 932.
33. Lee, S. Y.; Tama, B. A.; Choi, C.; Hwang, J.; Bang, J.; Lee, S. Spatial and sequential deep learning approach for predicting temperature distribution in a steel-making continuous casting process. IEEE. Access. 2020, 8, 21953-65.
34. Lu, Z.; Ren, N.; Xu, X.; et al. Real-time prediction and adaptive adjustment of continuous casting based on deep learning. Commun. Eng. 2023, 2, 34.
35. Lian, G.; Sun, Q.; Liu, X.; et al. Automatic recognition and intelligent analysis of central shrinkage defects of continuous casting billets based on deep learning. J. Iron. Steel. Res. Int. 2023, 30, 937-48.
36. Wei, X.; Van Der Zwaag, S.; Jia, Z.; Wang, C.; Xu, W. On the use of transfer modeling to design new steels with excellent rotating bending fatigue resistance even in the case of very small calibration datasets. Acta. Mater. 2022, 235, 118103.
Cite This Article
How to Cite
Download Citation
Export Citation File:
Type of Import
Tips on Downloading Citation
Citation Manager File Format
Type of Import
Direct Import: When the Direct Import option is selected (the default state), a dialogue box will give you the option to Save or Open the downloaded citation data. Choosing Open will either launch your citation manager or give you a choice of applications with which to use the metadata. The Save option saves the file locally for later use.
Indirect Import: When the Indirect Import option is selected, the metadata is displayed and may be copied and pasted as needed.
About This Article
Copyright

Data & Comments
Data
0


Comments
Comments must be written in English. Spam, offensive content, impersonation, and private information will not be permitted. If any comment is reported and identified as inappropriate content by OAE staff, the comment will be removed without notice. If you have any queries or need any help, please contact us at [email protected].