


fig8
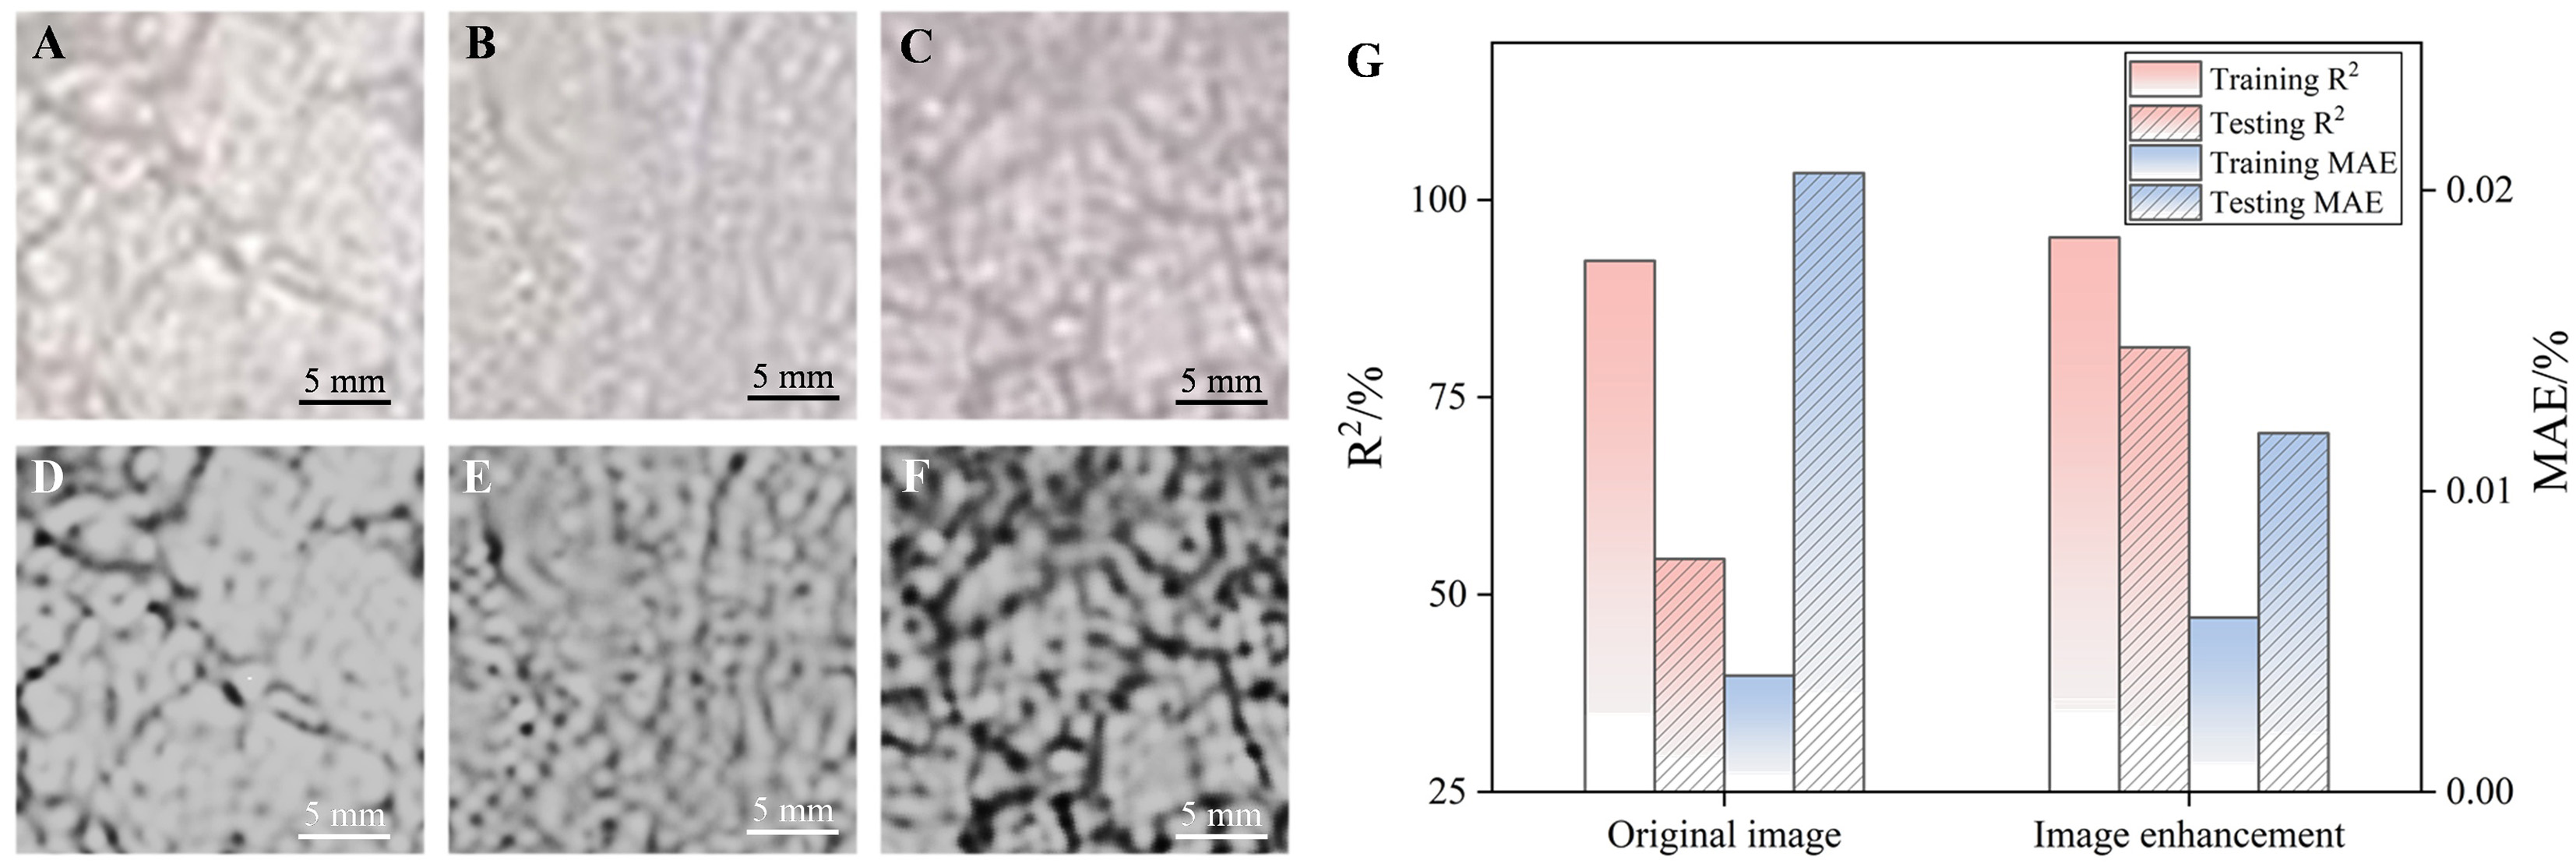
Figure 8. Effect of image enhancement on model prediction performance. (A) Original microstructure sub-image #1; (B) Original microstructure sub-image #2; (C) Original microstructure sub-image #3; (D) Contrast-enhanced version of (A); (E) Contrast-enhanced version of (B); (F) Contrast-enhanced version of (C); (G) Comparison of model performance before and after enhancement on both training and testing sets. R2: Squared correlation coefficient; MAE: mean absolute error.


