

Per- and polyfluoroalkyl substances may be a novel environmental etiology of nonalcoholic fatty liver: a national cross-sectional study
 0
0 Abstract
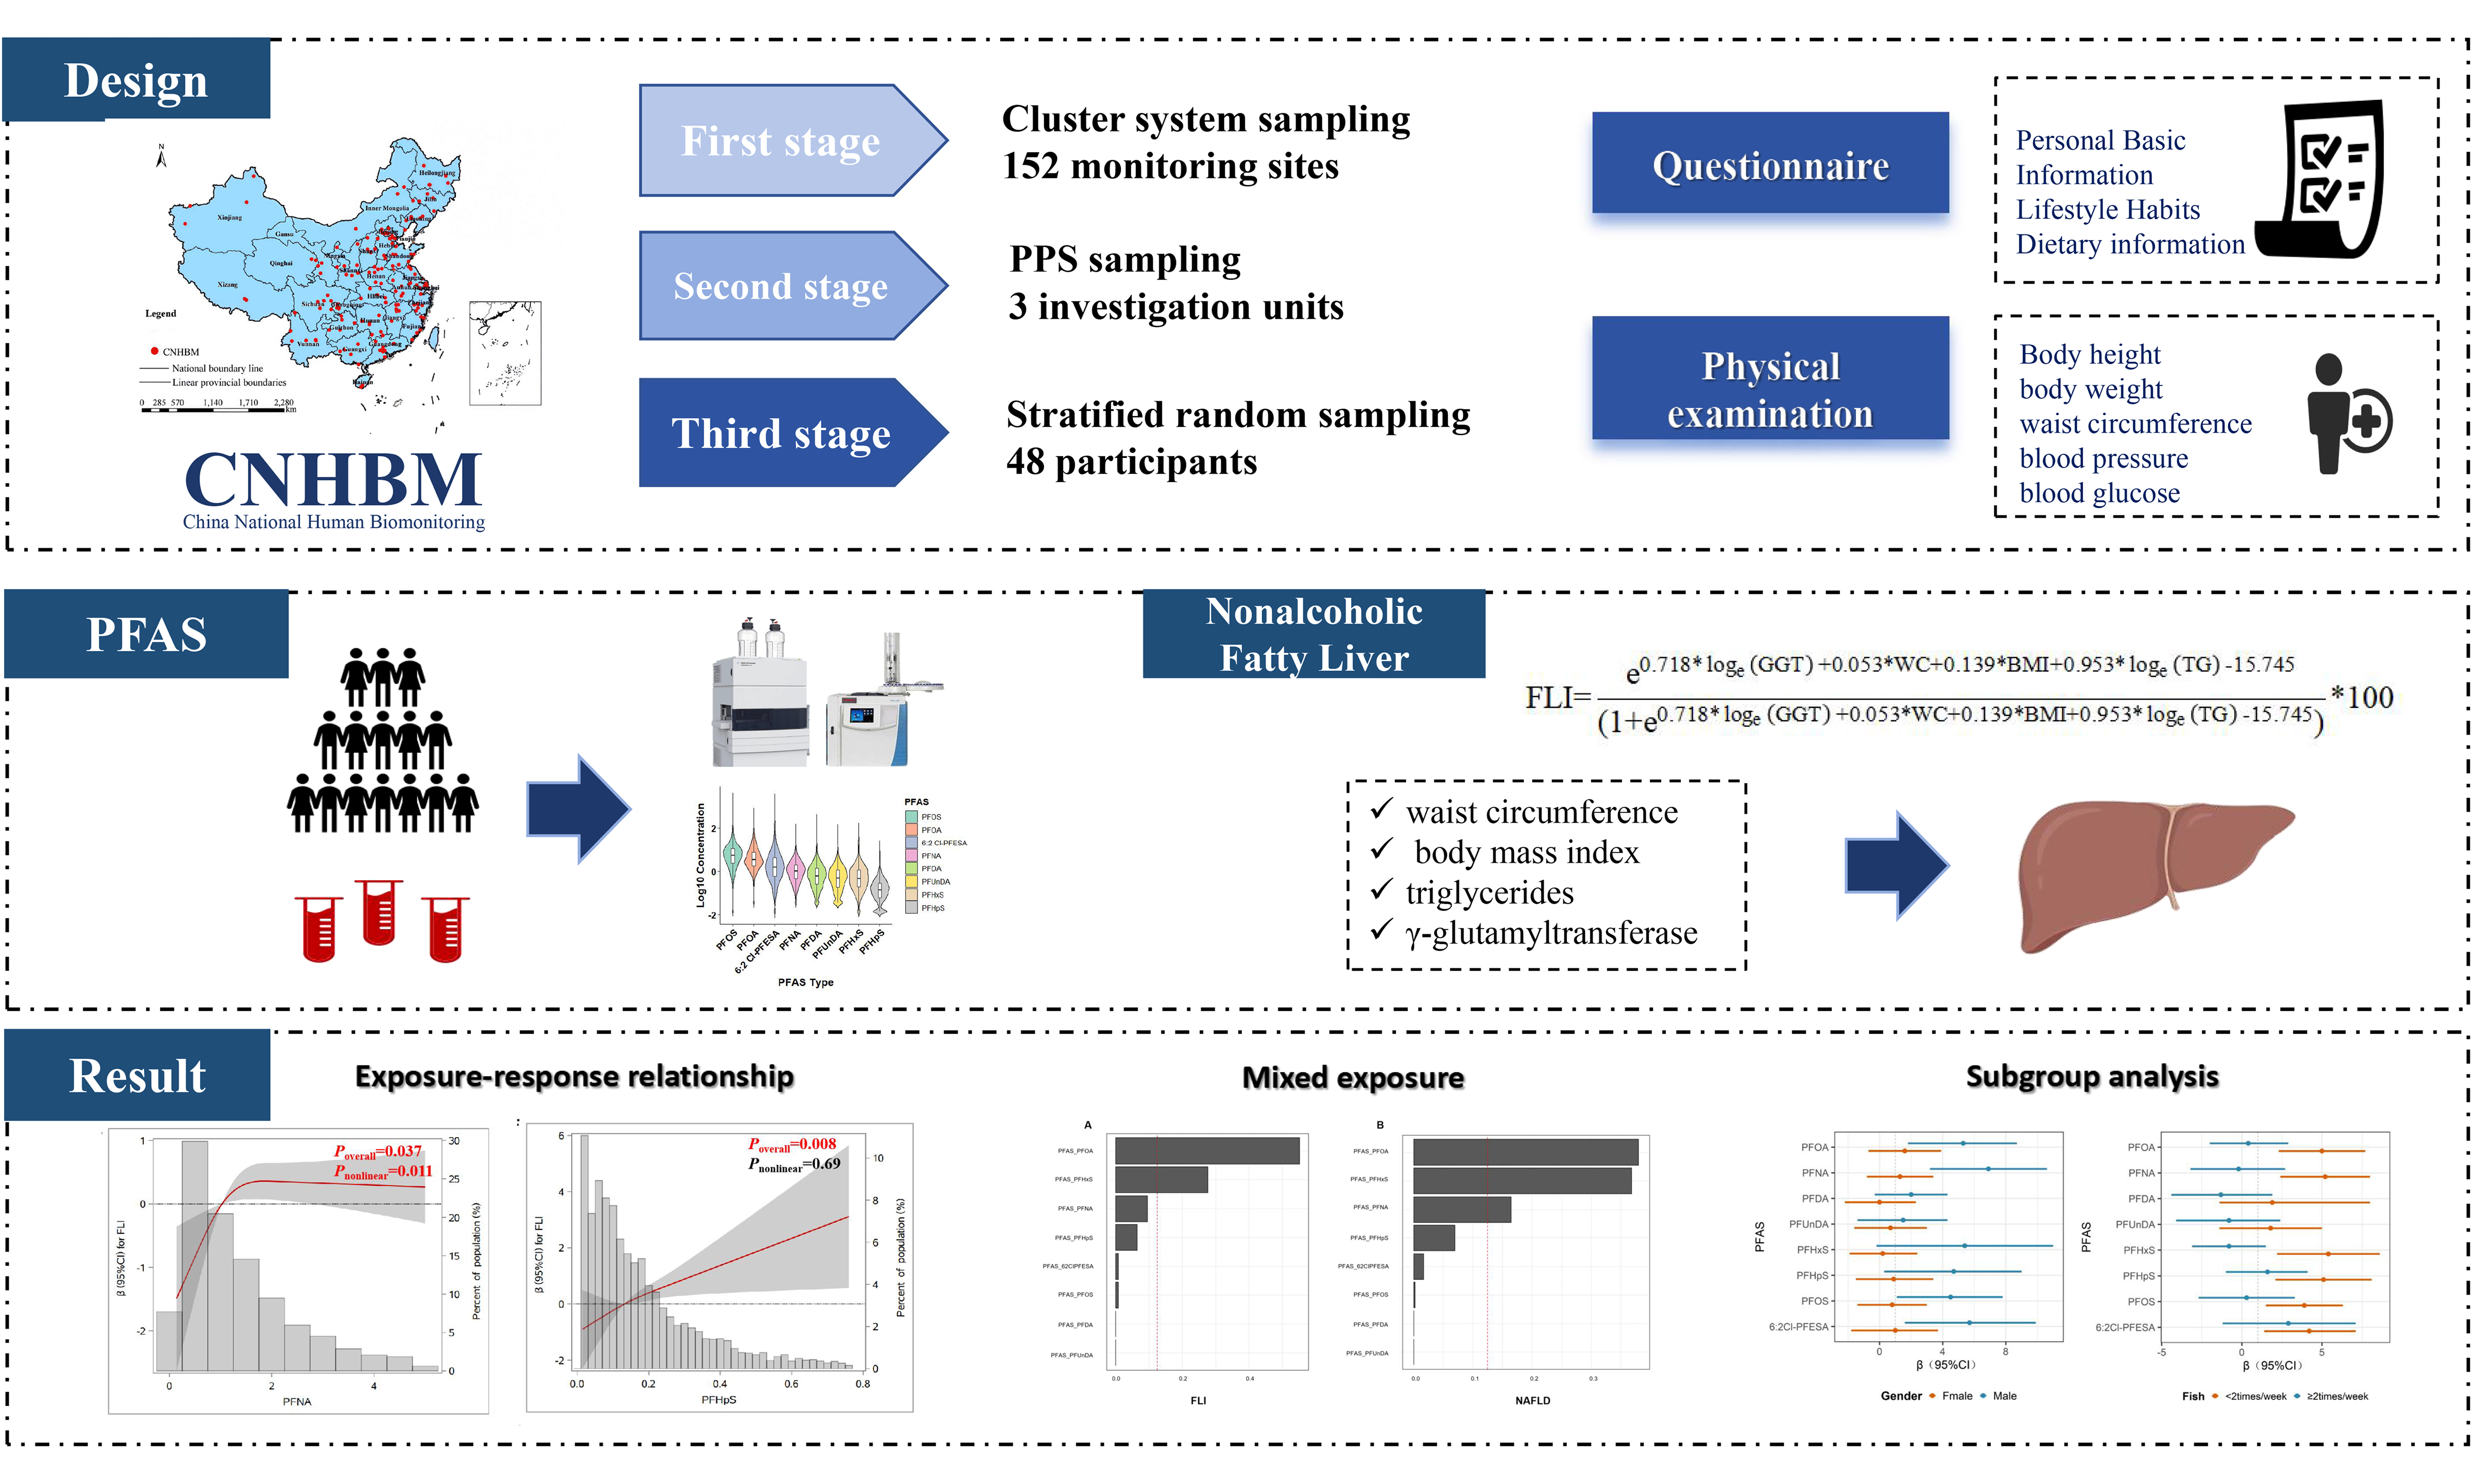
The global prevalence of nonalcoholic fatty liver disease (NAFLD) has been on the rise, with nearly one-quarter of the world’s population currently affected by this condition. Per- and polyfluoroalkyl substances (PFAS) have been suggested as emerging and potentially modifiable environmental risk factors for NAFLD. However, relevant epidemiological evidence remains limited. In the present study, 5,348 adult participants were enrolled from the China National Human Biomonitoring study. The fatty liver index (FLI) was computed using waist circumference, body mass index, triglycerides and γ-glutamyltransferase. NAFLD was defined as an FLI value exceeding 30. To explore the associations of PFAS with FLI and NAFLD, weighted multiple linear regression and logistic regression analyses were performed. Weighted quantile sum regression was applied to assess the joint effects of PFAS mixtures on FLI. The weighted prevalence of NAFLD among study participants was 41.8%. Multiple PFAS congeners were positively associated with FLI. PFAS concentrations were categorized into four equal quartiles from the lowest to the highest level. When comparing the highest quartile (Q4) group with the lowest quartile (Q1) group, the adjusted regression coefficients β [95% confidence interval (CI)] for FLI were as follows: perfluorooctanoic acid (PFOA) 3.63 (1.37-5.89), perfluorooctane sulfonic acid 3.11 (0.87-5.35), perfluorononanoic acid 4.20 (1.82-6.59), perfluorohexane sulfonic acid (PFHxS) 3.62 (0.92-6.32), perfluoroheptane sulfonic acid 3.78 (1.31-6.25) and 6:2 chlorinated polyfluoropolyether sulfonic acid 3.65 (1.02-6.29). PFHxS was positively associated with NAFLD. When comparing Q4 group with Q1 group, the adjusted odds ratio (95%CI) was 1.61 (1.04-2.50). Furthermore, fish consumption appeared to attenuate the adverse effects of PFAS on NAFLD. Exposure to PFAS mixtures was positively associated with FLI, with PFOA and PFHxS identified as the major contributing compounds. These findings support that PFAS may act as an emerging and potentially modifiable environmental risk factor for NAFLD, providing new evidence for the environmental determinants of NAFLD.
Keywords
INTRODUCTION
Nonalcoholic fatty liver disease (NAFLD), characterized by hepatic inflammation and hepatocellular ballooning degeneration, has become an increasingly growing global public health burden[1,2]. The global prevalence of NAFLD has been estimated at approximately 25%[3], ranging from 20% to 44% in Western countries and 5% to 38% in Asian regions[2]. Overall, NAFLD affected nearly 30% of the adult population worldwide[4]. NAFLD includes two major histological subtypes: nonalcoholic fatty liver (NAFL) and nonalcoholic steatohepatitis (NASH). Although most NAFL cases follow a benign course, a proportion of patients may progress to NASH, which can further advance to cirrhosis and hepatocellular carcinoma (HCC)[3]. Therefore, identification of risk factors for NAFLD is of great public health significance. Currently, well-established risk factors for NAFLD include obesity, metabolic disorders[3], genetic variation[5], dietary pattern[6], and gender[7]. A growing number of studies have reported strong associations between environmental exposures and NAFLD[8]. However, limited epidemiological evidence is available regarding the effects of per- and polyfluoroalkyl substances (PFAS) on the risk of NAFLD.
PFAS are characterized by high chemical stability, strong surface activity, water resistance, oil resistance, and dust resistance, and have been widely used in various industrial and consumer products[9]. Human exposure to PFAS occurs mainly via dietary sources, among which fish consumption represents the principal contributor[10]. Following bioaccumulation in the human body, the biological half-life of PFAS may range from 3.5 to 15 years[11]. The emerging PFAS congener, 6:2 chlorinated polyfluoropolyether sulfonic acid (6:2 Cl-PFESA), has been widely detected in the Chinese participants, with its concentration ranking third after perfluorooctane sulfonic acid (PFOS), and perfluorooctanoic acid (PFOA)[12]. Another PFAS with a high detection rate in the Chinese participants was perfluorohexane sulfonic acid (PFHxS), which was suggested to be listed as one of the persistent organic pollutants in Annex A of the Stockholm Convention. PFAS have been shown to promote the progression of fatty liver disease by interfering with metabolic regulation, which supports the “metabolism-disrupting chemical” hypothesis[13]. In recent decades, increasing attention has been paid to the widespread environmental contamination, long persistence, and potential adverse effects of PFAS[14]. Therefore, further investigation is warranted to clarify the impact of PFAS exposure on hepatic lipid metabolism and the development of fatty liver.
The liver is highly vulnerable to xenobiotics and environmental pollutants, and PFAS concentrations in hepatic tissues have been reported to be significantly higher than those in serum[15]. Animal studies have demonstrated that PFAS exposure modulates peroxisome proliferator-activated receptor alpha (PPARα)[16], a key regulator of hepatic lipid metabolism. This perturbation disrupts systemic lipid homeostasis[17], and induces elevations in liver enzyme activity, hepatomegaly, and hepatic steatosis[18]. Prior epidemiological studies have predominantly focused on PFAS-associated alterations in serum biomarkers, such as alanine aminotransferase (ALT)[19-21], with relatively few investigations into its direct association with NAFLD. A cross-sectional study in the United States showed that elevated serum PFOA and perfluorononanoic acid (PFNA) were associated with an increased risk of NAFLD, whereas PFOS and PFHxS showed no statistically significant associations[22]. In contrast, a small-scale cross-sectional study reported positive associations between elevated PFOS, PFOA, and PFHxS concentrations and greater NAFLD severity[23]. Notably, most existing research on PFAS and NAFLD has been limited to small sample sizes, cross-sectional designs, and participants in developed countries, with a paucity of evidence from developing nations[22,23]. Furthermore, epidemiological investigations into the joint effects of PFAS mixture exposure on NAFLD remain scarce, which has constrained the comprehensive understanding of the associations between individual PFAS, PFAS mixtures, and NAFLD risk. Therefore, further large-scale research is warranted to characterize PFAS exposure levels and explore the potential associations of individual PFAS, their mixtures, and the fatty liver index (FLI) with NAFLD. This research may provide valuable insights into the environmental determinants of NAFLD, elucidate potential pathogenesis mechanisms, and inform the development of targeted prevention strategies and control guidelines for NAFLD.
Based on data from China National Human Biomonitoring (CNHBM), the present study aimed to evaluate the association between serum PFAS and NAFLD among Chinese adults aged 18 years and above. Additional analyses were performed to investigate the potential association between PFAS mixed exposure and FLI levels as well as NAFLD. Furthermore, the relative contribution of individual PFAS components was assessed using weighted quantiles sum regression (WQS).
EXPERIMENTAL
Participants
This study used cross-sectional data from the first round of the CNHBM (2017-2018). A three-stage cluster sampling method was employed to recruit 21,748 residents aged 3 to 79 years. These participants were selected from 152 primary sampling units (PSUs) across 31 provinces in China. Each PSU represented an average of 9 million residents, with a range from 13 to 28 million. This study was approved by the Ethics Committee of the National Institute of Environmental Health at the Chinese Center for Disease Control and Prevention (ethics approval number: 201701). Written informed consent was obtained from all participants. Further details on the study design have been previously published[24].
In this study, participants were excluded according to the following criteria. A total of 10,532 subjects under 18 years old were excluded. Additionally, 598 individuals with specific liver diseases and 1,495 participants with excessive alcohol consumption were excluded. The criteria for excessive alcohol intake were defined as > 210 g/week for males or > 140 g/week for females[25]. Additionally, participants were excluded if they had missing key variables, including 41 with missing body mass index (BMI), 390 with missing waist circumference (WC), 233 with missing triglycerides (TG), and 3,110 with missing γ-glutamyltransferase (GGT). One participant who took steatosis-inducing medications was also excluded[26]. Ultimately, 5,348 participants were included in this study [Supplementary Figure 1].
Measurement of PFAS
A 4 mL blood specimen was collected using heparin-containing tubes, and an additional 12 mL blood sample was drawn into non-anticoagulant tubes. These samples were mainly used for clinical laboratory examinations and biomarker measurements, including serum lipids, fasting plasma glucose, and biomarkers related to exposure to chemical toxicants[27]. In this study, 18 PFAS congeners were detected in Chinese adults using an Acquity I-Class ultra-high performance liquid chromatography (UPLC) coupled with a Xevo TQ-S triple-quadrupole mass spectrometer (Waters, Milford, MA, USA). The detailed pretreatment and analysis methods for PFAS samples were carried out in accordance with the previously published methods[28]. Briefly, ion-pair extraction was employed to process 200 μL of serum, with isotopically labeled internal standards added for quantification. Overall, 8 kinds of PFAS with a detection rate exceeding 85% were identified and included in the analysis, specifically PFOA, PFNA, perfluorodecanoic acid (PFDA), perfluoroundecanoic acid (PFUnDA), PFHxS, perfluoroheptane sulfonic acid (PFHpS), PFOS, and 6:2 Cl-PFESA. Quality assurance and control (QA/QC) procedures incorporated procedural blanks, matrix spike recovery tests, analyses of standard reference material, and limit of quantification (LOQ) determinations. Matrix spike recoveries were assessed by spiking mixed native PFAS standards into commercial fetal bovine serum, followed by extraction using the aforementioned protocol[29].
Calculation of the FLI and definition of NAFL
The FLI was utilized as a surrogate marker for the clinical diagnosis of NAFLD[30]. The FLI was calculated using the four variables with the largest standardized regression coefficients: WC, BMI, TG, and GGT. The data for WC, height, and weight (BMI) were obtained from general physical examinations, while the data for GGT and serum TG were obtained from routine clinical biochemical examinations. Based on their regression coefficients, the calculation model of the FLI is as follows[31,32]:
Participants were defined as having NAFLD when the FLI score was ≥ 30.
Covariates
The following data were collected from the standardized questionnaire: age, gender (male or female), geographic region (categorized into six based on China’s national territory: North China, Northeast, East China, Central South, Northwest, and Southwest), marital status (married or unmarried), education (illiterate or non-illiterate), income (< 30,000, 30,000-60,000, 60,000-100,000, ≥ 100,000 yuan, refuse to answer, and unknown), occupation (agriculture, mining, or other occupations), ethnic group (Han ethnicity or ethnic minority), smoking status (yes or no), drinking status (yes or no), physical activity (yes or no), the frequency of fish intake (< 2 times/week, ≥ 2 times/week), and the frequency of meat consumption (0 times/week, < 3 time/week, 3-8 times/week, ≥ 8 times/week). Hypertension was defined as systolic blood pressure ≥ 140 mmHg or diastolic blood pressure ≥ 90 mmHg, or as a prior clinical diagnosis of hypertension with concurrent antihypertensive medication use. Dyslipidemia was diagnosed as triglyceride levels
Statistical analysis
The SAS survey procedure was utilized to incorporate survey sample weights across all analyses, ensuring appropriate adjustment for the complex, stratified, multistage clustered probability sampling framework in CNHBM. Given the skewed distribution of the data, all continuous variables were reported as weighted geometric means (GMs) with weighted standard errors (SEs). Categorical variables were reported as numbers and weighted percentages. The PFAS levels were converted into quartiles (Q1, Q2, Q3, Q4) for analysis.
The regression coefficients (β) and 95% confidence intervals (CIs) for the PFAS and FLI were estimated using multiple linear regression models with SAS version 9.4. Additionally, weighted multivariable logistic regression was used to examine the associations between individual PFAS congeners and NAFLD. The Benjamini-Hochberg (BH) approach was adopted to adjust for multiple comparisons and control the false discovery rate (FDR) [Supplementary Tables 1 and 2]. Multiple testing correction was separately conducted for P-values obtained from the association analyses of PFAS with FLI and NAFLD. The dose-response relationships between PFAS and FLI, as well as NAFLD, were evaluated using restricted cubic spline (RCS) analysis. Additionally, the WQS model was applied to assess the cumulative effect of the PFAS mixture on FLI and NAFLD using R software (version 4.4.2). WQS assumes a consistent direction of effect for all components within the mixture on the outcome, and generates an interpretable overall mixture index along with the relative weights of individual PFAS congeners[34].
Stratified analyses were performed to evaluate potential effect modifications based on age (18-39, 40-59, 60-79), gender (male or female), hypertension status (yes or no), fish consumption frequency (more or less than 2 times a week), BMI (≥ 24 kg/m2 or < 24 kg/m2), and dyslipidemia status (yes or no). Several sensitivity analyses were conducted within multiple linear regression to assess the robustness of the results: (1) Extreme PFAS values exceeding the 99th percentile (> P99) were excluded from the multiple linear regression analysis; (2) Participants with PFAS concentrations below the LOQ were removed from the analysis; and (3) Individuals diagnosed with dyslipidemia and hypertension were excluded to minimize potential confounding effects; (4)An additional sensitivity analysis was performed, in which participants were defined as having NAFLD when the FLI score was ≥ 60 (a cutoff for identifying moderate-to-severe hepatic steatosis), to assess the robustness of the primary results.
RESULTS AND DISCUSSION
Study participants
The characteristics of the study participants are summarized in Table 1. Participants ranged in age from 18 to 79 years, with a mean age of 46 years. In total, 57.0% of the participants were female, 43.0% were male, 83.2% were married, 34.8% reported alcohol consumption, and 23.0% were current smokers; Han Chinese individuals accounted for 90.0% of the study participants. Regarding metabolic health, the weighted prevalence of dyslipidemia and hypertension was 35.6% and 35.8%, respectively. The weighted prevalence of NAFLD in the overall participants was 41.8%. Among the detected PFAS congeners, PFOS had the highest geometric mean concentration (5.40 ng/mL), followed by PFOA (4.18 ng/mL) and 6:2 Cl-PFESA (1.73 ng/mL) [Table 1].
Characteristics of the study population
| Characteristics | Total | Non-NAFLD | NAFLD | P |
| (N = 5,348) | (N = 3,113) | (N = 2,235) | ||
| Serum PFOA, ng/mL, GM ± SE | 4.18 ± 0.25 | 3.93 ± 0.23 | 4.52 ± 0.34 | 0.100 |
| Serum PFNA, ng/mL, GM ± SE | 1.03 ± 0.06 | 0.96 ± 0.06 | 1.12 ± 0.07 | 0.690 |
| Serum PFDA, ng/mL, GM ± SE | 0.62 ± 0.04 | 0.61 ± 0.04 | 0.62 ± 0.04 | 0.270 |
| Serum PFUnDA, ng/mL, GM ± SE | 0.46 ± 0.03 | 0.48 ± 0.04 | 0.44 ± 0.03 | 0.140 |
| Serum PFHxS, ng/mL, GM ± SE | 0.51 ± 0.04 | 0.45 ± 0.04 | 0.60 ± 0.05 | 0.650 |
| Serum PFHpS, ng/mL, GM ± SE | 0.14 ± 0.01 | 0.12 ± 0.01 | 0.17 ± 0.01 | < 0.001 |
| Serum PFOS, ng/mL, GM ± SE | 5.40 ± 0.38 | 4.92 ± 0.36 | 6.06 ± 0.45 | 0.560 |
| Serum 6:2 Cl-PFESA, ng/mL, GM ± SE | 1.73 ± 0.14 | 1.68 ± 0.16 | 1.79 ± 0.15 | 0.200 |
| Age, GM ± SE, years | 45.91 ± 0.38 | 43.62 ± 0.52 | 48.90 ± 0.51 | < 0.001 |
| Gender | < 0.001 | |||
| Female | 3,047 (57.0) | 1,975 (63.4) | 1,072 (48.0) | |
| Male | 2,301 (43.0) | 1,138 (36.6) | 1,163 (52.0) | |
| Occupation | 0.010 | |||
| Agriculture | 1,005 (19.0) | 623 (20.3) | 382 (17.3) | |
| Mining industry | 504 (9.50) | 291 (9.40) | 213 (9.60) | |
| Other occupations | 3,782 (71.5) | 2,162 (70.3) | 1,620 (73.1) | |
| Race/ethnicity | 0.746 | |||
| Other nationalities | 531 (10.0) | 307 (9.9) | 224 (10.1) | |
| Han nationality | 4,796 (90.0) | 2,793 (90.1) | 2,003 (89.9) | |
| Marriage | < 0.001 | |||
| Unmarried | 895 (16.8) | 581 (18.8) | 314 (14.1) | |
| Married | 4,420 (83.2) | 2,509 (81.2) | 1,911 (85.9) | |
| Annual income, Yuan | 0.082 | |||
| < 30,000 | 1,834 (34.5) | 1,076 (34.8) | 758 (34.1) | |
| 30,000-60,000 | 1,347 (25.3) | 768 (24.8) | 579 (26.0) | |
| 60,000-100,000 | 888 (16.7) | 495 (16.0) | 393 (17.7) | |
| ≥ 100,000 | 621 (11.7) | 376 (12.1) | 245 (11.0) | |
| Refuse to answer | 98 (1.80) | 56 (1.8) | 42 (1.90) | |
| Unknown | 532 (10.0) | 325 (10.5) | 207 (9.30) | |
| Educational level | 0.270 | |||
| Illiterate | 551 (10.4) | 283 (9.10) | 268 (12.0) | |
| Non-illiterate | 4,770 (89.6) | 2,811 (90.9) | 1,959 (88.0) | |
| Cigarette smoking | 0.029 | |||
| No | 4,100 (77.0) | 2,463 (79.5) | 1,637 (73.5) | |
| Yes | 1,225 (23.0) | 635 (20.5) | 590 (26.5) | |
| Drinking | 0.021 | |||
| No | 3,470 (65.2) | 2,041 (65.9) | 1,429 (64.2) | |
| Yes | 1,854 (34.8) | 1,056 (34.1) | 798 (35.8) | |
| Marine fish, times/week | 0.650 | |||
| < 2 | 3,707 (69.7) | 2,161 (69.9) | 1,546 (69.5) | |
| ≥ 2 | 1,610 (30.3) | 932 (30.1) | 678 (30.5) | |
| Meat, times/week | 0.457 | |||
| 0 | 325 (6.10) | 189 (6.10) | 136 (6.10) | |
| < 3 | 1,450 (27.1) | 820 (26.4) | 630 (28.2) | |
| ≥ 3 to < 8 | 2,414 (45.1) | 1,424 (45.7) | 990 (44.3) | |
| ≥ 8 | 1,159 (21.7) | 680 (21.8) | 479 (21.4) | |
| Exercise | 0.661 | |||
| No | 2,683 (50.4) | 1,513 (48.9) | 1,170 (52.5) | |
| Yes | 2,639 (49.6) | 1,582 (51.1) | 1,057 (47.5) | |
| Area | 0.147 | |||
| Central South | 989 (18.5) | 611 (19.6) | 378 (16.9) | |
| East China | 1,999 (37.4) | 1,212 (38.9) | 787 (35.2) | |
| North China | 662 (12.4) | 340 (10.9) | 322 (14.4) | |
| Northeast | 646 (12.1) | 332 (10.7) | 314 (14.0) | |
| Northwest | 740 (13.8) | 428 (13.8) | 312 (14.0) | |
| Southwest | 312 (5.80) | 190 (6.10) | 122 (5.50) | |
| Hypertension | < 0.001 | |||
| No | 3,436 (64.2) | 2,315 (74.4) | 1,121 (50.2) | |
| Yes | 1,912 (35.8) | 798 (25.6) | 1,114 (49.8) | |
| CKD | 0.561 | |||
| No | 4,490 (94.6) | 2,644 (95.3) | 1,846 (93.6) | |
| Yes | 257 (5.40) | 131 (4.70) | 126 (6.40) | |
| BMI, kg/m2 | < 0.001 | |||
| < 18.5 | 255 (4.80) | 254 (8.20) | 1 (0.00) | |
| ≥ 18.5 to < 24.0 | 2,439 (45.6) | 2,139 (68.6) | 300 (13.4) | |
| ≥ 24.0 to < 28.0 | 1,839 (34.4) | 684 (22.0) | 1,155 (51.7) | |
| > 28.0 | 815 (15.2) | 36 (1.20) | 779 (34.9) | β |
| Dyslipidemia | < 0.001 | |||
| No | 3,445 (64.4) | 2,473 (79.4) | 972 (44.5) | |
| Yes | 1,903 (35.6) | 640 (20.6) | 1,263 (56.5) |
Associations of PFAS with FLI
In the crude model, PFOA, PFNA, PFHxS, PFHpS, PFOS, and 6:2 Cl-PFESA were positively associated with higher FLI values. PFAS concentrations were categorized into four equal quartiles from the lowest to the highest level. When comparing the highest quartile (Q4) group with the lowest quartile (Q1) group, the adjusted regression coefficients β (95%CI) for FLI were as follows: PFOA 7.11 (2.99-11.20), PFNA 5.33 (2.15-8.51), PFHxS 10.2 (5.45-14.90), PFHpS 14.40 (9.87-18.90), PFOS 9.05 (5.73-12.40), and 6:2 Cl-PFESA 4.47 (0.70-8.24). These positive associations remained significant in the fully adjusted model (Model 3), Specifically, the adjusted regression coefficients β (95%CI) for FLI were as follows: PFOA 3.63 (1.37-5.89), PFNA 4.20 (1.82-6.59), PFHxS 3.62 (0.92-6.32), PFHpS 3.78 (1.31-6.25), PFOS 3.11 (0.87-5.35) and 6:2 Cl-PFESA 3.65 (1.02-6.29) [Table 2].
Association between PFAS and FLI in all participants
| PFAS | Crude model | Model 1 | Model 2 | Model 3 |
| β (95%CI) | β (95%CI) | β (95%CI) | β (95%CI) | |
| PFOA | ||||
| Q1 | Reference | Reference | Reference | Reference |
| Q2 | 5.41 (2.41-8.40)* | 2.68 (-0.66-6.01) | 2.82 (-0.56-6.19) | 2.14 (0.64-3.64)# |
| Q3 | 7.23 (3.34-11.1)* | 5.03 (0.90-9.16)# | 5.03 (0.76-9.29)# | 2.63 (0.26-4.99)# |
| Q4 | 7.11 (2.99-11.2)* | 5.33 (1.23-9.44)# | 5.57 (1.30-9.83)# | 3.63 (1.37-5.89)# |
| PFNA | ||||
| Q1 | Reference | Reference | Reference | Reference |
| Q2 | 3.16 (0.16-6.16)# | 3.48 (1.01-5.95)# | 3.46 (0.93-5.99)# | 0.49 (-1.30-2.27) |
| Q3 | 8.20 (4.42-12.00)* | 7.76 (4.07-11.4)* | 7.76 (4.06-11.50)* | 4.18 (1.88-6.47)* |
| Q4 | 5.33 (2.15-8.51)# | 4.46 (-0.20-9.11) | 4.73 (0.26-9.21)# | 4.20 (1.82-6.59)* |
| PFDA | ||||
| Q1 | Reference | Reference | Reference | Reference |
| Q2 | 2.51 (-1.40-6.42) | 1.53 (-1.18-4.24) | 1.20 (-1.55-3.95) | 0.81 (-1.17-2.79) |
| Q3 | 4.42 (1.09-7.74)# | 3.05 (-0.17-6.27) | 2.75 (-0.50-6.00) | 2.93 (0.84-5.02)# |
| Q4 | -0.22 (-3.05-2.61) | -2.03 (-7.14-3.08) | -2.28 (-7.05-2.48) | 1.08 (-0.79-2.94) |
| PFUnDA | ||||
| Q1 | Reference | Reference | Reference | Reference |
| Q2 | 3.03 (0.01-6.05)# | 1.83 (-0.65-4.32) | 1.37 (-1.01-3.75) | -0.05 (-1.94-1.84) |
| Q3 | 2.74 (-1.04-6.52) | 0.80 (-2.64-4.25) | 0.31 (-3.25-3.86) | 1.83 (-0.29-3.95) |
| Q4 | -2.22 (-5.07-0.63) | -3.71 (-8.61-1.20) | -4.43 (-9.09-0.23) | 1.04 (-1.01-3.08) |
| PFHxS | ||||
| Q1 | Reference | Reference | Reference | Reference |
| Q2 | 4.40 (1.98-6.83)* | 1.93 (-0.96-4.82) | 1.95 (-0.95-4.84) | 0.36 (-2.19-2.91) |
| Q3 | 10.50 (7.28-13.70)* | 5.93 (2.10-9.77)# | 5.75 (1.71-9.80)# | 2.63 (0.28-4.99)# |
| Q4 | 10.20 (5.45-14.90)* | 5.99 (2.11-9.87)# | 6.14 (1.86-10.4)# | 3.62 (0.92-6.32)# |
| PFHpS | ||||
| Q1 | Reference | Reference | Reference | Reference |
| Q2 | 4.83 (2.54-7.11)* | 3.28 (0.98-5.59)# | 3.38 (1.03-5.74)# | 1.26 (-0.52-3.03) |
| Q3 | 10.60 (7.80-13.40)* | 6.71 (3.98-9.45)* | 6.87 (3.94-9.80)* | 1.78 (-0.61-4.17) |
| Q4 | 14.40 (9.87-18.90)* | 9.12 (5.37-12.90)* | 9.21 (4.99-13.40)* | 3.78 (1.31-6.25)# |
| PFOS | ||||
| Q1 | Reference | Reference | Reference | Reference |
| Q2 | 4.66 (2.41-6.90)* | 3.46 (1.33-5.59)# | 3.52 (1.32-5.73)# | 0.37 (-1.90-2.64) |
| Q3 | 9.19 (4.82-13.60)* | 6.79 (3.43-10.20)* | 6.76 (3.26-10.30)* | 1.84 (-0.50-4.19) |
| Q4 | 9.05 (5.73-12.40)* | 6.38 (2.86-9.90)* | 6.54 (3.13-9.95)* | 3.11 (0.87-5.35)# |
| 6:2 Cl-PFESA | ||||
| Q1 | Reference | Reference | Reference | Reference |
| Q2 | 3.00 (0.07-5.93)# | 1.79 (-0.99-4.57) | 1.58 (-1.34-4.50) | 2.37 (0.10-4.65)# |
| Q3 | 7.14 (3.27-11.00)* | 5.01 (2.02-8.00)# | 5.01 (2.04-7.98)# | 4.02 (1.90-6.14)* |
| Q4 | 4.47 (0.70-8.24)# | 3.25 (-0.52-7.02) | 3.28 (-0.54-7.10) | 3.65 (1.02-6.29)# |
Associations of PFAS with NAFLD
In the crude model, positive associations were observed between PFOA, PFNA, PFHxS, PFHpS, PFOS, and 6:2 Cl-PFESA and the risk of NAFLD. When comparing Q4 group with Q1 group, the odds ratio (OR) (95%CI) were as follows: PFOA 1.55 (1.18-2.03), PFNA 1.41 (1.13-1.75), PFHxS 2.01 (1.48-2.73), PFHpS 2.80 (2.00-3.92), PFOS 1.91 (1.47-2.46) and 6:2 Cl-PFESA 1.29 (1.01-1.65). However, after full adjustment in Model 3, most of these associations lost statistical significance. Notably, PFHxS emerged as the only compound independently associated with NAFLD risk (OR = 1.61, 95%CI = 1.04-2.50), a finding that remained robust after adjusting for metabolic covariates [Table 3].
Association between PFAS and NAFL in all participants
| PFAS | Crude model | Model 1 | Model 2 | Model 3 |
| OR (95%CI) | OR (95%CI) | OR (95%CI) | OR (95%CI) | |
| PFOA | ||||
| Q1 | Reference | Reference | Reference | Reference |
| Q2 | 1.45 (1.16-1.82)# | 1.21 (0.94-1.57) | 1.22 (0.94-1.60) | 1.26 (0.94-1.69) |
| Q3 | 1.55 (1.17-2.07)# | 1.38 (0.97-1.95) | 1.39 (0.96-2.01) | 1.22 (0.80-1.86) |
| Q4 | 1.55 (1.18-2.03)# | 1.36 (0.99-1.89) | 1.38 (0.97-1.95) | 1.33 (0.86-2.05) |
| PFNA | ||||
| Q1 | Reference | Reference | Reference | Reference |
| Q2 | 1.19 (0.92-1.56) | 1.18 (0.95-1.47) | 1.17 (0.92-1.48) | 0.79 (0.56-1.13) |
| Q3 | 1.67 (1.32-2.12)* | 1.59 (1.21-2.09)* | 1.57 (1.19-2.09)# | 1.58 (1.03-2.42)# |
| Q4 | 1.41 (1.13-1.75)# | 1.25 (0.90-1.74) | 1.25 (0.89-1.76) | 1.40 (0.91-2.13) |
| PFDA | ||||
| Q1 | Reference | Reference | Reference | Reference |
| Q2 | 1.12 (0.82-1.53) | 1.03 (0.80-1.32) | 1.00 (0.77-1.29) | 0.96 (0.64-1.45) |
| Q3 | 1.42 (1.10-1.83)# | 1.28 (0.97-1.69) | 1.24 (0.94-1.63) | 1.75 (1.07-2.86)# |
| Q4 | 1.01 (0.82-1.24) | 0.86 (0.60-1.22) | 0.82 (0.59-1.15) | 1.22 (0.82-1.82) |
| PFUnDA | ||||
| Q1 | Reference | Reference | Reference | Reference |
| Q2 | 1.07 (0.89-1.29) | 0.95 (0.79-1.14) | 0.91 (0.76-1.10) | 0.62 (0.46-0.84)# |
| Q3 | 1.12 (0.90-1.41) | 0.91 (0.71-1.17) | 0.87 (0.66-1.14) | 0.91 (0.63-1.32) |
| Q4 | 0.82 (0.65-1.02) | 0.67 (0.46-0.96)# | 0.61 (0.42-0.89)# | 0.82 (0.59-1.14) |
| PFHxS | ||||
| Q1 | Reference | Reference | Reference | Reference |
| Q2 | 1.27 (1.04-1.56)# | 1.09 (0.85-1.39) | 1.10 (0.86-1.41) | 1.00 (0.72-1.38) |
| Q3 | 2.07 (1.65-2.61)* | 1.54 (1.17-2.02)# | 1.51 (1.13-2.02)# | 1.40 (0.93-2.10) |
| Q4 | 2.01 (1.48-2.73)* | 1.52 (1.17-1.97)# | 1.54 (1.14-2.07)# | 1.61 (1.04-2.50)# |
| PFHpS | ||||
| Q1 | Reference | Reference | Reference | Reference |
| Q2 | 1.44 (1.19-1.74)* | 1.28 (1.05-1.56)# | 1.29 (1.05-1.58)# | 1.22 (0.88-1.69) |
| Q3 | 1.96 (1.58-2.42)* | 1.46 (1.17-1.82)* | 1.47 (1.15-1.87)# | 1.08 (0.70-1.68) |
| Q4 | 2.80 (2.00-3.92)* | 1.87 (1.41-2.49)* | 1.89 (1.38-2.60)* | 1.58 (0.98-2.57) |
| PFOS | ||||
| Q1 | Reference | Reference | Reference | Reference |
| Q2 | 1.34 (1.11-1.61)# | 1.23 (1.02-1.48)# | 1.23 (1.00-1.50)# | 0.91 (0.61-1.34) |
| Q3 | 1.71 (1.27-2.32)* | 1.44 (1.11-1.86)# | 1.41 (1.06-1.88)# | 0.97 (0.61-1.54) |
| Q4 | 1.91 (1.47-2.46)* | 1.53 (1.18-1.97)* | 1.52 (1.18-1.96)* | 1.37 (0.91-2.06) |
| 6:2 Cl-PFESA | ||||
| Q1 | Reference | Reference | Reference | Reference |
| Q2 | 1.19 (0.94-1.52) | 1.09 (0.86-1.39) | 1.07 (0.82-1.39) | 1.17 (0.81-1.71) |
| Q3 | 1.57 (1.16-2.11)# | 1.34 (1.04-1.72)# | 1.34 (1.04-1.73)# | 1.46 (0.92-2.33) |
| Q4 | 1.29 (1.01-1.65)# | 1.13 (0.88-1.46) | 1.12 (0.84-1.48) | 1.37 (0.86-2.20) |
Associations of PFAS mixtures with FLI and dose-response association between PFAS and FLI
FLI was evaluated using the WQS model. The PFAS mixture was positively associated with FLI levels (β = 0.90, 95%CI: 0.10, 1.70) (P = 0.03). The relative contributions of individual PFAS to the joint effect were as follows: PFOA (55.1%), PFHxS (27.5%), PFNA (9.5%), PFHpS (6.4%), 6:2 Cl-PFESA (0.8%), PFOS (0.7%), PFDA (0.0%), and PFUnDA (0.0%). Conversely, the combined exposure to these eight PFAS was not significantly associated with NAFLD (β = 0.13, 95%CI: -0.03, 0.28), (P = 0.11) [Supplementary Table 3 and Figure 1].
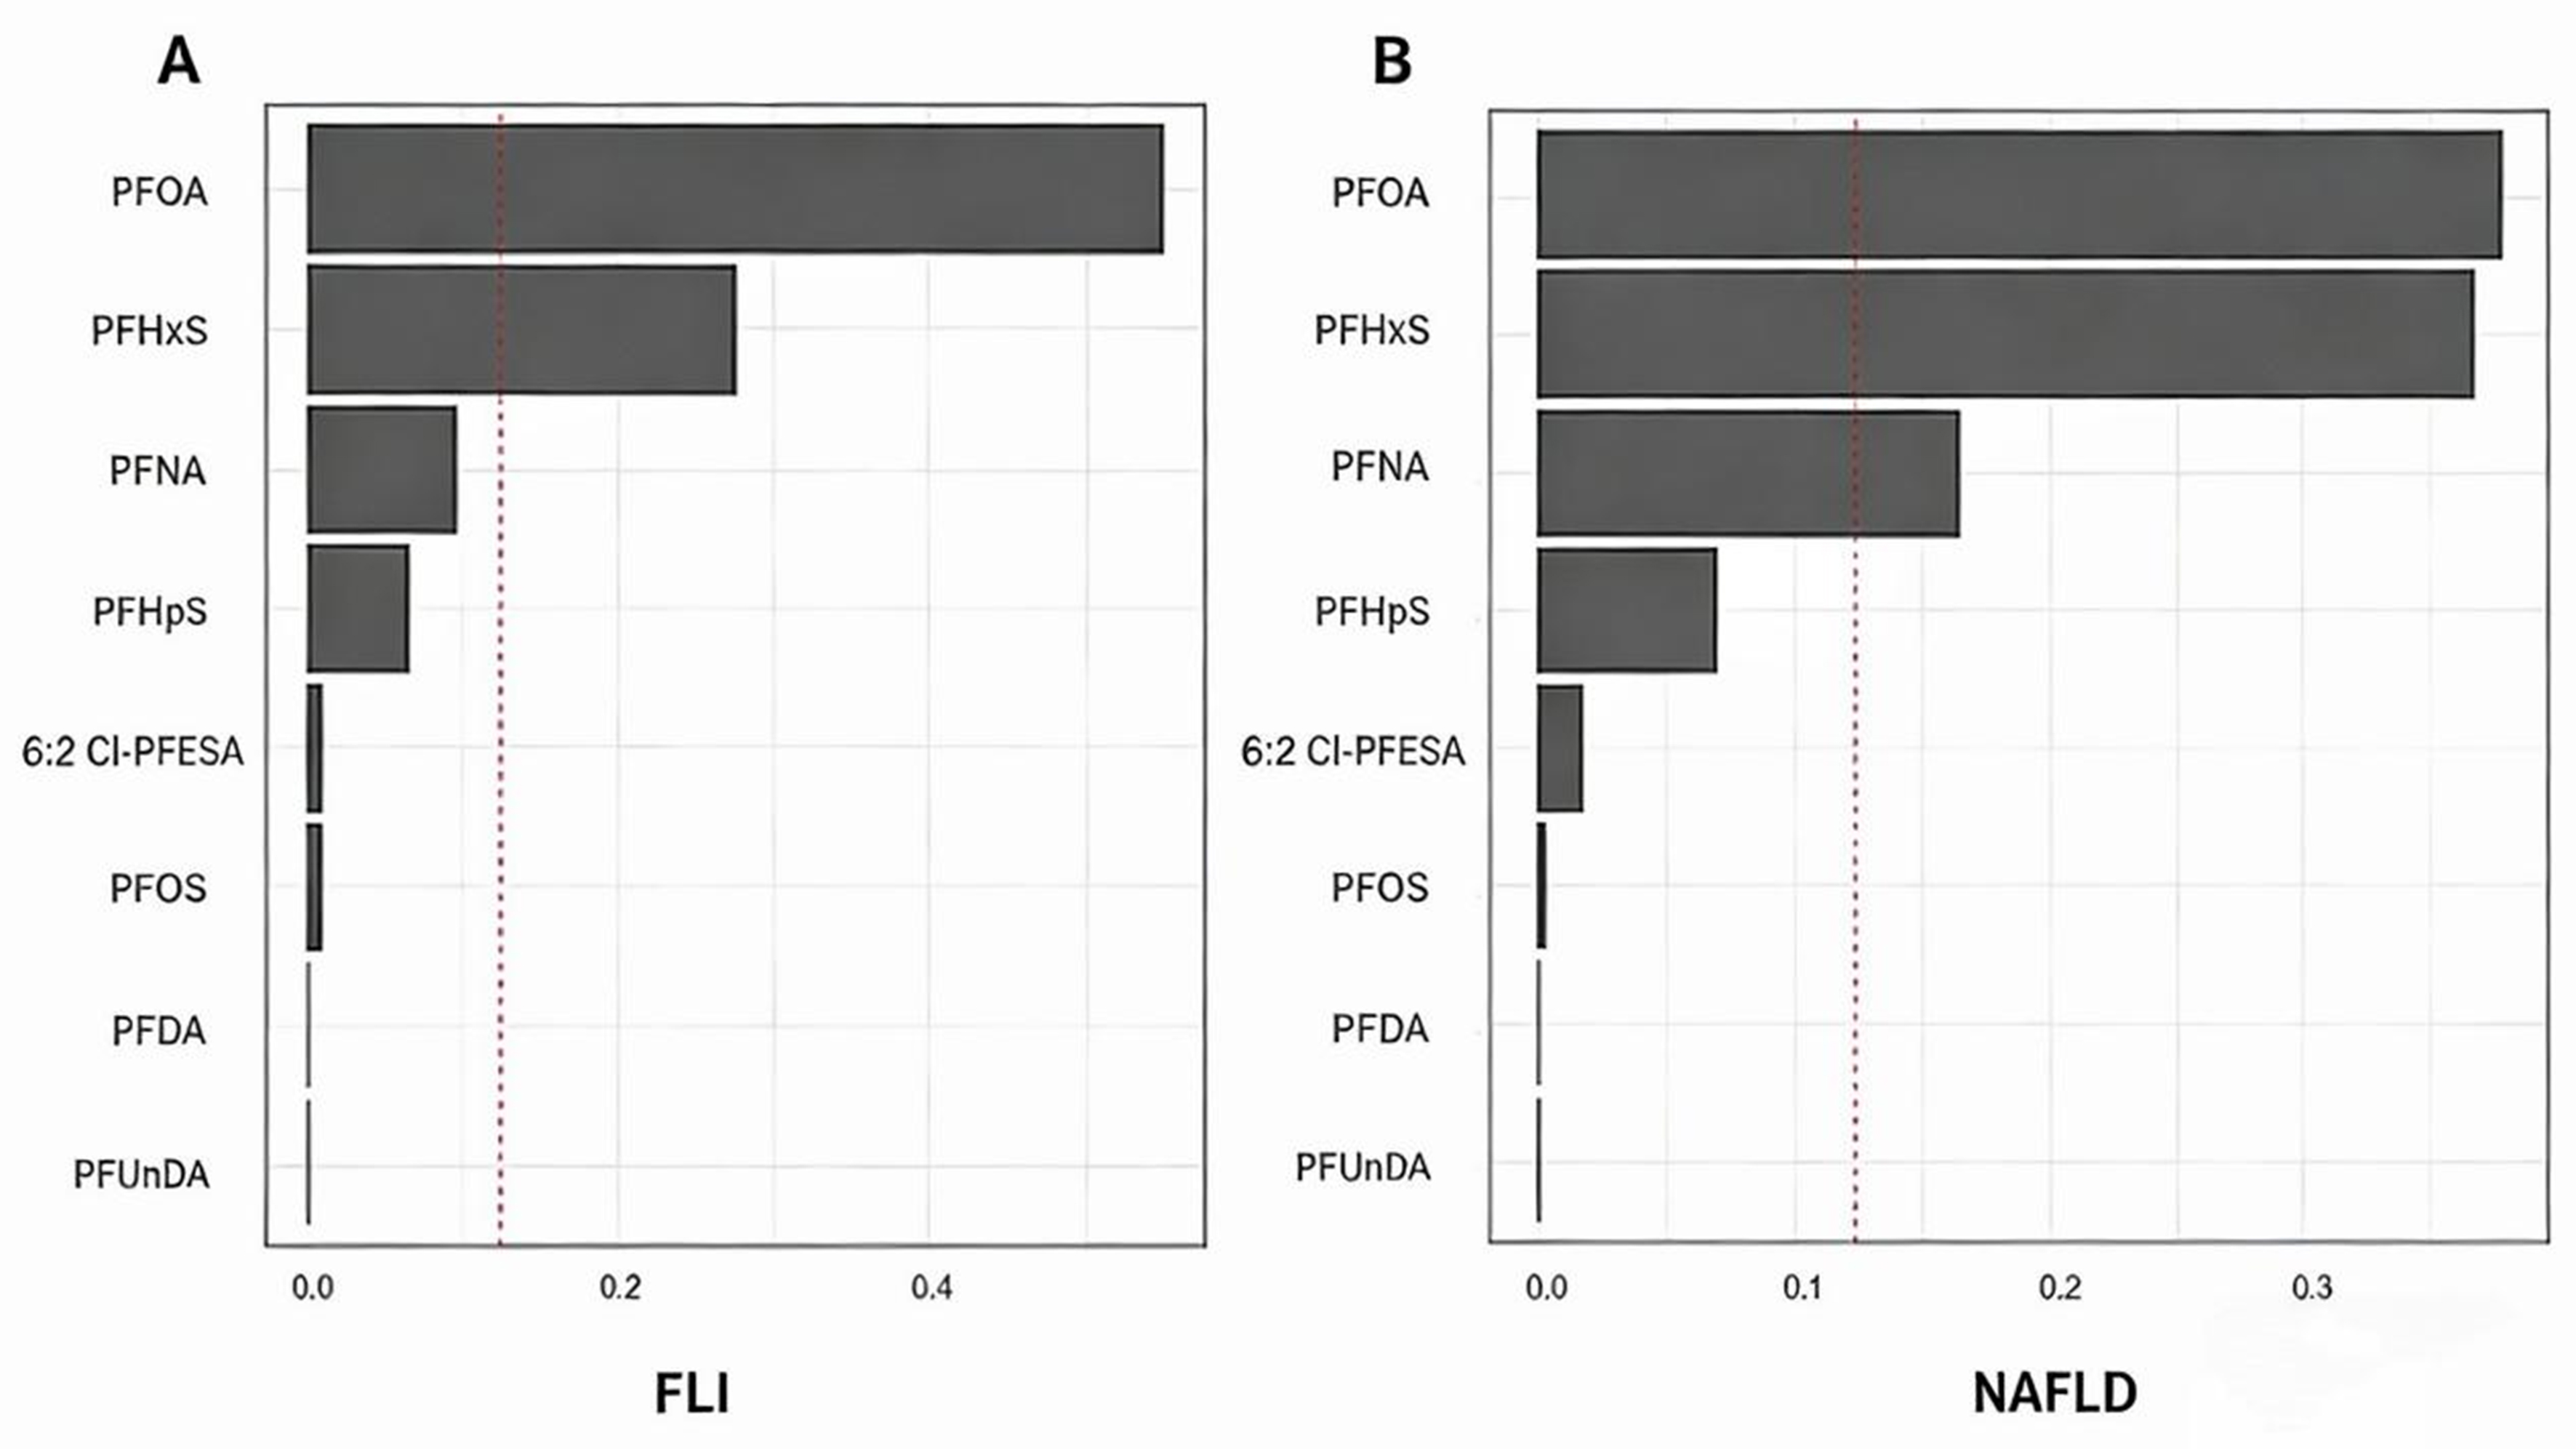
Figure 1. The weight of each PFAS component in the effect of exposure to PFAS mixture on FLI and NAFLD by WQS model. (A) Weight of each PFAS on the associations of PFAS mixtures with FLI; (B) Weight of each PFAS on the associations of PFAS mixtures with NAFLD. Positive WQS models were fitted for all participants. Weights of each PFAS congener are represented by the bar-chart. Models were adjusted by age, gender, marriage, study site, nationality, education, occupation and household income, smoking, drinking, fish consumption frequency, meat consumption frequency, activity, BMI, CKD, dyslipidemia and hypertension. PFAS: Per- and polyfluoroalkyl substances; FLI: fatty liver index; NAFLD: nonalcoholic fatty liver disease; WQS: weighted quantile sum regression; BMI: body mass index; CKD: chronic kidney disease; PFOA: perfluorooctanoic acid; PFHxS: perfluorohexane sulfonic acid; PFNA: perfluorononanoic acid; PFHpS: perfluoroheptane sulfonic acid; 6:2 Cl-PFESA: 6:2 chlorinated polyfluoropolyether sulfonic acid; PFOS: perfluorooctane sulfonic acid; PFDA: perfluorodecanoic acid; PFUnDA: perfluoroundecanoic acid.
Dose-response analysis indicated that PFHpS was linearly associated with FLI levels while PFOA, PFNA, PFHxS, and 6:2 Cl-PFESA exhibited non-linear relationships. [Supplementary Figure 3]. Additionally, 6:2 Cl-PFESA was linearly associated with the risk of NAFLD, while PFNA demonstrated a non-linear association [Supplementary Figure 4].
Subgroup and sensitivity analysis
Subgroup analyses revealed the positive associations for Serum PFNA and PFHxS were more pronounced among participants aged 40 to 59 years, the adjusted regression coefficients β (95%CI) for FLI were as follows: PFNA 5.80 (1.47-8.69), and PFHxS 5.27 (1.68-8.85). Furthermore, the positive associations for Serum PFOA, PFNA, PFHpS, PFOS, and 6:2 Cl-PFESA were more pronounced in males, the adjusted regression coefficients β (95%CI) for FLI were as follows: PFOA 5.26 (1.77-8.74), PFNA 6.89 (3.20-10.6), PFHpS 4.67 (0.318-9.03), PFOS 4.45 (1.07-7.83), and 6:2 Cl-PFESA 5.75 (1.64-9.86). Similar results were observed for participants who consumed fish less than twice a week [Figure 2 and Supplementary Table 4].
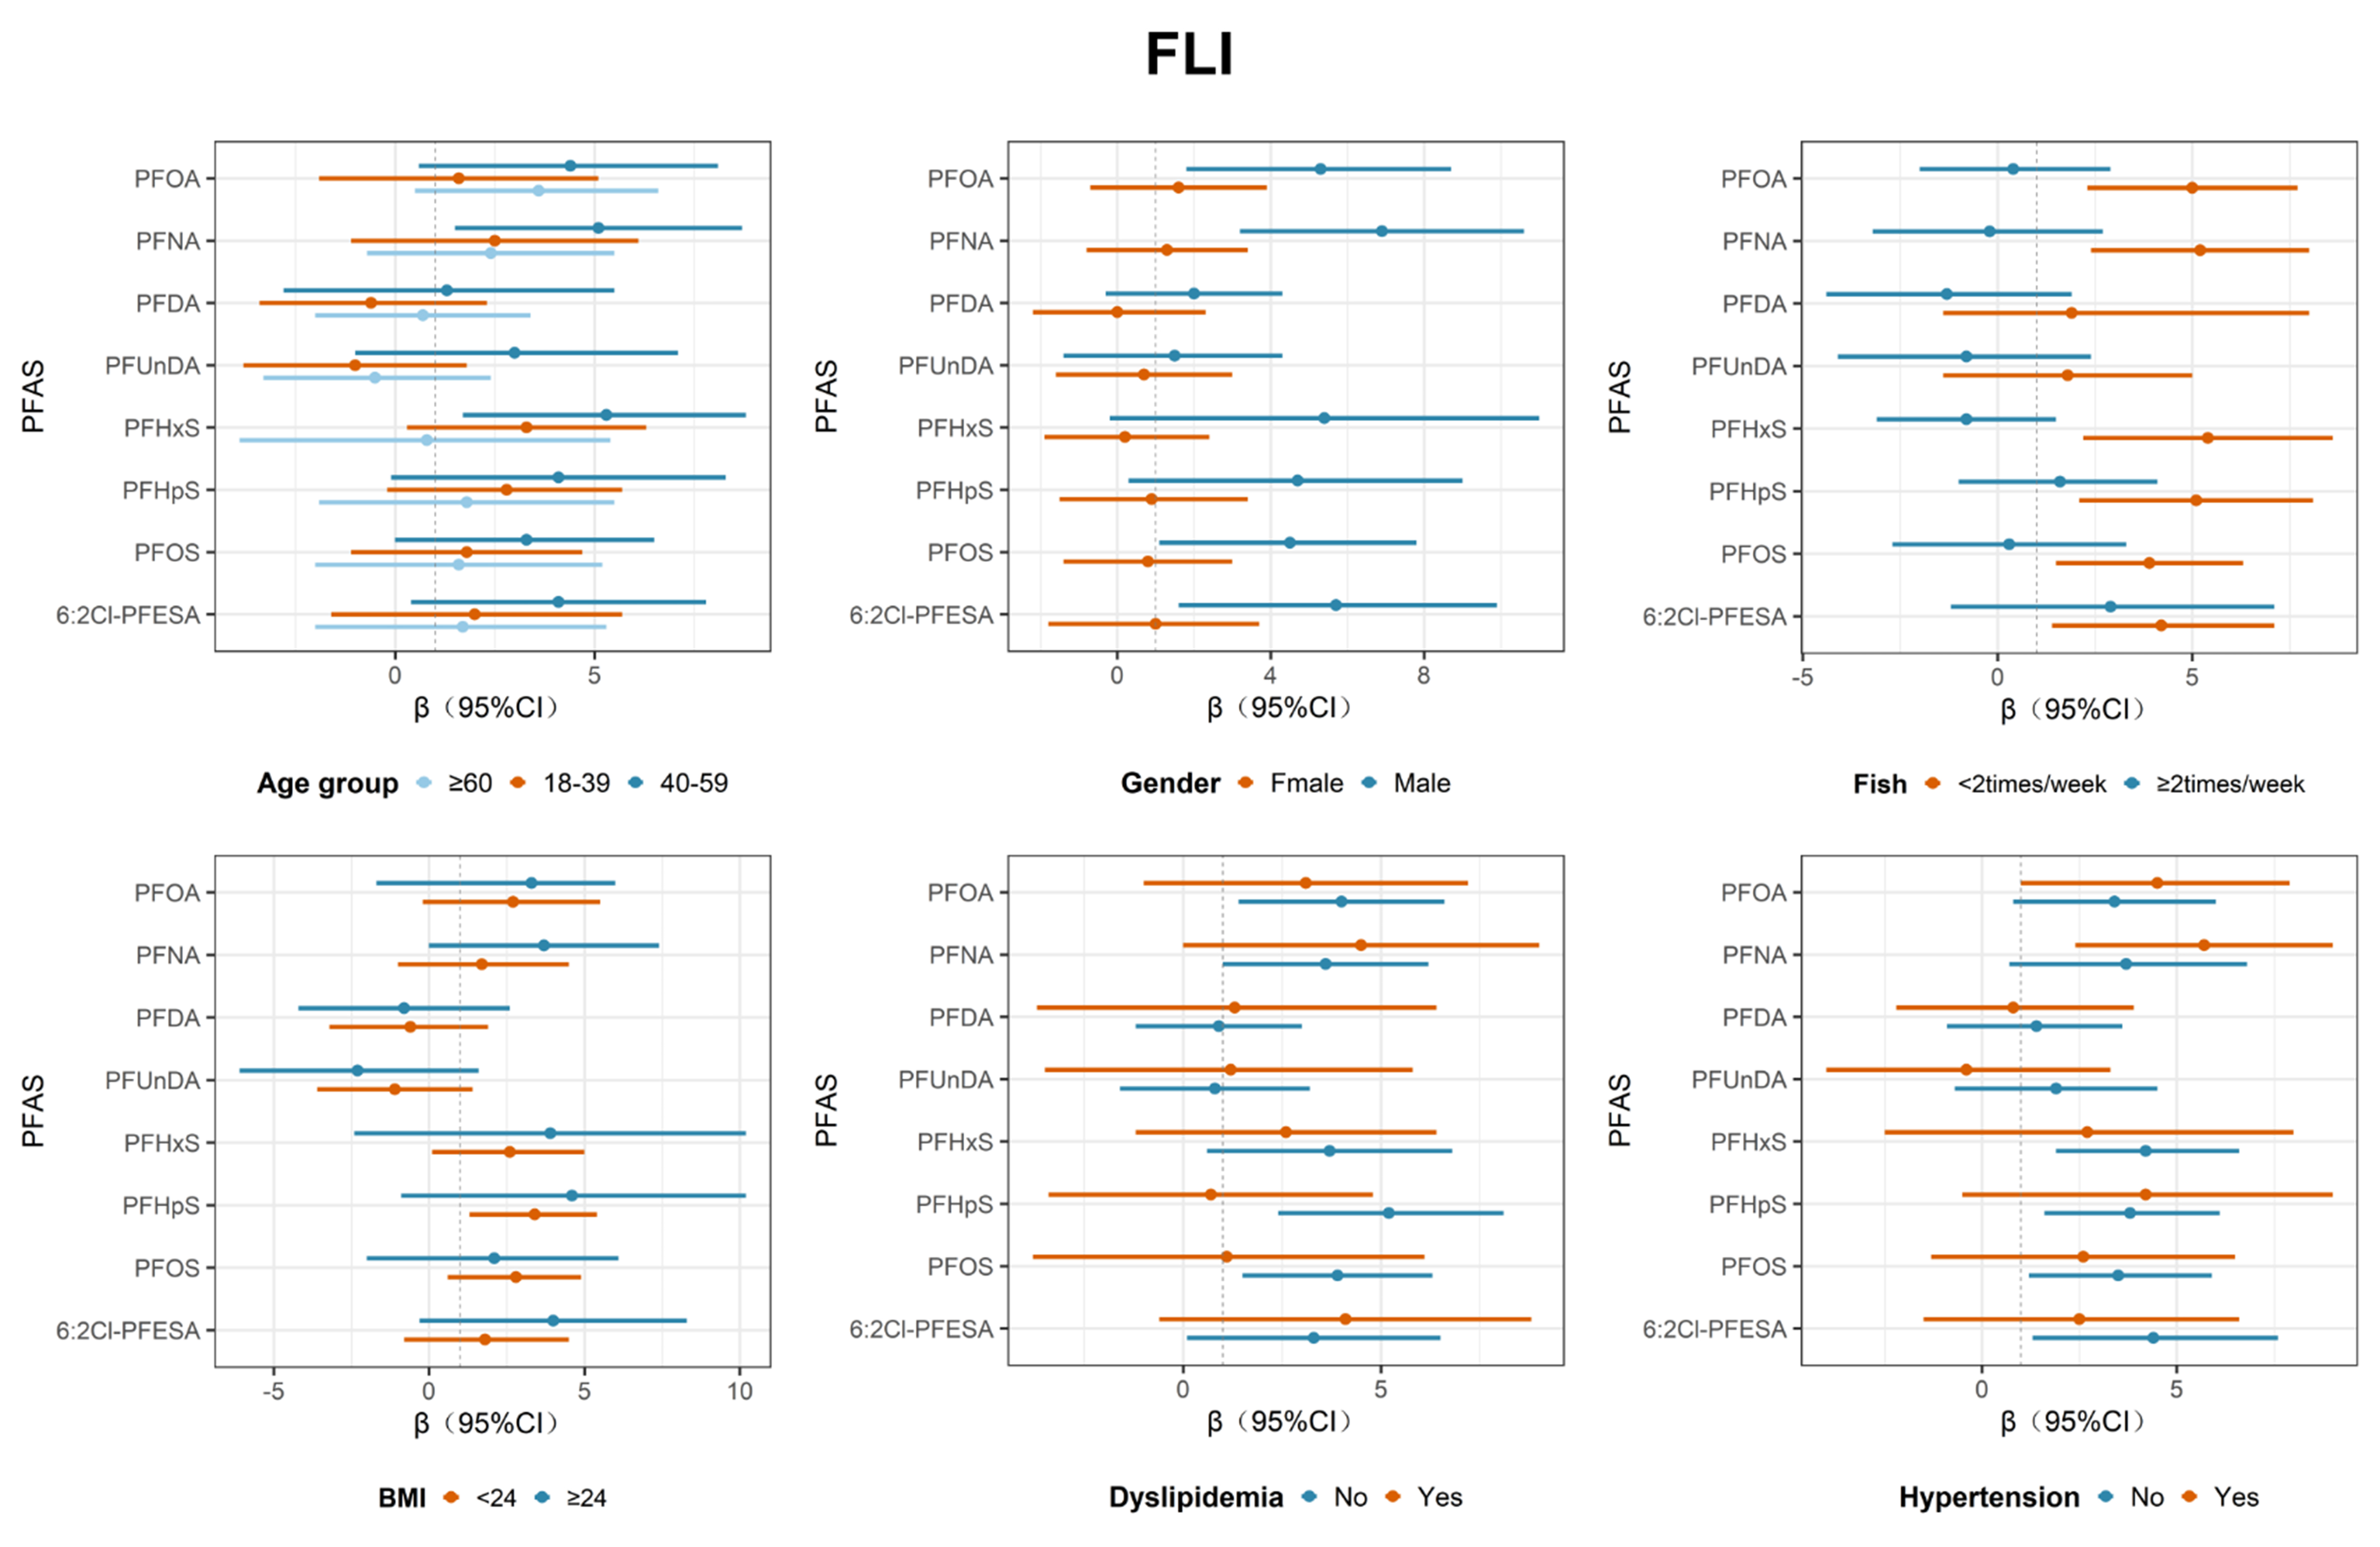
Figure 2. Association between PFAS and FLI in different sexes, age, BMI, frequency of fish consumption, dyslipidemia and hypertension. Adjusted for age, gender, marriage, study site, nationality, education, occupation and household income, smoking, drinking, fish consumption frequency, meat consumption frequency, activity, BMI, CKD, dyslipidemia and hypertension (When grouped by sex, the covariates did not include sex; When grouped by age, the covariates did not include age; When grouped by fish consumption frequency, the covariates did not include fish consumption frequency; When grouped by BMI, the covariates did not include BMI; When grouped by dyslipidemia, the covariates did not include dyslipidemia; When grouped by hypertension, the covariates did not include hypertension). PFAS: Per- and polyfluoroalkyl substances; FLI: fatty liver index; BMI: body mass index; CKD: chronic kidney disease; PFOA: perfluorooctanoic acid; PFNA: perfluorononanoic acid; PFDA: perfluorodecanoic acid; PFUnDA: perfluoroundecanoic acid; PFHxS: perfluorohexane sulfonic acid; PFHpS: perfluoroheptane sulfonic acid; PFOS: perfluorooctane sulfonic acid; 6:2 Cl-PFESA: 6:2 chlorinated polyfluoropolyether sulfonic acid; CI: confidence interval.
Sensitivity analyses confirmed that the results remained robust after excluding participants with PFAS levels above the 99th percentile (P99) or below the limit of detection (LOD) [Supplementary Tables 5 and 6]. While the association between PFNA and FLI slightly weakened after excluding individuals with hypertension or dyslipidemia, the overall findings remained consistent [Supplementary Table 7]. Notably, participants were defined as having NAFLD when the FLI score was ≥ 60. The positive association with PFHxS became non-significant, whereas new significant associations were identified for serum PFOA, PFNA and 6:2 Cl-PFESA with NAFLD [Supplementary Table 8].
Discussion
This national cross-sectional study found that exposure to PFOA, PFNA, PFHxS, PFHpS, PFOS, and 6:2 Cl-PFESA was significantly associated with FLI levels, and exposure to PFHxS was significantly associated with NAFLD. The findings suggested that PFAS may contribute to NAFLD development either as an environmental determinant or as an endocrine and metabolic disruptor, a research topic that has attracted growing attention over the past decade. A positive association was also observed between combined exposure to the 8 PFAS congeners and an increased risk of elevated FLI levels. PFOA accounted for 55.1% of the joint contribution of PFAS to the increase of FLI levels, followed by PFHxS, which accounted for 27.5%. Notably, PFAS appeared to exhibit stronger adverse associations on FLI among male participants or those with lower fish consumption frequency.
This study demonstrated that PFOA, PFNA, PFHxS, PFHpS, PFOS, and 6:2 Cl-PFESA were positively associated with FLI levels, and that PFHxS was linked to an increased risk of NAFLD. Previous studies partially support these findings. Positive associations between PFAS exposure and NAFLD risk were identified in three separate studies conducted in the United States, which enrolled 74 children, 6,990 NHANES participants, and 1,420 elderly individuals aged over 60 years, respectively[23,35,36]. A study of 2,191 Chinese adults found that PFOS was positively associated with NAFLD risk[37]. However, several studies reported inconsistent results. A study of 1,135 adults from the NHANES program found no significant association between PFAS and NAFLD risk[38]. Additionally, a study of 10,234 adults aged over 20 from the NHANES (2003-2018) showed a notable inverse association between PFHxS and FLI, while no significant association was observed between PFAS and NAFLD-FLI during 2003-2010[39]. These inconsistencies may be attributed to differences in study participants, NAFLD diagnostic criteria (hepatic steatosis index/FLI), confounders, or clinical verification.
Subgroup analyses suggested that gender differences may exist in the association between PFAS and FLI. Exposure to PFOA, PFNA, PFHpS, PFOS, and 6:2 Cl-PFESA was associated with an increased risk of NAFLD mainly among male participants, which differed from previous findings. A study based on NHANES showed that among 13,921 participants, PFAS were inversely associated with NAFLD in females, while no significant association was observed in males[40]. Positive associations between PFAS and NAFLD in females were found in a U.S. study of 3,464 adults and a South Korean study of 2,635 adults, respectively[41,42]. Such inconsistencies may be attributed to differences in study participants and sample sizes. The prevalence of NAFLD in females may be influenced by estrogen[43]. In addition, females generally exhibit higher peripheral fat deposition, whereas males are more prone to visceral fat accumulation, which strongly promotes hepatic steatosis progression[44]. Therefore, the prevalence of NAFLD in males is higher than that in females. This study also found that exposure to PFOA, PFNA, PFHxS, PFHpS, PFOS, and 6:2 Cl-PFESA was associated with elevated FLI levels among participants with a fish consumption frequency of less than 2 times per week, which was consistent with previous studies. A cross-sectional study involving 375 Israeli adults demonstrated that high intake of fish rich in omega-3 may reduce the risk of NAFLD[45]. In 2022, a cohort study involving 43,655 adults aged 40-69 in South Korea found that all fatty acids in oily fish were negatively associated with NAFLD[46]. Several mechanisms have been proposed to explain why lower fish consumption was associated with higher FLI levels. First, omega-3 fatty acids abundant in fish enhance hepatic fatty acid oxidation and reduce TG by stimulating the expression of carbohydrate responsive element binding protein (ChREBP), a nuclear transcription factor in hepatic lipogenesis[47]. Second, omega-3 fatty acids activate PPARα, thereby increasing the β-oxidation of fatty acids in mitochondria and peroxisomes, which helps reduce hepatic TG accumulation[48]. Third, omega-3 fatty acids regulate inflammatory responses by generating anti-inflammatory mediators such as resolvins and protectins, thereby improving liver histology[49].
Furthermore, this study revealed a positive association between PFAS mixture and FLI levels, in which PFOA and PFHxS contributed the most. However, no statistically significant was observed between PFAS mixture and NAFLD. Several potential explanations for this finding are proposed as follows. First, as a continuous indicator for assessing hepatic steatosis, FLI shows higher sensitivity in detecting subtle liver pathological changes than NAFLD, a dichotomous variable. Second, exposure levels differ among individual PFAS congeners, and counteractive effects may exist among them; in addition, statistical models have limited ability to capture non‑linear or threshold effects[50]. Finally, the WQS model is based on the assumption that all mixture components act on the outcome in the same direction, and such directional homogeneity may have affected the results[34]. Findings from previous studies are consistent with those of the present study. Positive associations between mixed PFAS exposure and NAFLD were identified in a South Korean cross-sectional study of 2,792 adults and a Chinese study of 1,428 participants, respectively[25,51]. A positive association between mixed PFAS exposure and NAFLD was also reported in a South Korean study of 2,014 adolescents conducted in 2025[52]. However, several previous studies found no statistically significant association between PFAS and NAFLD[53]. Several possible explanations are proposed for the stronger influence of PFOA and PFHxS on FLI levels compared with other PFAS. Firstly, PFOA exerts a predominant effect on the liver, and in vivo studies have demonstrated that PFOA exposure promotes lipid accumulation in the liver[18,54]. In human HepaRG hepatocytes, exposure to PFOA also induces TG accumulation and downregulates genes related to cholesterol biosynthesis, suggesting that PFOA accumulates in the liver more rapidly and causes more pronounced effects. Second, PFOA is an important molecular target of the nuclear receptor PPARα[55], and induces the expression of numerous PPARα-responsive genes. Long-term activation of PPARα may increase hepatic TG levels and exert a greater impact on hepatic lipid metabolism[56]. Additionally, animal studies have shown that PFHxS induces histological changes including vacuolation and oxidative stress in zebrafish hepatocytes, leading to hepatic fat infiltration[57]. PFOA and PFHxS may exert stronger effects on NAFLD, but further studies are required to clarify the underlying mechanisms.
Several studies have suggested clarifying the positive association between PFAS and FLI levels, with relevant mechanisms supported by existing evidence. First, mouse studies have indicated that PFAS exposure can increase cellular steatosis by regulating the expression of fatty acid/lipid metabolism-related genes in HepaRG and HCC cells. Treatment with PFOA and heptafluorobutyric acid (HFBA) increased the expression of SREBP1, ACC, and FASN by 2.4- to 3.6-folds, respectively[58]. Second, chronic PFOA exposure modulates the expression of gene pathways involved in NAFLD progression, including TNF, PI3K/AKT, Foxo, p53, as well as pathways related to insulin signaling and insulin resistance[59]. Finally, PFAS exposure increased oxidative stress, induces caspase-3-mediated apoptosis in hepatocytes, and alters the activities of PPAR-α, PPAR-γ, and hepatocyte nuclear factor 4-α. These effects further disrupt the balance of lipid and amino acid metabolism, ultimately leading to hepatic damage[21].
NAFLD has been recognized as a liver condition related to metabolic stress, insulin resistance, and genetic predisposition, and has become a major public health issue affecting the health of the Chinese participants[1,2]. The results of the present study indicate that PFAS were positively associated with elevated FLI levels, and that PFHxS was positively associated with an increased risk of NAFLD. PFOA and PFHxS contributed the most to the effect of PFAS mixture exposure on FLI levels. In recent years, environmental pollution of PFAS in China has been increasing and therefore, worsening environmental PFAS contamination. Given the worsening environmental PFAS contamination in China, persistent PFAS pollution has become a pressing public health concern. In addition to well-recognized inherited and lifestyle factors, this study identified PFAS as a novel environmental risk factor for NAFLD. Determination of the risk inflection point, exposure threshold, and reference value for PFAS would be of great scientific significance for identifying the health hazards of PFAS. Appropriate management of PFAS‑related NAFLD through health risk assessment, prediction, and early warning, together with the formulation of relevant public health policies, regulations, and standards, would support the implementation of effective health intervention measures.
Strengths and limitations
This study has several strengths. First, it is the first national study to explore the association between PFAS and NAFLD among the general Chinese participants. In addition, this study examined the associations of various traditional and emerging PFAS (6:2 Cl-PFESA) with FLI and NAFLD, providing comprehensive evidence from the Chinese participants. Second, the CNHBM data adopted a rigorous sampling method to ensure its representativeness of the Chinese participants, resulting in a large sample size and the collection of detailed information on confounding factors. Finally, this study also included covariates associated with PFAS exposure or absorption, such as the frequency of marine fish and meat consumption. Adjustment of these covariates facilitated the identification of the true association between PFAS and liver function, a factor that has rarely been fully considered in previous studies.
Despite these strengths, several limitations should be acknowledged. First, this study employed a cross-sectional design, which only allowed the identification of associations between PFAS exposure and FLI/NAFLD. The temporal relationship for causality could not be established, and reverse causality could not be fully excluded. The metabolism and PFAS clearance in humans are highly dependent on normal hepatic physiological function[60]. Furthermore, hepatocellular steatosis, inflammation, and liver dysfunction induced by NAFLD may substantially reduce hepatic clearance of PFAS, resulting in the accumulation of PFAS and elevated circulating PFAS concentrations[61]. Second, although we adjusted for major known confounders, residual confounding from unmeasured genetic factors and other unobserved covariates cannot be ruled out; thus, our findings should be interpreted with caution. Third, PFAS concentrations were assessed using a single blood measurement, which did not capture long-term exposure levels or temporal variations. This limitation may introduce exposure misclassification bias in the evaluation of actual PFAS exposure. Fourth, NAFLD was defined using an FLI cutoff of ≥ 30, which yielded a higher prevalence estimate than those reported in other general Chinese participants. Although this cutoff shows high sensitivity and helps minimize false-negative cases with FLI values of 30-59, it may generate a small number of false positives that could be distinguished in subsequent clinical assessments. In addition, compared with imaging modalities (e.g., abdominal ultrasound/MRI) or liver biopsy, defining NAFLD based on FLI may be prone to diagnostic misclassification. Therefore, future longitudinal studies are warranted to clarify causal relationships, and validation using gold-standard diagnostic methods such as liver biopsy is needed to improve the robustness of the findings.
CONCLUSION
This study revealed that serum PFAS exposure was positively associated with elevated FLI levels among Chinese adults. Serum PFHxS concentration was also independently linked to a higher risk of NAFLD. In addition, such positive associations were more evident in males and in participants with fish consumption frequency fewer than 2 times per week. Moreover, combined exposure to multiple PFAS congeners was positively correlated with FLI levels, with PFOA being the leading contributor. This study identifies PFAS as an emerging environmental risk factor for NAFLD, providing population-based evidence supporting the potential link between PFAS exposure and NAFLD development. Therefore, targeted prevention and control measures for PFAS pollution should be strengthened. The findings also provide an important scientific basis for establishing PFAS pollution prevention and control policies in China and other developing countries with similar environmental backgrounds.
DECLARATIONS
Acknowledgments
We thank all the participants and researchers involved in the CNHBM, which laid the foundation for the smooth implementation of the project.
Authors’ contributions
Writing - original draft, investigation, methodology: Hu, X.
Writing - review and editing, resources, investigation: Sheng, N.
Writing - review and editing, investigation, methodology: Chen, Y.
Writing - review and editing, formal analysis: Shi, W.; Ji, S.; Wu, B.
Project administration, formal analysis: Qu, Y.; Li, Z.
Investigation, methodology: Yu, L.; Meng, X.; Wu, C.; Zhang, Z.; Xue, Z.; Long, F.; Wei, L.; Yin, Z.; Chu, H.
Writing - review and editing, supervision, validation: Tong, S.; Wang, H.
Funding acquisitiont: Dai, J.
Writing - review and editing, visualization: Wang, L.
Writing - review and editing, supervision, validation, project administration: Lv, Y.; Pan, Y.; Shi, X.
Availability of data and materials
The data of this study were obtained from the CNHBM and were confidential, with no public disclosure permitted.
AI and AI-assisted tools statement
Not applicable.
Financial support and sponsorship
This study was supported by the National Natural Science Foundation of China (82304222, 82388102, 82230111, U22A20404, 22322607), noncommunicable Chronic Diseases-National Science and Technology Major Project (2023ZD0519200), and the National Key R&D Program of China (2022YFA0806600).
Conflicts of interest
All authors declared that there are no conflicts of interest.
Ethical approval and consent to participate
This study received ethical approval from Ethics Committee of the National Institute of Environmental Health at the Chinese Center for Disease Control and Prevention (the ethics approval number: 201701). Written informed consent was obtained from all participants.
Consent for publication
Not applicable.
Copyright
© The Author(s) 2026.
Supplementary Materials
REFERENCES
1. Arshad, T.; Golabi, P.; Paik, J.; Mishra, A.; Younossi, Z. M. Prevalence of nonalcoholic fatty liver disease in the female population. Hepatol. Commun. 2019, 3, 74-83.
2. Younossi, Z.; Anstee, Q. M.; Marietti, M.; et al. Global burden of NAFLD and NASH: trends, predictions, risk factors and prevention. Nat. Rev. Gastroenterol. Hepatol. 2018, 15, 11-20.
3. Powell, E. E.; Wong, V. W.; Rinella, M. Non-alcoholic fatty liver disease. Lancet 2021, 397, 2212-24.
4. Musso, G.; Saba, F.; Cassader, M.; Gambino, R. Lipidomics in pathogenesis, progression and treatment of nonalcoholic steatohepatitis (NASH): recent advances. Prog. Lipid. Res. 2023, 91, 101238.
5. Walker, R. W.; Belbin, G. M.; Sorokin, E. P.; et al. A common variant in PNPLA3 is associated with age at diagnosis of NAFLD in patients from a multi-ethnic biobank. J. Hepatol. 2020, 72, 1070-81.
6. Hassani Zadeh, S.; Mansoori, A.; Hosseinzadeh, M. Relationship between dietary patterns and non-alcoholic fatty liver disease: a systematic review and meta-analysis. J. Gastroenterol. Hepatol. 2021, 36, 1470-8.
7. Dolce, A.; Della, Torre. S. Sex, nutrition, and NAFLD: relevance of environmental pollution. Nutrients 2023, 15, 2335.
8. Midya, V.; Colicino, E.; Conti, D. V.; et al. Association of prenatal exposure to endocrine-disrupting chemicals with liver injury in children. JAMA. Netw. Open. 2022, 5, e2220176.
9. Sha, B.; Schymanski, E. L.; Ruttkies, C.; Cousins, I. T.; Wang, Z. Exploring open cheminformatics approaches for categorizing per- and polyfluoroalkyl substances (PFASs). Environ. Sci. Process. Impacts. 2019, 21, 1835-51.
10. Langberg, H. A.; Breedveld, G. D.; Kallenborn, R.; et al. Human exposure to per- and polyfluoroalkyl substances (PFAS) via the consumption of fish leads to exceedance of safety thresholds. Environ. Int. 2024, 190, 108844.
11. He, Y.; Lv, D.; Li, C.; Liu, X.; Liu, W.; Han, W. Human exposure to F-53B in China and the evaluation of its potential toxicity: an overview. Environ. Int. 2022, 161, 107108.
12. Wu, B.; Pan, Y.; Li, Z.; et al. Serum per- and polyfluoroalkyl substances and abnormal lipid metabolism: a nationally representative cross-sectional study. Environ. Int. 2023, 172, 107779.
13. Mamsen, L. S.; Björvang, R. D.; Mucs, D.; et al. Concentrations of perfluoroalkyl substances (PFASs) in human embryonic and fetal organs from first, second, and third trimester pregnancies. Environ. Int. 2019, 124, 482-92.
14. Evich, M. G.; Davis, M. J. B.; McCord, J. P.; et al. Per- and polyfluoroalkyl substances in the environment. Science 2022, 375, eabg9065.
15. Domingo, J. L. A review of the occurrence and distribution of per- and polyfluoroalkyl substances (PFAS) in human organs and fetal tissues. Environ. Res. 2025, 272, 121181.
16. Wahlang, B.; Jin, J.; Beier, J. I.; et al. Mechanisms of environmental contributions to fatty liver disease. Curr. Environ. Health. Rep. 2019, 6, 80-94.
17. Foulds, C. E.; Treviño, L. S.; York, B.; Walker, C. L. Endocrine-disrupting chemicals and fatty liver disease. Nat. Rev. Endocrinol. 2017, 13, 445-57.
18. Das, K. P.; Wood, C. R.; Lin, M. T.; et al. Perfluoroalkyl acids-induced liver steatosis: effects on genes controlling lipid homeostasis. Toxicology 2017, 378, 37-52.
19. Borghese, M. M.; Liang, C. L.; Owen, J.; Fisher, M. Individual and mixture associations of perfluoroalkyl substances on liver function biomarkers in the Canadian Health Measures Survey. Environ. Health. 2022, 21, 85.
20. Mora, A. M.; Fleisch, A. F.; Rifas-Shiman, S. L.; et al. Early life exposure to per- and polyfluoroalkyl substances and mid-childhood lipid and alanine aminotransferase levels. Environ. Int. 2018, 111, 1-13.
21. Stratakis, N.; V, Conti. D.; Jin, R.; et al. Prenatal exposure to perfluoroalkyl substances associated with increased susceptibility to liver injury in children. Hepatology 2020, 72, 1758-70.
22. Wu, Z.; Ouyang, T.; Liu, H.; Cao, L.; Chen, W. Perfluoroalkyl substance (PFAS) exposure and risk of nonalcoholic fatty liver disease in the elderly: results from NHANES 2003-2014. Environ. Sci. Pollut. Res. Int. 2023, 30, 64342-51.
23. Jin, R.; McConnell, R.; Catherine, C.; et al. Perfluoroalkyl substances and severity of nonalcoholic fatty liver in Children: an untargeted metabolomics approach. Environ. Int. 2020, 134, 105220.
24. Cao, Z.; Lin, S.; Zhao, F.; et al. Cohort profile: China National Human Biomonitoring (CNHBM) - a nationally representative, prospective cohort in Chinese population. Environ. Int. 2021, 146, 106252.
25. Wu, Y.; Cheng, Z.; Zhang, W.; et al. Association between per- and poly-fluoroalkyl substances and nonalcoholic fatty liver disease: a nested case-control study in Northwest China. Environ. Pollut. 2024, 350, 123937.
26. Fan, J. G.; Xu, X. Y.; Yang, R. X.; et al.; Chinese Society of Hepatology, Chinese Medical Association. Guideline for the prevention and treatment of metabolic dysfunction-associated fatty liver disease (Version 2024). J. Clin. Transl. Hepatol. 2024, 12, 955-74.
27. Qu, Y.; Lv, Y.; Ji, S.; et al. Effect of exposures to mixtures of lead and various metals on hypertension, pre-hypertension, and blood pressure: a cross-sectional study from the China National Human Biomonitoring. Environ. Pollut. 2022, 299, 118864.
28. Wang, J.; Pan, Y.; Wei, X.; Dai, J. Temporal trends in prenatal exposure (1998-2018) to emerging and legacy per- and polyfluoroalkyl substances (PFASs) in cord plasma from the Beijing Cord Blood Bank, China. Environ. Sci. Technol. 2020, 54, 12850-9.
29. Lin, Q.; Wang, J.; Li, J. J.; et al. [Determination of 17 perfluorinated/polyfluoroalkyl compounds in serum by high-throughput solid-phase extraction-ultra-high performance liquid chromatography-tandem mass spectrometry]. Se. Pu. 2025, 43, 252-60.
30. Nomura, T.; Ono, M.; Kobayashi, K.; et al. Validation of fatty liver index as a predictor of hepatic steatosis in Asian populations: impact of alcohol consumption and sex. Hepatol. Res. 2023, 53, 968-77.
31. Li, B.; Liu, Y.; Ma, X.; Guo, X. The association between non-high-density lipoprotein cholesterol to high-density lipoprotein cholesterol ratio and hepatic steatosis and liver fibrosis among US adults based on NHANES. Sci. Rep. 2025, 15, 6527.
32. de Silva, M. H. A. D.; Hewawasam, R. P.; Kulatunge, C. R.; Chamika, R. M. A. The accuracy of fatty liver index for the screening of overweight and obese children for non-alcoholic fatty liver disease in resource limited settings. BMC. Pediatr. 2022, 22, 511.
33. Feeney, T.; Hartwig, F. P.; Davies, N. M. How to use directed acyclic graphs: guide for clinical researchers. BMJ 2025, 388, e078226.
34. Chen, Y.; Cheng, Q.; Yang, C.; et al. From association to mechanism: prenatal PFAS co-exposures induces fetal neural tube defects via autophagy-mediated ferroptosis. J. Hazard. Mater. 2026, 502, 140979.
35. Qiao, W.; Li, J.; Luo, L.; et al. Triglycerides mediate the relationships of per- and poly-fluoroalkyl substance (PFAS) exposure with nonalcoholic fatty liver disease (NAFLD) risk in US participants. Ecotoxicol. Environ. Saf. 2025, 289, 117436.
36. David, N.; Antignac, J. P.; Roux, M.; et al. Associations between perfluoroalkyl substances and the severity of non-alcoholic fatty liver disease. Environ. Int. 2023, 180, 108235.
37. Xue, R.; Nie, X.; Ballah, J.; et al. Systemic chronic inflammation mediates the effect of per- and polyfluoroalkyl substances exposure on the risk of nonalcoholic fatty liver disease: a cross-sectional study among Chinese government employees. Environ. Epidemiol. 2025, 9, e411.
38. Zhang, X.; Zhao, L.; Ducatman, A.; et al. Association of per- and polyfluoroalkyl substance exposure with fatty liver disease risk in US adults. JHEP. Rep. 2023, 5, 100694.
39. Momo, H. D.; Alvarez, C. S.; Purdue, M. P.; Graubard, B. I.; McGlynn, K. A. Associations of per- and polyfluoroalkyl substances and nonalcoholic fatty liver disease in the United States adult population, 2003-2018. Environ. Epidemiol. 2024, 8, e284.
40. Wu, M.; Zhu, Z.; Wan, R.; Xu, J. Exposure to per- and polyfluoroalkyl substance and metabolic syndrome: a nationally representative cross-sectional study from NHANES, 2003-2018. Environ. Pollut. 2024, 346, 123615.
41. Hwang, S. H.; Choi, Y. H.; Huh, D. A.; et al. Per- and polyfluoroalkyl substances exposures are associated with non-alcoholic fatty liver disease, particularly fibrosis. Environ. Pollut. 2025, 372, 126085.
42. E, L.; Zhang, S.; Jiang, X. Association between perfluoroalkyl substances exposure and the prevalence of nonalcoholic fatty liver disease in the different sexes: a study from the National Health and Nutrition Examination Survey 2005-2018. Environ. Sci. Pollut. Res. Int. 2023, 30, 44292-303.
43. Morán-Costoya, A.; Proenza, A. M.; Gianotti, M.; Lladó, I.; Valle, A. Sex differences in nonalcoholic fatty liver disease: estrogen influence on the liver-adipose tissue crosstalk. Antioxid. Redox. Signal. 2021, 35, 753-74.
44. Chen, H.; Liu, Y.; Liu, D.; et al. Sex- and age-specific associations between abdominal fat and non-alcoholic fatty liver disease: a prospective cohort study. J. Mol. Cell. Biol. 2024, 15, mjad069.
45. Spooner, M. H.; Jump, D. B. Nonalcoholic fatty liver disease and omega-3 fatty acids: mechanisms and clinical use. Annu. Rev. Nutr. 2023, 43, 199-223.
46. Tan, L. J.; Shin, S. Effects of oily fish and its fatty acid intake on non-alcoholic fatty liver disease development among South Korean adults. Front. Nutr. 2022, 9, 876909.
47. Scorletti, E.; Byrne, C. D. Omega-3 fatty acids and non-alcoholic fatty liver disease: evidence of efficacy and mechanism of action. Mol. Aspects. Med. 2018, 64, 135-46.
48. Tatoli, R.; Caterina, B.; Donghia, R.; Pesole, P. L.; Fontana, L.; Giannelli, G. Dietary omega-3 fatty acids from fish and risk of metabolic dysfunction-associated steatotic liver disease in a Mediterranean population: findings from the NUTRIHEP cohort. Nutrients 2025, 17, 3372.
49. Recaredo, G.; Marin-Alejandre, B. A.; Cantero, I.; et al. Association between different animal protein sources and liver status in obese subjects with non-alcoholic fatty liver disease: fatty liver in obesity (FLiO) study. Nutrients 2019, 11, 2359.
50. He, X.; Wu, R.; Jiang, W.; Tian, Y.; Zhang, J.; Huang, Y.; Shanghai Birth Cohort. Prenatal exposure to per- and polyfluoroalkyl substances and childhood executive function and behavioral difficulties at age 7: evidence from the Shanghai birth cohort study. Environ. Int. 2025, 202, 109687.
51. Yun, J.; Min, Y. S. Association between perfluoroalkyl substance (PFAS) exposure and nonalcoholic fatty liver disease in Korean adults: results from the KoNEHS 2018-2020: a cross-sectional study. Am. J. Ind. Med. 2025, 68, 588-97.
52. Du, X.; Li, D. L.; Xu, X.; et al. Effects of mixed exposure to PFAS on adolescent non-alcoholic fatty liver disease: Integrating evidence from human cohorts, toxicogenomics, and animal models to uncover mechanisms and potential target sites. J. Hazard. Mater. 2025, 485, 136854.
53. Cheng, W.; Li, M.; Zhang, L.; et al. Close association of PFASs exposure with hepatic fibrosis than steatosis: evidences from NHANES 2017-2018. Ann. Med. 2023, 55, 2216943.
54. Li, X.; Wang, Z.; Klaunig, J. E. The effects of perfluorooctanoate on high fat diet induced non-alcoholic fatty liver disease in mice. Toxicology 2019, 416, 1-14.
56. Pan, Z.; Miao, W.; Wang, C.; Tu, W.; Jin, C.; Jin, Y. 6:2 Cl-PFESA has the potential to cause liver damage and induce lipid metabolism disorders in female mice through the action of PPAR-γ. Environ. Pollut. 2021, 287, 117329.
57. Huang, J.; Liu, Y.; Wang, Q.; et al. Concentration-dependent toxicokinetics of novel PFOS alternatives and their chronic combined toxicity in adult zebrafish. Sci. Total. Environ. 2022, 839, 156388.
58. Qi, Q.; Niture, S.; Gadi, S.; et al. Per- and polyfluoroalkyl substances activate UPR pathway, induce steatosis and fibrosis in liver cells. Environ. Toxicol. 2023, 38, 225-42.
59. Weng, Z.; Xu, C.; Zhang, X.; et al. Autophagy mediates perfluorooctanoic acid-induced lipid metabolism disorder and NLRP3 inflammasome activation in hepatocytes. Environ. Pollut. 2020, 267, 115655.
60. Sen, P.; Qadri, S.; Luukkonen, P. K.; et al. Exposure to environmental contaminants is associated with altered hepatic lipid metabolism in non-alcoholic fatty liver disease. J. Hepatol. 2022, 76, 283-93.
Cite This Article
How to Cite
Download Citation
Export Citation File:
Type of Import
Tips on Downloading Citation
Citation Manager File Format
Type of Import
Direct Import: When the Direct Import option is selected (the default state), a dialogue box will give you the option to Save or Open the downloaded citation data. Choosing Open will either launch your citation manager or give you a choice of applications with which to use the metadata. The Save option saves the file locally for later use.
Indirect Import: When the Indirect Import option is selected, the metadata is displayed and may be copied and pasted as needed.
About This Article
Copyright

Data & Comments
Data
0


Comments
Comments must be written in English. Spam, offensive content, impersonation, and private information will not be permitted. If any comment is reported and identified as inappropriate content by OAE staff, the comment will be removed without notice. If you have any queries or need any help, please contact us at [email protected].