

Accurate verification of nicotine and tobacco product use or abstinence using a multi-biomarker approach
 0
0 Abstract
Cigarette smokers are exposed to over 7,000 chemicals, including many toxic and carcinogenic agents. Alternative non-combustible nicotine products considerably reduce exposure to harmful constituents. Extensive research on biomarkers of potential harm is crucial for assessing the early health impacts of smoking and the reduction of harm after quitting or switching to alternative products. However, such clinical trials are constrained by poor verification of self-reported product use, as common procedures using exhaled carbon monoxide (eCO) and cotinine strip tests are limited by short detection periods and non-specificity, respectively. Therefore, product-use-specific biomarkers of exposure (BoEs) are needed for accurate biochemical verification in studies evaluating the health impact of new products, such as electronic cigarettes. We conducted a cross-sectional study in 180 participants, including current, former, and never-smokers, and applied several BoEs to verify their use behavior. Our multi-biomarker approach monitored exposure to nicotine, tobacco-specific nitrosamines, acrylonitrile and propylene glycol (PG), which were significantly elevated in the current smoker group except PG, identifying six non-compliant subjects (4 current, 1 former and 1 never-smoker). The proposed biomarker panel outperformed eCO and was able to distinguish distinct use patterns, such as vaping vs. smoking, thereby enhancing data accuracy. Moreover, biochemically determined exposure variables such as carboxyhemoglobin and cotinine showed stronger correlations with BoEs than self-reported cigarette consumption. Therefore, the suggested panel is particularly valuable for non-controlled studies, where reliance on self-report can bias outcomes. Implementing the proposed verification strategy can improve study validity and strengthen evidence on the health impacts of switching to alternative products.
Keywords
INTRODUCTION
Cigarette smoking is a risk factor of numerous human disorders and a leading cause of many diseases, including cardiovascular disorders, multiple cancers and chronic obstructive pulmonary disease (COPD). It is also the leading cause of preventable death. According to the World Health Organization (WHO), use of tobacco results in death of about half of the users who do not quit. More than 8 million people die each year due to tobacco use including 1.3 million non-smokers exposed to second-hand smoke[1]. New nicotine-containing products, such as electronic cigarettes (ECs) and tobacco-free nicotine pouches (NPs), expose consumers to lower levels of harmful and potentially harmful constituents (HPHCs), which are the primary causes of smoking-related diseases[2]. However, to what extent this reduced exposure leads to reduced risk of developing cardiovascular and respiratory diseases is still not fully understood[3,4]. Epidemiological data will provide valuable information in terms of risk from the use of these new products, but it takes decades to provide the needed evidence. Better knowledge of early health indicators by means of sensitive, acute biomarkers of potential harm (BoPHs) would improve our understanding of the health impacts for people who quit smoking by switching to products such as ECs or NPs. In contrast to biomarkers of exposure (BoEs) that reflect exposure to certain substances, chemicals or products, BoPHs are biological indicators that reflect early changes in health status caused by exposure to harmful substances (e.g., tobacco smoking) and are used to evaluate the risk of developing disease before clinical symptoms appear. Promising candidate endpoints should be able to capture early signs of reversal in respiratory injury. High-resolution computed tomography (HRCT) can quantitatively determine changes in lung microstructures. Therefore, HRCT in combination with further cardiorespiratory endpoints and quantitative analysis of BoPHs can potentially serve as early indicators of biological and physiological changes.
We conducted a comprehensive quantitative analysis of advanced lung function metrics including HRCT, spirometry, gas exchange efficiency [diffusing capacity for carbon monoxide (DLCO)], and respiratory mechanics (oscillometry) in combination with a panel of established BoPHs and non-targeted urine and breath analyses in a cross-sectional study in current smokers (CS), former smokers (FS), and never smokers (NS). The results of those assessments will be reported elsewhere. In any form of clinical study assessing tobacco products, robust biochemical verification of smoking status and abstinence can be critical in assessing the product use-related measurements including BoPHs. A cross-sectional design that relies solely on self-reported data is challenging, as inaccurate reporting of tobacco product use status to meet clinical trial criteria is not uncommon. For instance, Benowitz et al. reported that self-reported smoking abstinence was not biochemically verifiable for up to 11% of clinical trial participants[5]. Misclassification of 1 out of 10 participants can lead to significant uncertainty in the trial outcome, especially in tobacco harm reduction trials since the BoPHs are endogenous in nature and generally show lower differences between smokers and non-smokers in contrast to BoEs. Thus, reliable biochemical verification of use behavior is essential for a robust assessment of the key endpoints.
Historically, exhaled carbon monoxide (eCO) and cotinine, the major metabolite of nicotine, have been mostly used for verification of the smoking status. The concentration of carbon monoxide (CO) in exhaled breath (EB) is the most frequently used biomarker to distinguish combustible tobacco product users from non-users due to the availability of non-invasive, rapid and cost-efficient measurement devices[6]. CO is a byproduct of combustion of organic matter such as cigarette smoking. Studies have reported a significant increase in eCO in the breath of smokers and assessed compliance using varying thresholds ranging from 4 to 15 ppm[6]. While eCO monitoring has an immediate readout on-site, it can lead to false positive and negative results due to the very short half-life of 2-8 h and environmental exposures (e.g., automobile exhaust and home barbecue smoke)[7]. Urinary or salivary cotinine is also commonly used for verification by means of rapid tests using cotinine strips. To verify smoking status, a threshold level of 200 or 500 ng/mL is generally used with cotinine strip testing[6]. Cotinine is more advantageous than eCO due to the longer average half-life of about 16 h[5]. However, cotinine is not specific to combustible cigarette (CC) use and it can only distinguish nicotine product users [CC, smokeless tobacco (SLT), heated tobacco product (HTP), EC and nicotine gum/pouch] from non-users.
Recently, the Cooperation Centre for Scientific Research Relative to Tobacco (CORESTA) Biomarker subgroup suggested a decision tree (CORESTA Guide No. 29) using BoEs as a compliance measure to discriminate users of various nicotine and tobacco product categories based on available literature data[8]. The candidate biomarkers were categorized into four groups based on their specificity: namely, biomarkers of nicotine use, tobacco use, combustible product use, and vaping. Priority was given to the BoEs which were found to have the highest specificity and longest detection periods, which is a function of the BoE’s sensitivity (difference in concentration levels between users and non-users) and the half-life. Cotinine, with a half-life of 16 h and on average more than 1,000-fold higher levels in nicotine product users, is well-suited to differentiate nicotine product users from non-users, even if a user is abstinent for around 3-4 days[5,9]. Tobacco-specific nitrosamines (TSNAs) are formed by nitrosation of tobacco alkaloids such as nicotine, nornicotine, anatabine (AT) and anabasine (AB) during tobacco storage, curing and fermentation[10]. Hence, tobacco use can be effectively detected by measuring the TSNA exposure in urine by means of 4-(methylnitrosamino)-1-(3-pyridyl)-1-butanol (NNAL), N-nitrosonornicotine (NNN), N-nitrosoanatabine (NAT), N-nitrosoanabasine (NAB) and the minor tobacco alkaloids AT and AB. NNAL, with a half-life of 10-18 days in urine, enables the detection of tobacco use over a longer period compared to the other TSNAs and minor tobacco alkaloids[11]. Exposure to the combustion product acrylonitrile is highly specific to smoking CCs[12]. Cyanoethylvaline (CEVal), a hemoglobin adduct of acrylonitrile with a 30-day half-life[8], is the biomarker of choice for detecting past smoking up to 3-4 months, while the urinary acrylonitrile metabolite 2-cyanoethyl mercapturic acid (2CyEMA), with a shorter half-life of ~8 h, can detect recent smoking around 30 h only[13]. Moreover, eCO and blood carboxyhemoglobin (COHb) levels are indicative of CC use with the limitations described above. Propylene glycol (PG) with a half-life of around 2-4 h was found to be significantly elevated in vapers compared to other product users and non-user categories[14-16], making PG in urine or plasma a promising candidate to identify EC use. Urinary 3-hydroxypropylmercapturic acid (3HPMA), 2-carbamoylethylmercapturic acid (2CaEMA or AAMA), and 3-hydroxy-1-methylpropylmercapturic acid (3-HMPMA) levels have been suggested as potential biomarkers for stratifying SLT and HTP use. This requires further investigation in larger cohorts and is beyond the scope of the current study. Similarly, stratification of use across novel delivery systems, including snus and oral NPs, requires further investigation to establish product-use-specific biomarker thresholds.
The results presented here are part of an exploratory study investigating differences in various respiratory outcome measures and BoPHs among NS, FS, and CS of CCs. The first step in the assessment is to biochemically verify CC use (or abstinence) for inclusion/exclusion of the subjects. Use status for smoking, EC and other new nicotine or tobacco product use has to be verified by using appropriate thresholds (cutoff values) for the suggested biomarkers. The cutoff values are ideally determined in large cohorts with different product user and non-user groups. The levels of the compliance biomarkers are then subjected to receiver operating characteristic (ROC) analysis to establish a valid threshold or cutoff value that discriminates the study groups with the highest sensitivity and specificity. In this study, we tested the hypothesis that a specific and sensitive biomarker panel should result in accurate biochemical use verification, significantly improving the data quality, compared to the “status quo” which mainly relies on self-report and eCO measurements, especially in longitudinal cessation and switching trials.
EXPERIMENTAL
Clinical trial
This proof-of-concept cross-sectional study included 180 healthy participants from three groups: NS, FS, and CS. The NS group consisted of 59 participants (18 males, 41 females), the FS group 61 participants (26 males, 35 females), and the CS group 60 participants (25 males, 35 females). The median age of the NS, FS and CS groups was 43.2, 52.9 and 46.2 years, respectively. Detailed demographic information of the clinical trial participants is summarized in Table 1 in the results section. All subjects gave their informed consent for inclusion before they participated in the study. The study was conducted in accordance with the Declaration of Helsinki, and the protocol was approved by the Health Research Authority (HRA) and Health and Care Research Wales (HCRW) (IRAS project ID: 322282; 14 March 2023).
The clinical trial comprised three morning visits to the clinical site [Ashford and St Peter’s Hospitals (ASPH) National Health Service (NHS) Foundation Trust, England, UK]. Participants were screened at the first visit (screening visit) to assess eligibility. The screening was followed by a baseline visit (V1), during which eligibility was again confirmed by eCO measurement, followed by cardiorespiratory tests (spirometry, oscillometry, FeNO, angio-OCT, ankle-brachial index, Chester step test, DLCO, saccharin test) and an HRCT scan of the lungs. One week after the baseline visit, participants returned for a follow-up visit (V2) for repeated assessments of eCO, cardiorespiratory tests, and HRCT scans. Whole blood, washed erythrocytes, plasma, urine, EB, and exhaled breath condensate (EBC) were collected at V2. BoEs were analyzed in urine, whole blood, and washed erythrocytes, while BoPHs were analyzed in urine and plasma. For non-targeted analysis, urine, EB, and EBC were selected. A comprehensive description of the study design will be reported in a separate publication.
Participant eligibility criteria
Inclusion criteria
Physically and psychologically healthy males and females aged 35-65 years who met the following criteria were included in the clinical trial.
• NS: Included participants who have never smoked or reported having smoked less than 100 cigarettes in their lifetime and eCO < 7 ppm to exclude significant exposure to passive smoking or to environmental sources of CO[5].
• FS: Included subjects who ceased smoking for at least six months prior to the screening with an eCO level of < 7 ppm[5].
• CS: Includes participants who reported smoking at least 10 CCs per day for at least 15 years with eCO
Exclusion criteria
Participants were excluded from the clinical trial if any of the following criteria were met.
• Recent (< 14 days) history of upper respiratory tract viral infection.
• History of asthma, COPD, bronchiectasis and other medical conditions that may interfere with cardiorespiratory tests.
• History of diagnosed mental illness including panic disorder, major depression, bipolar disorder or psychosis.
• Other known medical conditions that may compromise participants’ safety while participating in the trial, as per the investigators’ opinion.
• Self-reported intention to become pregnant during the study and breastfeeding or pregnant women confirmed via pregnancy test.
• For NS and FS, significant passive exposure to smoking.
• Self-reported EC or HTP use or significant passive exposure.
• Significant occupational or environmental exposure to chemicals or pollution.
Analysis of BoEs
Biospecimens received from all 180 subjects were analyzed at Analytisch-Biologisches Forschungslabor GmbH (ABF GmbH; Planegg, Germany) using validated analytical methods. All methods were validated according to International Council for Harmonization (ICH) M10 and Food and Drug Administration (FDA) bioanalytical method validation guidelines and routinely used in our laboratory[17,18]. Method characteristics and validation performance have been published elsewhere[14,19-23].
Determination of total nicotine equivalents (TNEs; nicotine, cotinine, 3’-trans-hydroxycotinine) in urine was carried out as follows[19]. To a 50 µL sample, deuterated internal standard (IS) mix, 50 µL of acetate buffer and 10 µL of β-glucuronidase enzyme solution were added and incubated at 37.5 °C overnight. Afterwards, 10 µL of 6 M NaOH and 1 mL of ethyl acetate were added. The solution was mixed thoroughly, centrifuged, and 850 µL of the supernatant was evaporated to dryness and reconstituted in 200 µL of acetonitrile. Then, 5 µL extract was injected into a liquid chromatography-tandem mass spectrometry (LC-MS/MS) system.
The TSNAs - namely NNAL, NNN, NAT and NAB - were simultaneously detected in urine using an LC-MS/MS method[20]. In brief, 2 mL of 0.67 M phosphate buffer (pH 7.2), 40 μL β-glucuronidase in phosphate buffer (pH 7.2, 250 units/μL) and the corresponding deuterated IS mix were added to 2 mL urine samples. The mixture was incubated at 37 °C in the dark for 14 h. The hydrolysate was loaded onto a preconditioned TSNA-molecular-imprinted-phase (MIP) cartridge. After washing with ammonium acetate, heptane and hexane, the sample was eluted with 3 mL dichloromethane:toluene (1:1, v/v). The eluate was evaporated to dryness, re-dissolved in 1 mL phosphate buffer and loaded onto a preconditioned cation-exchange cartridge (Oasis MCX). The cartridge was washed with water, HCl, methanol and eluted with 2 mL methanol:25% ammonium hydroxide (9:1, v/v). The extract was dried and reconstituted in 100 μL of 0.1% ammonium acetate in water:0.1% formic acid in acetonitrile (9:1, v/v) and injected into an LC-MS/MS system.
The minor alkaloids, AT and AB, were detected in urine by LC-MS/MS as follows[20]. After adding corresponding IS mix and 900 μL of formic acid to 600 µL urine, solid-phase extraction was performed on an Oasis MCX cartridge. The cartridge was then washed with formic acid, water, methanol and acetonitrile:methanol (6:4, v/v), followed by elution with 1.2 mL of 2% aqueous ammonium hydroxide:59% acetonitrile:39% methanol. The eluate was then evaporated, reconstituted with 100 μL of 10 mM aqueous ammonium acetate:acetonitrile (9:1, v/v), and 10 μL of the extract was injected into an LC-MS/MS system.
For urinary 2CyEMA analysis, 500 µL of the sample was spiked with D3-2CyEMA, and 20 μL of concentrated HCl, 500 µL of ammonium formate buffer, and 10 μL of 50% NaOH were added. After centrifugation, 50 μL of the supernatant was analyzed employing a column-switching LC-MS/MS method[21].
The hemoglobin adduct of acrylonitrile, 2-CEVal, was determined in washed erythrocytes using gas chromatography–tandem mass spectrometry (GC-MS/MS) as described previously[22]. Briefly, globin from washed and lysed erythrocytes of 5 mL ethylenediaminetetraacetic acid (EDTA) blood was precipitated, washed and dried. Next, 100 mg of the dried protein was spiked with globin adducted D3-CEVal IS and processed through a modified Edman degradation protocol employing pentafluorophenyl isothiocyanate. The mixture was extracted twice before evaporation and reconstitution in 50 µL acetonitrile. Finally, 1.5 µL of the extract was injected into a gas chromatography–electron ionization–tandem mass spectrometry (GC-EI-MS/MS) system.
For the analysis of COHb, 0.1 mL of whole blood was diluted with 1.4 mL of water and fortified with 50 µL of the IS solution [13COHb saturated blood diluted with water 1:10 (v/v)] in a headspace vial prior to the addition of 0.2 mL potassium hexacyanoferrate III solution (200 g/L in water). The solution was incubated for 30 min at 50 °C, and subsequently 1 mL of the headspace gas phase was injected onto the gas chromatography–mass spectrometry (GC-MS) system (MPS2 autosampler with CIS4 cooled injection system; Gerstel GmbH, Mülheim an der Ruhr, Germany; 6890N GC coupled to 5975 MS detector; Agilent Technologies GmbH, Waldbronn, Germany). Chromatographic separation was achieved on an RT-Msieve 5A PLOT capillary column (30 m × 0.32 mm, 30 µm; Restek, Bad Homburg, Germany) at 45 °C (isotherm) with 1.9 mL/min carrier gas flow (helium). The retention time was 8.3 min. Mass spectrometric detection was performed after electron impact ionization (EI) in selected ion monitoring (SIM) mode using the mass trace 28 m/z for quantification (29 m/z for the IS). The method was validated according to FDA guidelines[18] with a limit of quantification (LLOQ) of 0.75% COHb.
PG, determined in urine[14], was prepared by spiking 25 µL sample with 1,2-propylene glycol-D6 IS, followed by derivatization with Schotten-Baumann reaction by adding 500 µL of 4 M sodium hydroxide and 100 µL benzoyl chloride. Then, 2 mL n-pentane was added and thoroughly mixed. Afterwards, 500 µL glycine solution in water (10%) was added and thoroughly mixed to quench the excess derivatization agent. After centrifugation, the supernatant was dried, reconstituted in 100 µL acetonitrile and analyzed in an LC-MS/MS system. Creatinine was determined photometrically by means of the Jaffé-method[23].
Data evaluation
Data organization and evaluation were carried out in Microsoft Excel and GraphPad Prism version 10 (GraphPad Software, Boston, Massachusetts, USA). Biomarkers with concentrations below the lower LLOQ were set to LLOQ/2 for further statistical evaluation. The biomarkers determined in urine were normalized to the individual creatinine concentration. Means, standard deviations (SD), medians, interquartile ranges (IQR), and ROC analyses were performed where appropriate. The analytical data was evaluated for Gaussian or normal distribution using D’Agostino & Pearson, Anderson-Darling, Shapiro-Wilk and Kolmogorov-Smirnov test which revealed non-normal distribution of the data. Therefore, non-parametric Mann-Whitney U test was used to investigate statistical significance between the study groups and Spearman rank test was utilized for correlation analysis. Significance level was set to as follows: *P < 0.05, **P < 0.01, ***P < 0.001. Correlation levels were defined as very weak (Spearman r = 0-0.19), weak (r = 0.20-0.39), moderate (r = 0.40-0.59), strong (r = 0.60-0.79) and very strong (r = 0.80-1).
Detection period was calculated based on the ratio of median or geometric mean (GM) concentrations (based on data availability) in product users vs. the cutoff level (fold change) and the half-life according to
Detection period = log2 (fold change) * half-life
Compliance
Smoking status was monitored on-site via eCO measurement using the CO Check device (MD Diagnostics, Kent, UK). Following sample collection from eCO-compliant participants, product use was comprehensively characterized using the BoEs described earlier in “Analysis of Biomarkers of Exposure”. The threshold or cutoff levels for each BoE were guided by available literature data. For biomarkers with multiple cutoff values in the literature, priority was given to studies with the most robust methodology, a larger number of participants, and a similar ethnicity of the study population. To our knowledge, no literature provides a threshold to distinguish EC users from non-users for PG. Therefore, data from previously published research from our lab were used to determine the cutoff level via ROC analysis. Threshold values derived from creatinine-normalized concentrations (mg/g creatinine, µg/g creatinine, ng/g creatinine) were prioritized over urinary concentrations (µg/mL, ng/mL, pg/mL).
RESULTS AND DISCUSSION
The primary objective of this study was to assess whether quantitative analyses of lung microstructure as obtained by HRCT scans permit a discrimination between CS, FS and NS and to verify the repeatability of such measurements. The secondary objective was to perform selected cardiorespiratory assessments including spirometry, oscillometry, FeNO, angio-OCT, ankle-brachial index, Chester step test, questionnaires, DLCO, and the saccharin test and to collect blood, urine, EB, and EBC samples. The collected biospecimens were used to verify compliance through BoE and for non-targeted analyses aimed at identifying novel BoPHs among participants (CS, FS, and NS). This report discusses the results obtained from the measurement of BoE for the verification of the participants’ self-reported classification into one of the three subgroups, CS, FS and NS.
Demographic information
Demographic information of the clinical trial participants is summarized in Table 1. The age and sex distribution in the study population was generally well-balanced, except in the NS group, where the sex ratio was 3:7 (m/f). For simplicity, ethnicity was divided into four categories: Caucasian, Asian, Black African/Caribbean, and mixed race. The Asian category includes participants of East Asian as well as Indian and Pakistani origin. In terms of distribution, the NS group included a higher proportion of participants of Asian ethnicity compared to the other two groups. Body mass index (BMI) was well-distributed across study groups. The CS reported smoking 10-30 combustible cigarettes per day (CPD) for 10-50 years. The FS had quit smoking between 10 months to 41 years ago. Creatinine concentrations did not differ significantly between the groups.
Demographic information of the participants
| Category | Never smoker | Former smoker | Current smoker |
| N | 59 | 61 | 60 |
| Age (years) | |||
| Mean (SD) | 45.6 (8.67) | 51.5 (8.38) | 47.6 (8.18) |
| Median (IQR) | 43.2 (39.1-51.0) | 52.9 (44.9-58.1) | 46.2 (41.0-53.6) |
| Sex (%) | |||
| Male | 30.5 | 42.6 | 41.7 |
| Female | 69.5 | 57.4 | 58.3 |
| Ethnicity (%) | |||
| Caucasian | 42.4 | 88.5 | 70.0 |
| Asian | 49.2 | 8.20 | 20.0 |
| Black African/Caribbean | 8.47 | 1.64 | 1.67 |
| Mixed race | - | 1.64 | 8.33 |
| BMI (kg/m2) | |||
| Mean (SD) | 27.4 (5.70) | 28.3 (5.29) | 27.7 (6.73) |
| Median (IQR) | 27.0 (23.9-30.0) | 27.8 (24.8-30.0) | 26.4 (23.4-30.0) |
| Pack-years | |||
| Mean (SD) | - | 13.1 (9.56) | 20.1 (11.0) |
| Median (IQR) | - | 11.5 (5.1-20.0) | 17.8 (12.3-23.9) |
| Creatinine (μg/mL) | |||
| Mean (SD) | 579 (580) | 531 (495) | 659 (477) |
| Median (IQR) | 367 (211-674) | 310 (218-722) | 547 (313-879) |
BoEs and rationale for their selection
We applied a panel of BoEs to determine use or abstinence of cigarettes and other nicotine and tobacco products, such as ECs, in participants of a cross-sectional study who reported being CS, FS with at least six months of abstinence, or NS. The panel of BoE was suggested by the CORESTA Biomarker subgroup based on the significantly elevated concentrations of the biomarkers in smokers and/or users of other tobacco and nicotine product categories and their specificity in terms of product use[8]. The results of the BoE used for the verification of the product use status are provided in Table 2 for the compliant participants. In case of urine, the data are provided as urinary concentrations (µg/mL, ng/mL, pg/mL) and creatinine-normalized concentrations (mg/g creatinine, µg/g creatinine, ng/g creatinine). Additionally, statistical significance was determined using the non-parametric Mann-Whitney U test, and the differences between NS vs. CS and FS vs. CS are indicated.
Descriptive statistics of the BoEs for compliant participants
| Category | Never smoker | Former smoker | Current smoker |
| N | 58 | 60 | 56 |
| Cotinine (urine)*** | |||
| Mean (SD) ng/mL µg/g crea | < LLOQ < LLOQ | < LLOQ < LLOQ | 2,597 (3,417) 4,795 (3,150) |
| Median (IQR) ng/mL µg/g crea | < LLOQ < LLOQ | < LLOQ < LLOQ | 1,915 (998-3,065) 4,316 (2,123-6,169) |
| TNE (urine)*** | |||
| Mean (SD) ng/mL µg/g crea | < LLOQ < LLOQ | < LLOQ < LLOQ | 7,220 (9,179) 12,634 (7,744) |
| Median (IQR) ng/mL µg/g crea | < LLOQ < LLOQ | < LLOQ < LLOQ | 5,046 (2,798-9,102) 11,925 (7,385-16,025) |
| NNAL (urine)*** | |||
| Mean (SD) pg/mL ng/g crea | 2.32 (3.79) 6.47 (9.75) | 3.61 (7.88) 7.88 (8.57) | 107 (82.3) 207 (143) |
| Median (IQR) pg/mL ng/g crea | < LLOQ < LLOQ | < LLOQ (< LLOQ-3.10) < LLOQ (< LLOQ-9.57) | 98.7 (35.5-144) 188 (78.7-299) |
| NAB (urine)*** | |||
| Mean (SD) pg/mL ng/g crea | < LLOQ < LLOQ | < LLOQ < LLOQ | 7.65 (8.51) 14.3 (14.0) |
| Median (IQR) pg/mL ng/g crea | < LLOQ < LLOQ | < LLOQ < LLOQ | 4.71 (< LLOQ-13.2) 9.19 (< LLOQ-23.3) |
| NNN (urine)*** | |||
| Mean (SD) pg/mL ng/g crea | 1.02 (2.47) 2.39 (4.79) | 1.32 (2.94) 2.59 (3.53) | 4.89 (5.21) 10.8 (12.8) |
| Median (IQR) pg/mL ng/g crea | < LLOQ (< LLOQ-0.63) < LLOQ (< LLOQ-2.02) | < LLOQ (< LLOQ-0.91) < LLOQ (< LLOQ-2.31) | 3.51 (1.43-6.66) 6.10 (3.08-14.9) |
| NAT (urine)*** | |||
| Mean (SD) pg/mL ng/g crea | 2.39 (4.75) 6.96 (13.3) | 3.44 (6.89) 8.43 (14.3) | 58.3 (53.4) 116 (93.1) |
| Median (IQR) pg/mL ng/g crea | < LLOQ < LLOQ | < LLOQ < LLOQ | 41.8 (21.0-78.8) 110 (38.0-173) |
| AT (urine)*** | |||
| Mean (SD) ng/mL µg/g crea | < LLOQ < LLOQ | < LLOQ < LLOQ | 4.86 (5.28) 10.5 (11.8) |
| Median (IQR) ng/mL µg/g crea | < LLOQ < LLOQ | < LLOQ < LLOQ | 3.08 (1.49-6.22) 7.23 (3.40-13.7) |
| AB (urine)*** | |||
| Mean (SD) ng/mL µg/g crea | < LLOQ < LLOQ | < LLOQ < LLOQ | 4.83 (5.15) 9.86 (9.88) |
| Median (IQR) ng/mL µg/g crea | < LLOQ < LLOQ | < LLOQ < LLOQ | 3.25 (1.49-5.88) 7.38 (3.04-12.6) |
| 2CyEMA (urine)*** | |||
| Mean (SD) ng/mL µg/g crea | 0.79 (0.83) 1.42 (0.69) | 0.68 (0.60) 1.62 (1.35) | 99.0 (99.1) 178 (118) |
| Median (IQR) ng/mL µg/g crea | 0.46 (0.29-0.96) 1.30 (0.86-1.79) | 0.49 (0.29-0.87) 1.26 (0.91-1.85) | 81.5 (29.1-132) 172 (70.0-267) |
| CEVal (washed erythrocyte)*** (pmol/g globin) | |||
| Mean (SD) | < LLOQ | < LLOQ | 142 (80.4) |
| Median (IQR) | < LLOQ | < LLOQ | 147 (81.5-190) |
| COHb (blood)*** (%) | |||
| Mean (SD) | 2.58 (0.37) | 2.60 (0.33) | 4.99 (2.13) |
| Median (IQR) | 2.49 (2.36-2.85) | 2.56 (2.39-2.84) | 4.33 (3.43-6.34) |
| PG (urine) | |||
| Mean (SD) µg/mL mg/g crea | 2.26 (7.12) 3.87 (6.63) | 1.62 (4.26) 3.67 (7.42) | 4.39 (14.2) 6.78 (11.9) |
| Median (IQR) µg/mL mg/g crea | 0.54 (0.31-1.88) 1.35 (0.69-3.67) | 0.64 (0.27-1.19) 1.58 (0.78-3.45) | 1.23 (0.47-2.92) 1.96 (1.15-5.11) |
In FS and NS, mean and median concentrations were below the LLOQ for cotinine, TNE, NAB, AT, AB, and CEVal, and slightly above the LLOQ for 2CyEMA (both mean and median above LLOQ), as well as for NNAL, NNN, and NAT (only the mean above LLOQ for these three TSNAs). In contrast, those biomarkers showed significantly higher levels in CS. COHb and PG were found at quantifiable concentrations in all and 98% of samples, respectively. COHb was significantly elevated in CS compared to NS and FS, while PG showed no difference between the three groups. None of the investigated BoEs had any significant difference between NS and FS. Moreover, no significant difference in biomarker levels was observed between sexes. Since the FS had quit smoking at least 10 months prior to the study, BoEs were largely below LLOQ with no discernible trend observed.
The ability of the biomarkers to differentiate CS from FS and NS was confirmed in the current study for all BoEs, which were significantly higher in the CS group (P < 0.001), except PG (which indicates EC vaping). The most pronounced differences were observed for cotinine and TNE in urine, with concentrations roughly three orders of magnitude higher in CS, followed by 2CyEMA in urine (over 100-fold higher in CS) and CEVal (median FS/NS < LLOQ vs. 147 pmol/g globin). However, for accurate biochemical verification of product use status, a BoE should not only differ significantly between populations but also be sufficiently specific and selective to identify use-specific exposure at the individual level, as determined by ROC analysis in large cohorts for several BoEs, which provide a threshold or cutoff level. The cutoff values used in the current study to discriminate participants based on product use and verify reported smoking status were established based on published literature data. The cutoffs applied in this study are given in Table 3. A summary of published cutoff values, average levels and confidence intervals of the exposure biomarkers is provided in Supplementary Table 1. No threshold level to distinguish EC users from non-users has been reported so far. Hence, we applied data from a previous study conducted in our lab comparing PG levels in different user groups to determine the threshold used in this study[14].
Cutoff values applied in the present study and estimated detection period of the BoEs of different product users
| BoEs | Median or GM in users | Cutoff value | Half-life | Detection period |
| Cotinine | 2,716 ng/mL[9] 2,776 μg/g crea[9] | 50 ng/mL 100 μg/g crea | 16 h | 3-4 days |
| NNAL | 279 pg/mL[24] 285.4 ng/g crea[24] | 10 pg/mL 8.9 ng/g crea | 10-18 days | 50-90 days |
| AT | 9.24 ng/mL[25] | 2 ng/mL | 10 h | 22 h |
| AB | 6.28 ng/mL[25] | 2 ng/mL | 16 h | 26 h |
| 2CyEMA | 125 ng/mL[12] 145 µg/g crea[12] | 7.32 ng/mL 11.4 µg/g crea | 8 h | 30-32 h |
| CEVal | 133 pmol/g globin[22] 217 pmol/g globin[26] | 35 pmol/g globin | 30 days | 60-80 days |
| PG | 45.6 µg/mL[14] | 12 µg/mL | 2-4 h | 4-8 h |
| eCO | 12 ppm[27] | 7 ppm | 2-8 h | 2-6 h |
| COHb | 5.8%[28] | 3% | 2-8 h | 2-8 h |
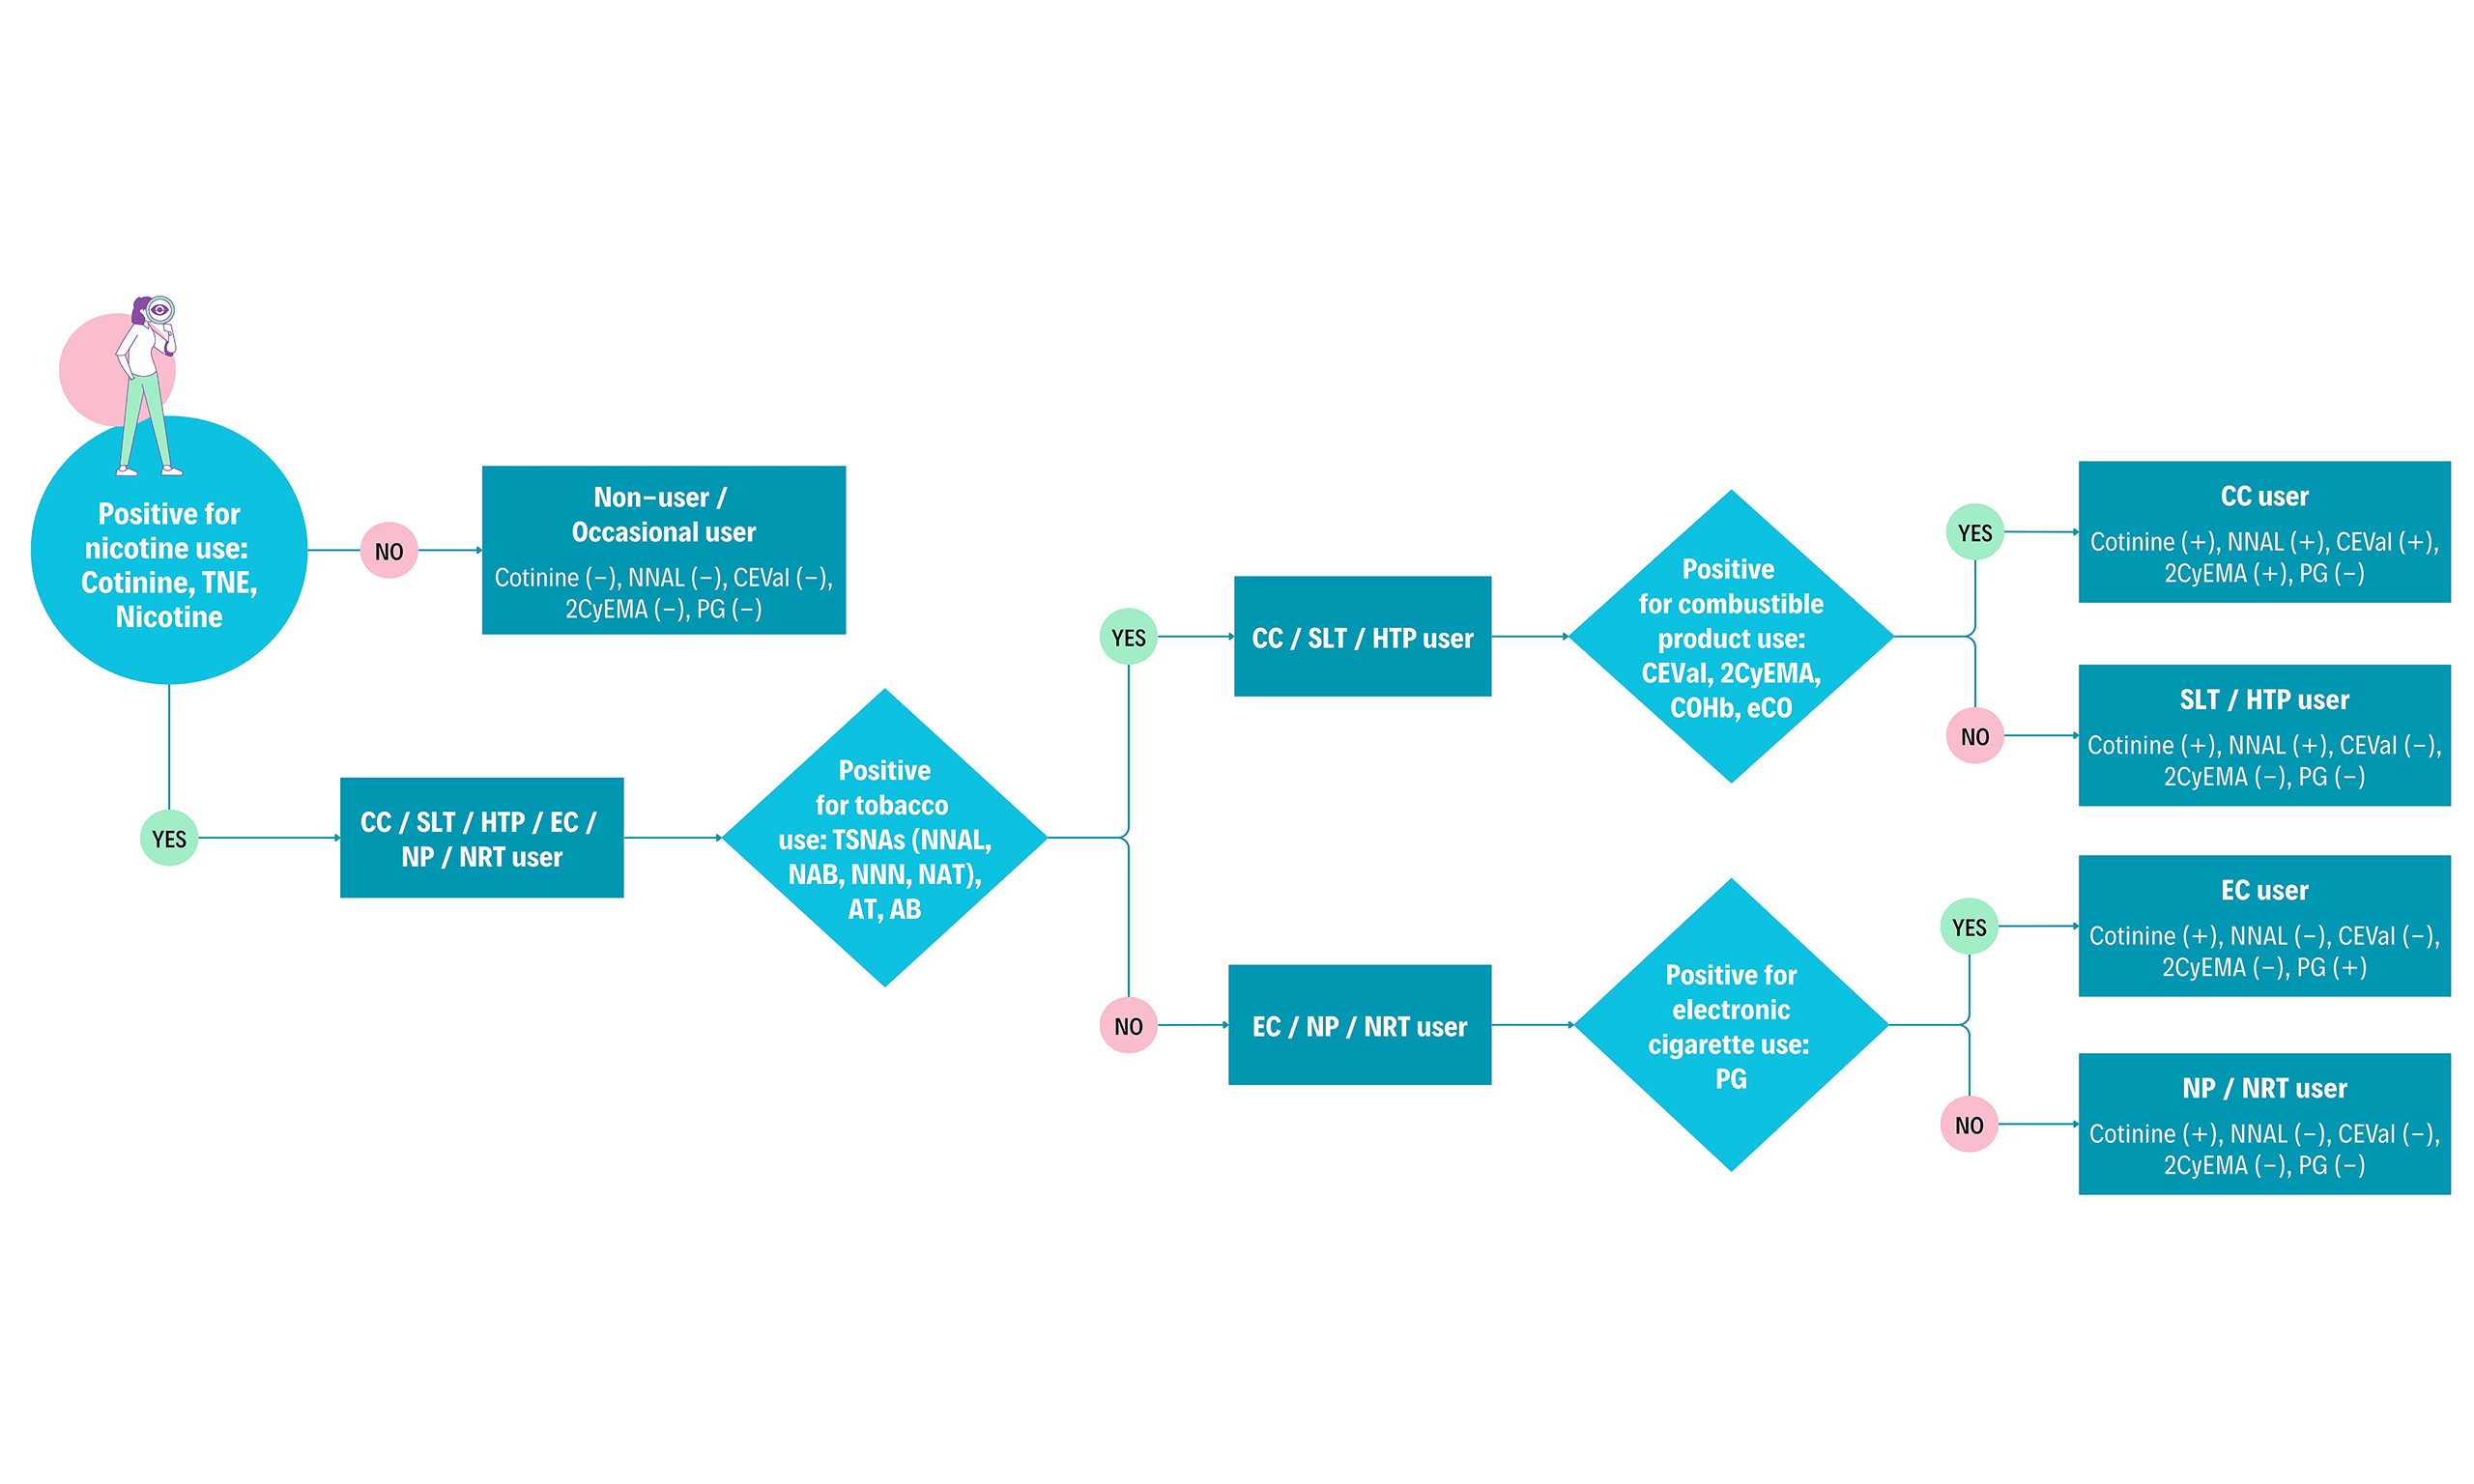
Detection periods of the most discriminatory BoEs are also provided in Table 3. The term detection period refers to the estimated duration a BoE remains measurable above the cutoff to distinguish between users and non-users. The detection period for each of the BoEs was estimated based on the difference between the median or GM concentration in users and the cutoff value (expressed as fold change) and the half-life derived from available literature data. Of note, the detection period is mostly expressed as ranges in case of different BoE thresholds and half-lives, respectively, reported in the literature. In the following paragraphs, rationale for selecting the BoEs used in this study and the applied threshold will be discussed in the order as illustrated in Figure 1.
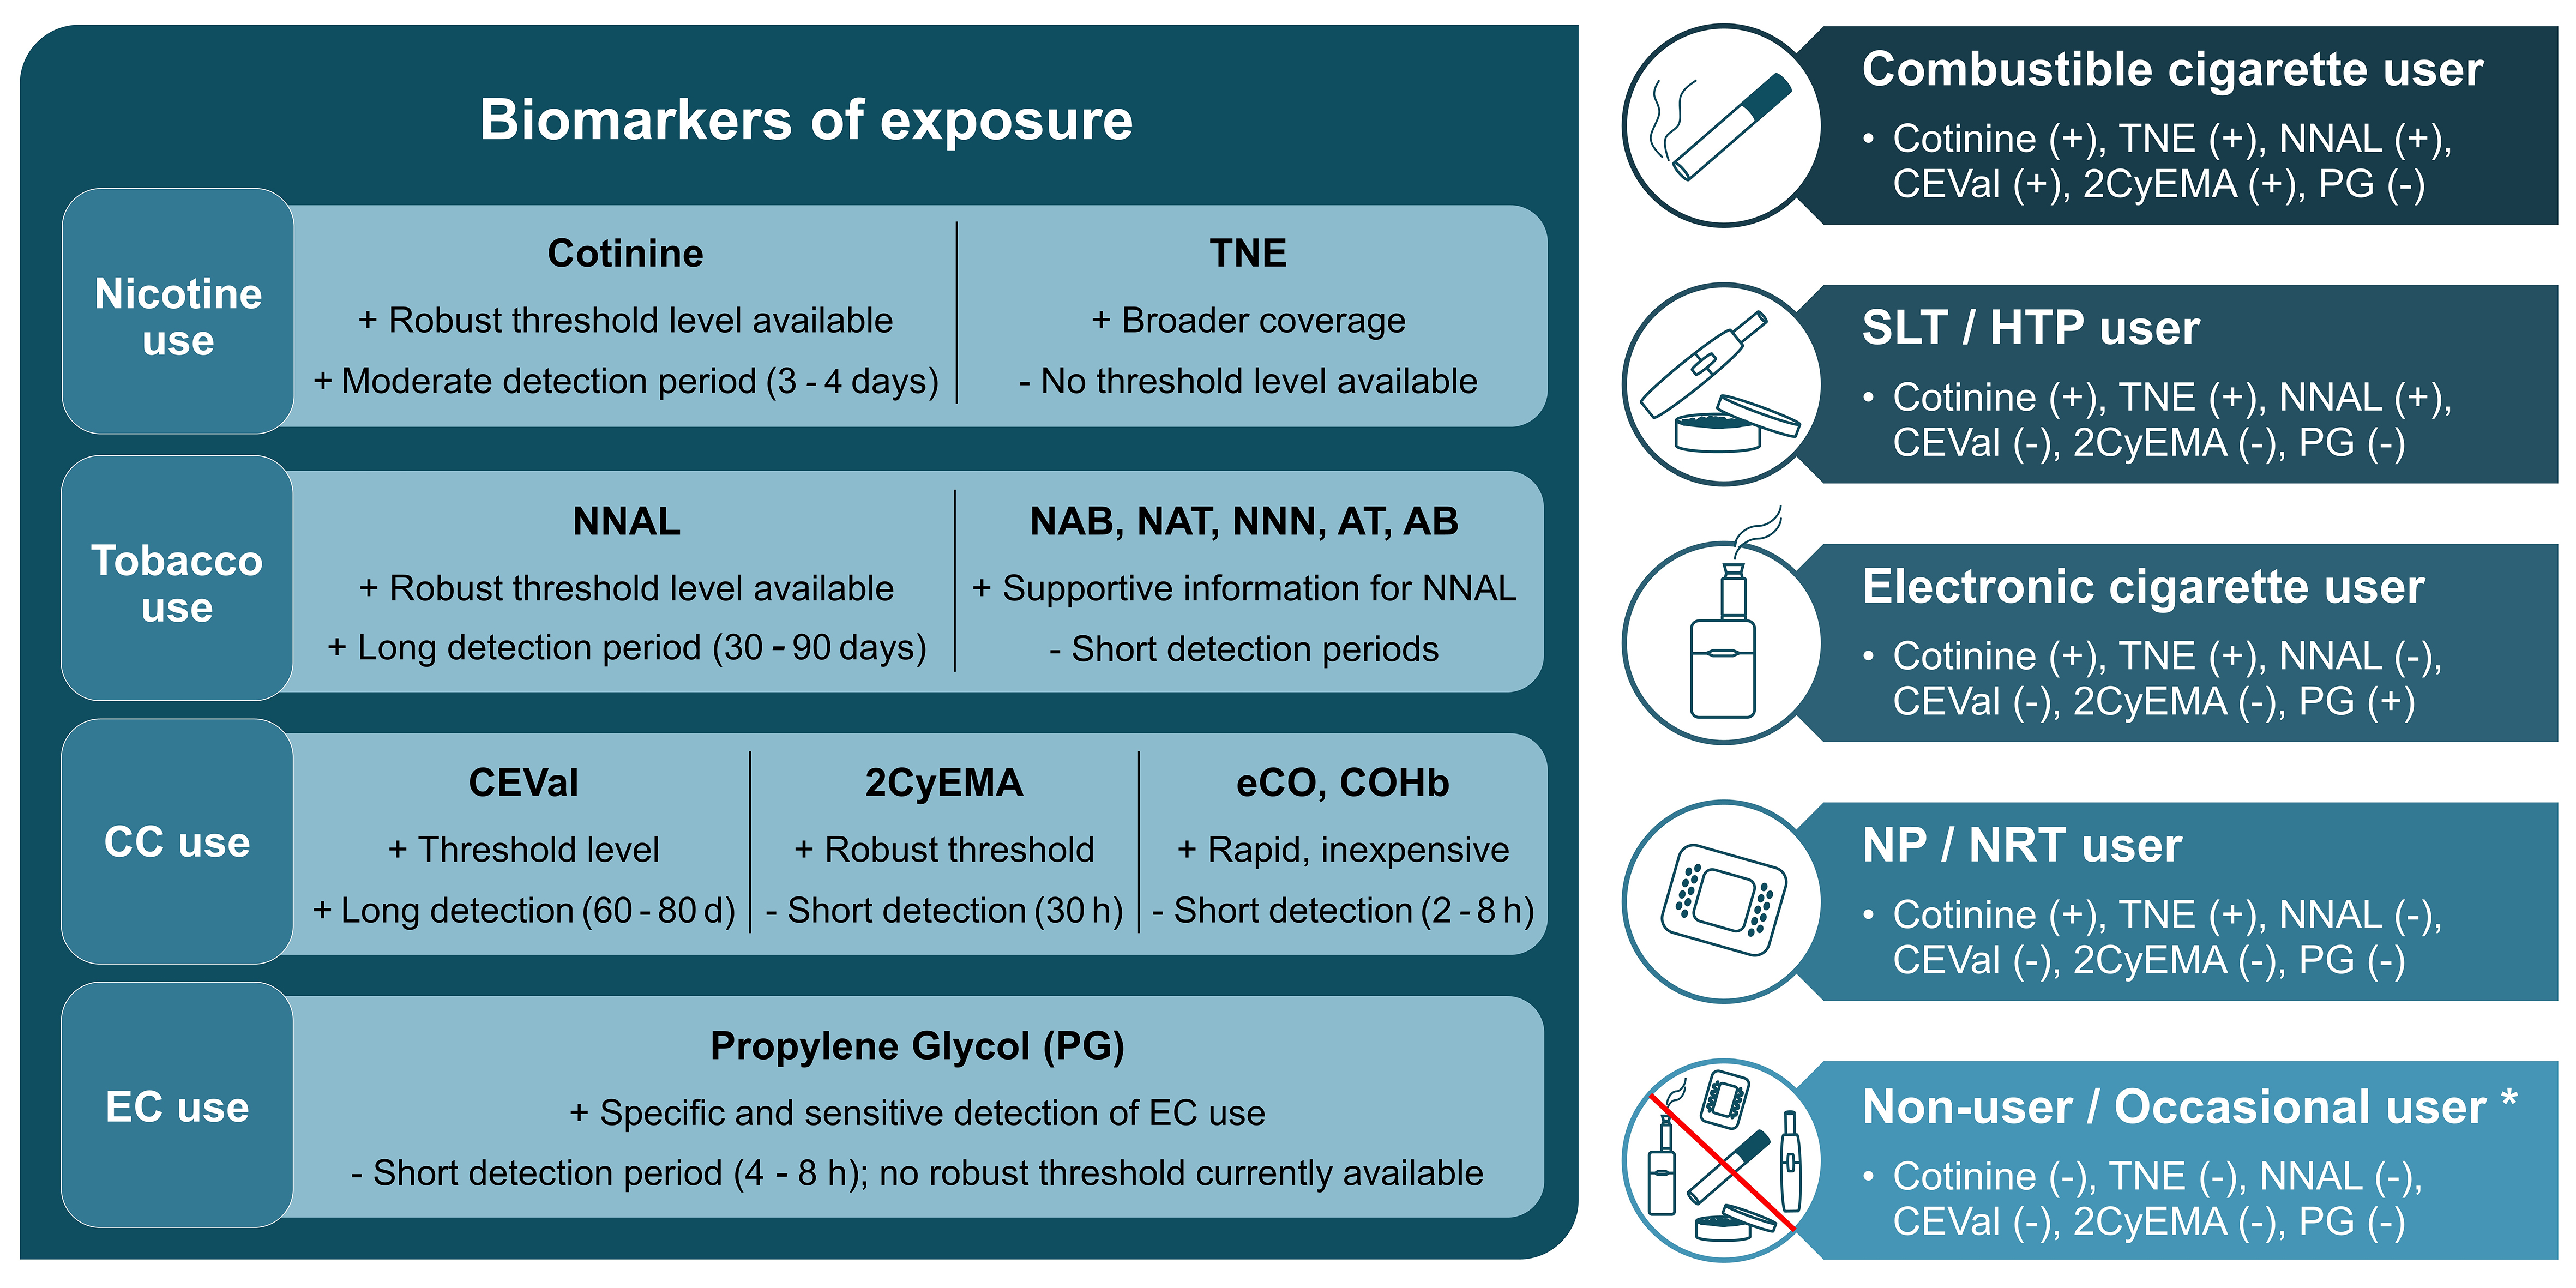
Figure 1. Left: BoEs for different use cases ranked by priority (left to right). Strengths and limitations illustrated by + and -. Right: Different product user groups and presence (+) or absence (-) of the biomarkers above a predefined threshold to discriminate between those groups, adapted from[8]. Occasional users might have borderline positive levels of some biomarkers depending on the use frequency and recency of exposure. Figure created in Microsoft PowerPoint. BoEs: Biomarkers of exposure; TNE: total nicotine equivalent, NNAL: 4-(methylnitrosamino)-1-(3-pyridyl)-1-butanol; NAB: N-nitrosoanabasine; NAT: N-nitrosoanatabine; NNN: N-nitrosonornicotine; AT: anatabine; AB: anabasine; CC: combustible cigarette, CEVal: cyanoethylvaline; 2CyEMA: 2-cyanoethyl mercapturic acid; eCO: exhaled carbon monoxide; COHb: carboxyhemoglobin; EC: electronic cigarette, SLT: smokeless tobacco, HTP: heated tobacco product, NP: nicotine pouch, NRT: nicotine replacement therapy.
The biochemical verification of nicotine or tobacco product use starts with nicotine and its metabolites. In humans, between 70%-80% of nicotine is converted to cotinine[29]. Therefore, it can distinguish users of any nicotine product (CC, HTP, EC, nicotine gum/pouch) from non-users. In the current study, we evaluated cotinine alone and the sum of nicotine, cotinine, 3-hydroxycotinine and their glucuronides (TNEs) to monitor nicotine exposure. Cotinine is routinely applied for this purpose as the major metabolite of nicotine with a moderately long detection period of 3-4 days compared to nicotine[5]. A wide range of urinary cotinine cutoff values has been suggested in the literature, ranging from 30 to 200 ng/mL and 20 to 100 μg/g creatinine[5,30-34]. Exposure to second-hand smoke can lead to the presence of cotinine in the urine of NS. Therefore, the selection of an appropriate threshold level depends on the research purpose and outcome variables. Based on our observation, a threshold level of 30-50 ng/mL urinary cotinine concentration is appropriate as suggested by the Society for Research on Nicotine and Tobacco (SRNT) Subcommittee on Biochemical Verification[5]. However, higher values can be used to ensure the inclusion of only heavy smokers. In the current study, 50 ng/mL and 100 μg/g creatinine were used successfully to distinguish smokers from NS. TNE covers a larger proportion of the nicotine dose than cotinine alone (around 90% for TNE vs. 70%-80% for cotinine)[35]. Hence, TNE can more accurately determine nicotine exposure as it has less intra- and inter-individual variability than cotinine in urine. However, to our knowledge, no threshold level has been reported for TNE. Without cutoff values, average TNE level of 29 ng/mL (NS), 310 ng/mL (FS), 7,420 ng/mL (CS) and 95% confidence interval for CS (4,360-11,605 ng/mL) was used to support the categorization based on cotinine[36].
TSNAs and minor alkaloids (AB, AT) are present in tobacco and therefore suited to distinguish users of tobacco-derived products such as CC, SLT and HTPs from non-tobacco-derived nicotine sources such as ECs, nicotine gums or pouches. NNAL is a long-term biomarker that can be detected in urine for up to three months[11]. The minor tobacco alkaloids have half-lives of 16 h for AB and 10 h for AT based on urinary excretion data[37], which can be detected at a significantly elevated level for around 24 h in CC users. Due to its longer detection period, NNAL can capture tobacco product use over a longer time frame than NNN, NAB, NAT, AT, and AB, which are useful for supporting group differentiation based on urinary NNAL levels. Similar to nicotine metabolites, exposure to second-hand smoke can result in NNAL in the urine of NS. Literature data varies between 10-40 pg/mL and 8.9 ng/g creatinine as cutoff value[5,24,34]. The current study used 10 pg/mL and 8.9 ng/g creatinine as the threshold level. While all compliant smokers in the study had higher levels than the threshold, 6% of the compliant NS had borderline high levels of NNAL, possibly due to exposure to second-hand smoke. These NS were verified as compliant due to none or lower levels of other BoEs. The GM of NAB, NAT, and NNN - 1.1, 3, and 2 ng/g creatinine, respectively, in non-users, and 19.6, 125.2, and 13.8 ng/g creatinine, respectively, in CC users - was used as supportive information[38]. The cutoff level of urinary AT and AB ranges between 0.097-2 and 0.236-3 ng/mL, respectively[5,25,39,40]. A cutoff level of 2 ng/mL was used in this study for both analytes to support differentiation based on NNAL.
The major biomarkers of combustible product use are 2CyEMA in urine and CEVal in washed erythrocytes, both detecting exposure to acrylonitrile, which is formed during the combustion of cigarettes. The Centers for Disease Control and Prevention [CDC, United States (US)] analyzed urinary 2CyEMA levels in 5,707 adult US non-smokers and smokers and concluded that it is an effective biomarker to distinguish NS from cigarette smokers. They proposed a cutoff concentration of 7.32 ng/mL and 11.4 µg/g creatinine with high sensitivity and specificity (≥ 0.925) which were used in this study[12]. While another study reported a cutoff value of 5.84 ng/mL[41], the observed urinary 2CyEMA levels in the current study corresponded very well with the proposed threshold levels from CDC. With a detection period of around 30 h, it is an accurate short-term measure to differentiate between combustible and non-combustible product use. CEVal, the long-term equivalent of 2CyEMA, is capable of detecting past smoking up to 3 months. A large clinical study with smokers switching to an HTP proposed a cutoff concentration of 35 pmol/g globin to verify cigarette smoking status[8,42]. While all NS in the current study had CEVal levels below the threshold level, 8% of compliant CS had CEVal levels borderline below the threshold. These participants were characterized as compliant based on other BoEs such as NNAL. Given the biomarker distribution observed in this study, a lower CEVal cutoff level may offer improved sensitivity for distinguishing compliant smokers from NS. Additional biomarkers of combustible product use are exhaled CO and blood COHb. They are indicative of CC use and can be used as supportive biomarkers. In blood, CO binds to hemoglobin forming COHb, the blood biomarker of CO exposure. Alternatively, CO can be measured in EB (eCO), directly at the clinical site at low cost. Both COHb and eCO are limited due to the short detection period (2-8 h), dependence on physiological factors (pulmonary ventilation rate) and other environmental exposure sources (pollution) as a stand-alone verification measure. Thus, selecting a “gold standard” threshold concentration of eCO is challenging. For instance, higher levels of air pollution in large industrial areas can lead to higher eCO levels, while physical activity or exercise can lead to lower eCO concentrations[7]. In addition to presence in the environment (e.g., automobile exhaust and home barbecue smoke), CO has a very short half-life that is dependent on pulmonary ventilation rate. During exercise, it can be as brief as 1 h. During sleep its half-life is 4-8 and 2-3 h with sedentary activity[7]. Therefore, smokers cannot be distinguished from NS already after abstinence for 2-8 h. In 2002, the SRNT Subcommittee on Biochemical Verification report first suggested that a threshold of 8-10 ppm of eCO should sufficiently distinguish a smoker from abstinence[7]. However, several studies over the following years have successfully used a lower cutoff with high sensitivity and specificity. Therefore, the SRNT subcommittee reviewed and recommended setting a broad cutoff between 4-10 ppm to differentiate smokers and non-smokers[5]. The report also suggested that the selection of an appropriate threshold relies on the clinical and research purpose keeping the known influences in mind. In the current study, a cutoff value of 7 ppm was used for rapid verification at the clinical site with a few exceptions. 6 CS having eCO less than 7 ppm and 1 FS with eCO above 7 ppm were allowed to participate in the study, as these were identified as compliant with our multi-biomarker approach. On the other hand, two eCO-compliant CS subjects were found to be non-compliant biochemically. This observation emphasizes the risk of misclassification relying solely on eCO measurements. The broad cutoff range suggested by the SRNT subcommittee and the high variance in eCO levels of compliant subjects in our study emphasize the need for more accurate biochemical verification of CC use using 2CyEMA and CEVal. COHb level in blood was also analyzed in the current study to verify the eCO measurements and support group differentiation. Since both biomarkers are produced via the same mechanism, they are expected to have a near-perfect correlation[43]. A very strong positive correlation was observed here (r = 0.85; P < 0.001). COHb is affected by the same limitations as for eCO (short detection period, environmental factors). Previous literature suggested using a cutoff value of around 2.5% COHb[44-46]. Other studies reported COHb in smokers in the range of 3% to 15% and an average of 5.8%[28,47]. The current study used a 3% threshold value as supportive information, and the results support using 2.5%-3% COHb as the cutoff.
PG is the only known biomarker capable of distinguishing EC users from non-users, with some limitations. To our knowledge, only two published studies with small sample sizes have shown a significant increase in PG levels in the urine and plasma of EC users[14,15]. Moreover, PG has a short detection period (approximately 4-8 h) and can also originate from sources such as food, cosmetics and pharmaceuticals[14-16]. For cutoff value calculation, data from 70 samples of EC users and 350 samples of non-users were used. ROC analysis provided an optimum cutoff value of 5.56 µg/mL (98.57% sensitivity, 99.43% specificity) and 12.3 mg/g creatinine (98.6% sensitivity, 99.7% specificity). However, 12 µg/mL and 20.3 mg/g creatinine were selected as cutoffs in the present study since these values provided 100% specificity in ROC analysis. We opted for a threshold with 100% specificity to avoid non-users being misclassified as EC users because of the aforementioned limitations of using PG as an EC exposure biomarker. Assessment of urinary PG in larger cohorts will be needed to set a more accurate and robust cutoff value.
Other BoEs, such as those for polycyclic aromatic hydrocarbons (PAHs) - for example, the mono-hydroxylated PAHs - were not analyzed in this study because not all PAHs are significantly elevated in CS and some may have additional sources of exposure (e.g., combustion, diet, ambient air)[48]. Moreover, the half-life of PAHs in humans is relatively short, approximately 2.5-6 h[49]. Biomarkers reflecting free radical-induced oxidative damage in smokers, such as lipid peroxidation products (e.g., malondialdehyde, 8-iso-prostaglandin F2α), and biomarkers reflecting inflammation (e.g., soluble intercellular adhesion molecule-1, leukotrienes) are part of BoPHs and will be reported elsewhere.
Correlation of BoEs with biochemically determined exposure variables vs. self-reported CPD
For correlation analysis, we selected reported CPD, eCO, and COHb in blood as smoking exposure variables, as well as urinary cotinine and TNE as nicotine exposure variables. Correlations between these exposure variables and BoEs are presented in Table 4. Reported CPD showed very weak to moderate correlations with the selected biomarkers. The long-term BoEs, CEVal and NNAL, showed moderate correlations with CPD (Spearman r = 0.43). Correlations of CPD with 2CyEMA, NNN, and NAT were weak, with Spearman r values around 0.35. Correlations of CPD with minor tobacco alkaloids were very weak and non-significant. Correlations improved to moderate-to-strong positive when biochemically determined exposure variables were associated with the exposure biomarkers. COHb and 2CyEMA were most strongly correlated (r = 0.78), followed by the correlation of cotinine with NAT (r = 0.74). All correlations of biochemically determined exposure variables with exposure biomarkers were highly significant (P < 0.001, Mann-Whitney U test). Correlations between BoEs and biochemically determined exposure variables (eCO, COHb, cotinine, and TNE) were stronger compared to self-reported CPD. Several studies have reported similar or better correlations between these exposure variables and biomarkers of tobacco and combustion product use, thus establishing their use as biomarkers of compliance[50]. Moreover, the weaker correlation with self-reported CPD signifies the importance of biochemical verification, especially in ambulatory settings such as cross-sectional or longitudinal trials.
Spearman correlation coefficient (r) and statistical significance levels of some selected biomarkers with reported consumption and exposure variables
| Exposure biomarkers | CPD | eCO (ppm) | COHb (%) | Cotinine (µg/g crea) | TNE (µg/g crea) |
| CEVal (pmol/g globin) | 0.43*** | 0.60*** | 0.65*** | 0.48*** | 0.58*** |
| 2CyEMA (µg/g crea) | 0.34* | 0.71*** | 0.78*** | 0.55*** | 0.67*** |
| NNAL (ng/g crea) | 0.43*** | 0.61*** | 0.68*** | 0.53*** | 0.59*** |
| NAB (ng/g crea) | 0.17 | 0.50*** | 0.51*** | 0.63*** | 0.58*** |
| NNN (ng/g crea) | 0.35** | 0.50*** | 0.52*** | 0.60*** | 0.51*** |
| NAT (ng/g crea) | 0.39** | 0.62*** | 0.66*** | 0.74*** | 0.67*** |
| AT (µg/g crea) | 0.17 | 0.54*** | 0.55*** | 0.62*** | 0.57*** |
| AB (µg/g crea) | 0.19 | 0.55*** | 0.56*** | 0.67*** | 0.59*** |
Application of the biomarkers of use compliance: identification of non-compliant subjects
Out of the 180 subjects, we classified six subjects as non-compliant with the eligibility criteria based on Figure 1. Among them, four were reported as CS, one as FS, and one as NS. We performed a principal component analysis (PCA) illustrating their distinct biomarker pattern outside of the typical pattern of the respective group [Figure 2]. Decision trees depicting the non-compliant biomarker levels are given in the Supplementary Figures 1-6.
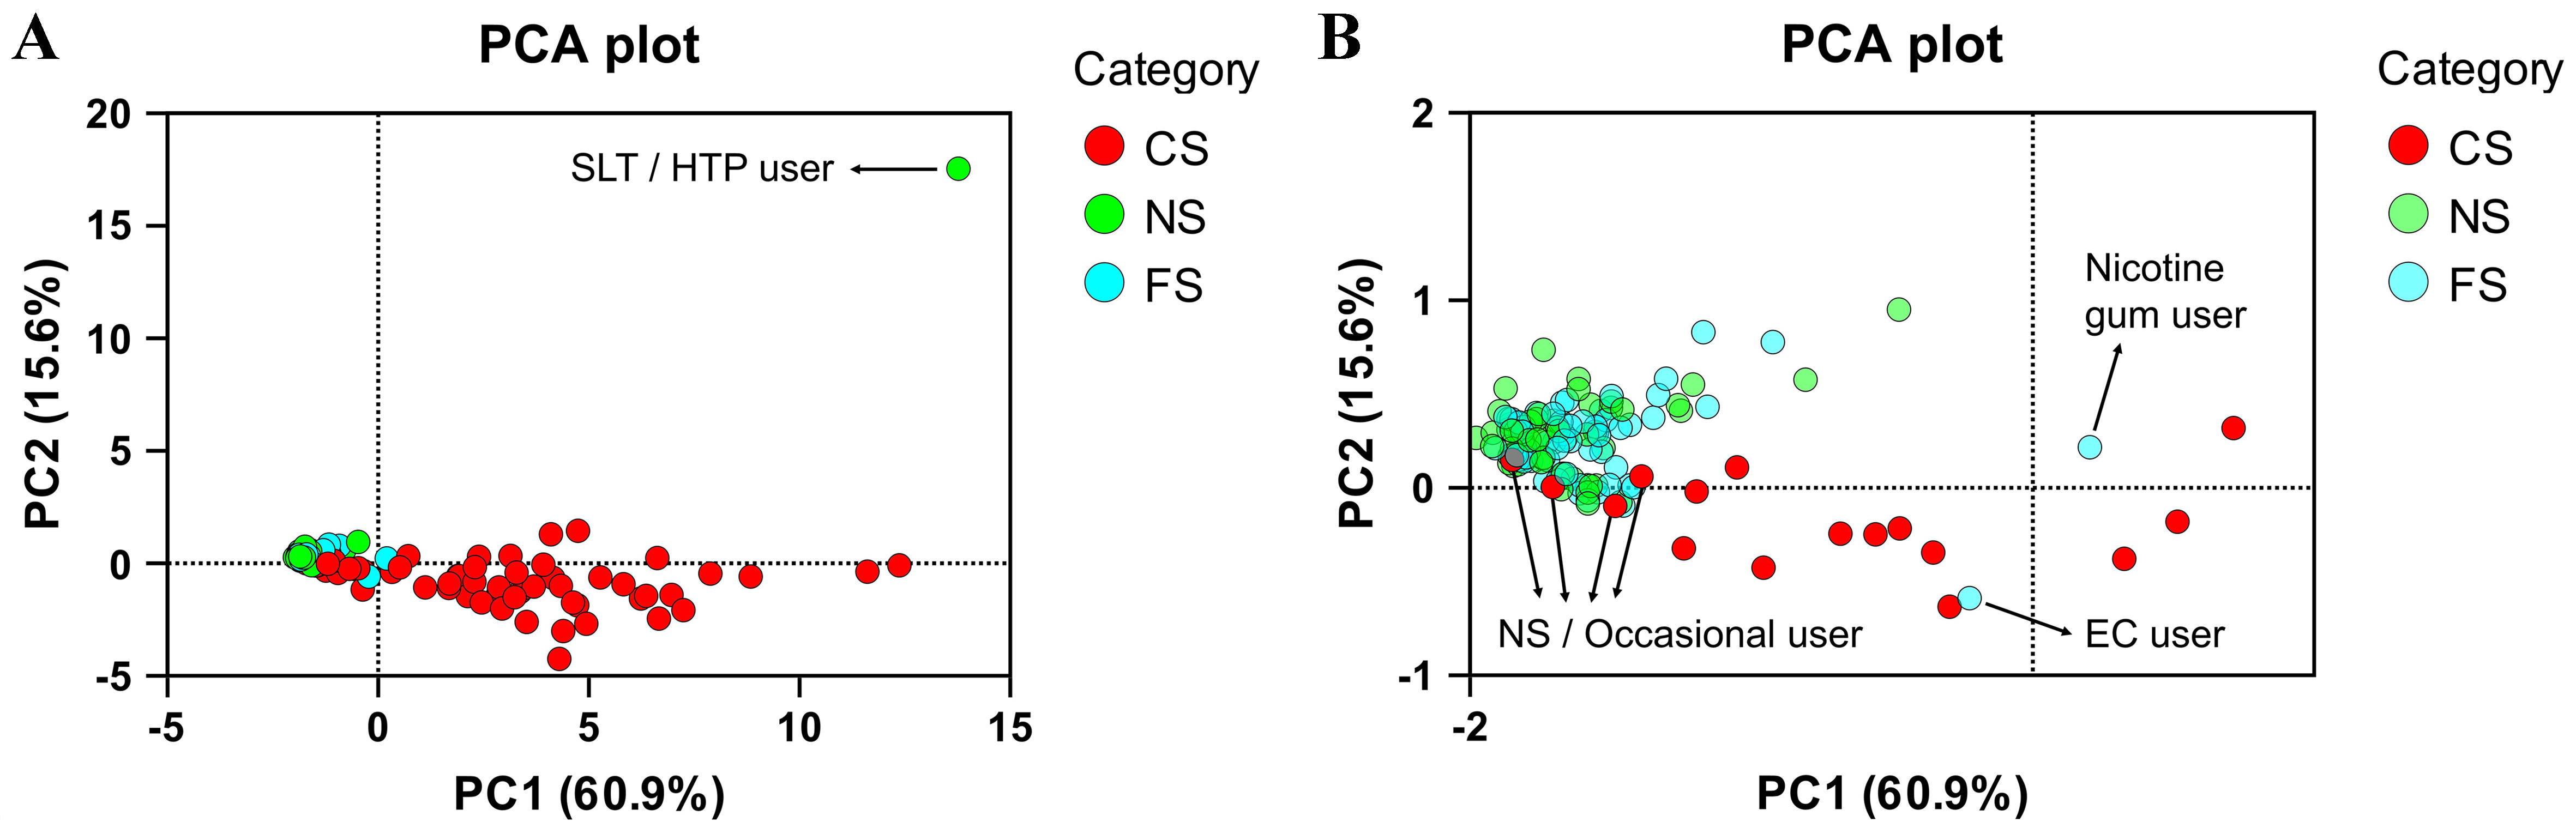
Figure 2. PCA plot of the study participants based on the BoEs. Six non-compliant subjects and one nicotine gum user are indicated in (A) the full PCA plot and (B) a zoomed-in PCA plot for clearer illustration of non-compliant participants. Figure created using GraphPad Prism, version 10. PCA: Principal component analysis; BoEs: biomarkers of exposure; SLT: smokeless tobacco; HTP: heated tobacco product; CS: current smokers; NS: never smokers; FS: former smokers; EC: electronic cigarette.
The non-compliant NS was determined to be an SLT or HTP user with one of the highest concentrations of urinary cotinine and the highest amount of urinary TSNAs present in the study. The subject tested positive for nicotine use (cotinine: 2,630 ng/mL or 11,794 μg/g creatinine, TNE: 6,016 ng/mL or 26,978 μg/g creatinine) and positive for tobacco use (NNAL: 508 pg/mL or 2,278 ng/g creatinine, NAB: 46.6 pg/mL or 209 ng/g crea, AT: 12.8 ng/mL or 57.4 μg/g creatinine and AB: 42 ng/mL or 188.3 μg/g creatinine). Since no biomarkers of combustible product use (2CyEMA, CEVal) were present and eCO was at 2 ppm, the subject was identified as an SLT or HTP user [Figure 1 and Supplementary Figure 1]. No further differentiation between SLT and HTP was made.
The non-compliant FS was identified as a user of EC. The participant tested positive for nicotine use (cotinine: 6,540 ng/mL or 6,000 μg/g creatinine; TNE: 17,190 ng/mL or 15,771 μg/g creatinine) but negative for tobacco use (no TSNAs or minor alkaloids present), and biomarkers of combustible product use were absent. However, urinary PG concentration was 110 μg/mL or 100.9 mg/g creatinine. Although limited data are available for urinary PG levels after EC use, the high levels observed here, along with high cotinine and TNE, indicate EC use (cutoff: 12 µg/mL or 20.3 mg/g creatinine; average in the literature: 9.8 µg/mL in non-users and 25.6 µg/mL in EC users). A FS was also discovered to use nicotine gum, patch or pouch with high levels of cotinine and TNE but BoEs of CC, tobacco and EC use below cutoff [Supplementary Figure 7]. The subject was not excluded from the study since it was not an exclusion criterion for participants who were FS. Following up on the finding, the participant confirmed using nicotine gum occasionally.
The non-compliant CS were biochemically determined to be NS or occasional smokers due to absence or generally below cutoff levels of biomarkers of nicotine use (cotinine, TNE), tobacco use (TSNAs, AT, AB) and combustible product use (2CyEMA, CEVal) [Supplementary Figures 3-6]. The moderate detection period of 3-4 days for cotinine can result in reduced urinary levels after a few days of abstinence. In fact, abstinence is not uncommon among some participants when they enter a trial, as they may want to improve their performance in physical examinations and biomarker tests. In this case, long-term biomarkers such as CEVal and NNAL can provide evidence of CC and tobacco use, respectively, indicating past smoking or SLT over a longer term. For all non-compliant smokers in the study, biomarkers of tobacco use and combustible product use were generally below the cutoff values, except for one subject who had CEVal and NNAL levels around the cutoffs but was negative for cotinine and TNE, indicating infrequent use of CCs. The participants later admitted that they changed their smoking behavior during the clinical trial period to achieve better test results. Since the samples were collected at the last visit, approximately 7-10 days after the initial visit, the participant’s account can plausibly explain the biomarker levels. Another non-compliant participant (reported CS) was determined to have CEVal and NNAL levels marginally below the cutoff values with no detectable nicotine exposure biomarkers. Subsequent follow-up confirmed the participant’s occasional use of CC, consistent with the initial suspicion. In any case, these subjects were excluded from the study due to the specified eligibility criteria of smoking at least 10 CCs per day. The aforementioned cases underscore the utility of long-term biomarkers CEVal and NNAL to detect non-compliance. These long-term biomarkers are particularly valuable for identifying light or occasional smokers who might misrepresent themselves as NS by abstaining during the trial period, thereby evading detection through short-term exposure markers. The remaining two non-compliant CS were either unreachable or did not acknowledge non-compliance. However, their BoEs levels were consistent with non-smoking. Therefore, the 4 reported CS were excluded from the study as they were biochemically identified as NS or occasional smokers at best.
Limitations, recommendations and future applications
The observed biomarker patterns demonstrated strong potential for broader applications. With further validation in larger cohorts, the biomarker panel can significantly improve use verification across diverse tobacco product users and trial settings. Such a robust biomarker setup could be integrated into post-market surveillance programs to monitor compliance with product use claims for emerging nicotine delivery systems, such as HTPs or NPs. Additionally, ensuring accurate participant classification in studies evaluating harm reduction or cessation efficacy is of particular interest for regulatory bodies that seek comprehensive evidence with regard to the risks and benefits of new products for public health. The proposed multi-biomarker approach could potentially be adopted by regulatory bodies to improve data quality in longitudinal clinical trials evaluating product exposure, harm, and/or switching efficacy, as requested, for instance, in premarket tobacco product applications (PMTA) by the FDA. Several considerations should be taken into account when using the presented panel of BoEs and the applied cutoff values to discriminate between non-smokers, smokers, and other product users:
1. A holistic multi-biomarker approach provides a more comprehensive assessment and leads to more accurate discrimination of the study groups, because the level of a single BoE does not necessarily prove non-compliance, as discussed for eCO.
2. Adaptation of the biomarker panel based on the eligibility criteria of the trial: For instance, if dual use of CC and EC is allowed, presence of urinary PG above the threshold presented here will not lead to exclusion from the trial.
3. Recognizing the limitations of short-term biomarkers: Short detection periods of only a few hours (for instance, eCO) can limit their validity, especially in longitudinal switching and cessation trials. In such trial settings, CEVal would be clearly preferred over 2CyEMA.
4. Biomarkers with limited data or small differences between users and non-users - for instance, due to other environmental exposure sources (eCO, COHb) or small elevations in users (AT in smokers) - should be evaluated carefully and in conjunction with more established biomarkers.
5. Prioritization of biomarkers should take into account the specificity, detection period, confounding factors [e.g., environmental (ubiquitous), second-hand smoke, and occupational exposure], and availability of robust cutoff values derived from large cohort studies. BoEs were ranked in Figure 1 accordingly. For instance, cotinine is preferred over TNE and nicotine to distinguish nicotine product users from non-users since a robust cutoff could be applied and nicotine’s limitation in terms of very short half-life and environmental exposure (cotinine > TNE > nicotine). NNAL is the first choice to detect tobacco use considering its longer detection period and well-established cutoff level (NNAL > NAB, NAT, NNN, AT, AB). The long-term biomarker CEVal is superior to all other BoEs for identification of CC use (CEVal > 2CyEMA > COHb, eCO).
6. The goal of the research should guide the identification and exclusion of the non-compliant participants.
CONCLUSIONS
In conclusion, the current study demonstrated the suitability of a multi-biomarker approach proposed by the CORESTA Biomarker Subgroup to biochemically verify nicotine and tobacco product use compliance in clinical trials. The selection of appropriate cutoff values and consideration of the biomarkers’ detection periods play critical roles in verifying smoking abstinence or use, particularly in cross-sectional and longitudinal studies in tobacco harm reduction research. Setting suitable thresholds ensures accurate classification of study participants, leading to improved validity and reliability of the research outcomes. Historically used verification measures can only confirm recent smoking, with poor specificity (eCO) and sensitivity (cotinine strip test). In contrast, the demonstrated holistic approach enables differentiation between different nicotine and tobacco product user groups. In the current study, 10% of the CS subjects and one non-smoker would have been misclassified if relying solely on eCO measurement. Three percent of the total participants and 7% in the CS group were identified as non-compliant using the applied BoE panel. Population-representative data for less investigated BoEs, such as urinary PG, the identification of new use-specific biomarkers by non-targeted analysis, and ROC analysis of biomarker levels will further improve the accuracy of the presented approach. In conclusion, the proposed multi-biomarker approach holds promise for significantly improving data quality, especially in longitudinal product-switching and cessation studies.
DECLARATIONS
Acknowledgments
ECLAT Srl, a spin-off company of the University of Catania, sponsored this investigator-initiated study through a grant from Altria Client Services LLC. ECLAT Srl is an independent research-based company that delivers solutions to global health problems, with particular emphasis on harm minimization and technological innovation.
We would like to thank the clinical site, Ashford and St Peter’s Hospitals (ASPH) National Health Service (NHS) Foundation Trust, England, and Metanoic Health Ltd, especially Meera Nadir, for conducting the study and collecting the biospecimens. We also thank our colleagues at ABF GmbH - Kirsten Riedel, Janina Mütze, Carmen Tiwald, Veronika Spindler, Johanna Kugele, Marta Latawiec, Michael Sprenzel, Richard Kanis, and Simona Veigl - for their excellent technical assistance in conducting the sample analyses.
Authors’ contributions
Writing - original draft, visualization, methodology, investigation, data analysis and interpretation, conceptualization: Sajid, A.
Writing - review and editing, supervision, resources, project administration, funding acquisition, conceptualization: Pluym, N.
Writing - review and editing: Burkhardt, T.
Writing - review and editing, data analysis: Belsey, J.
Investigation, conceptualization: John, I.
Writing - review and editing, project administration, conceptualization: Polosa, R.
Writing - review and editing, supervision, resources, project administration, funding acquisition, conceptualization: Scherer, M.
Availability of data and materials
Information related to this article can be found in the Supplementary Materials. Further data are available from the corresponding author upon reasonable request.
Financial support and sponsorship
This research was supported by Altria Client Services LLC (ALCS), USA.
Conflicts of interest
Sajid, A.; Pluym, N.; Burkhardt, T. and Scherer, M. are affiliated with ABF Analytisch-Biologisches Forschungslabor GmbH. John. I. is affiliated with Metanoic Health Ltd. The other authors declare no conflicts of interest.
Ethical approval and consent to participate
The study was conducted in accordance with the Declaration of Helsinki, and the protocol was approved by the Health Research Authority (HRA) and Health and Care Research Wales (HCRW) (IRAS project ID: 322282; 14 March 2023). All subjects provided informed consent prior to participation in the study.
Consent for publication
Not applicable.
Copyright
© The Author(s) 2026.
Supplementary Materials
REFERENCES
1. World Health Organization (WHO). Tobacco. 2025. https://www.who.int/news-room/fact-sheets/detail/tobacco. (accessed 2026-02-11).
2. Goniewicz, M. L.; Gawron, M.; Smith, D. M.; Peng, M.; Jacob, P. 3rd; Benowitz, N. L. Exposure to nicotine and selected toxicants in cigarette smokers who switched to electronic cigarettes: a longitudinal within-subjects observational study. Nicotine. Tob. Res. 2017, 19, 160-7.
3. Yayan, J.; Franke, K. J.; Biancosino, C.; Rasche, K. Comparative systematic review on the safety of e-cigarettes and conventional cigarettes. Food. Chem. Toxicol. 2024, 185, 114507.
4. Scherer, G. Suitability of biomarkers of biological effects (BOBEs) for assessing the likelihood of reducing the tobacco related disease risk by new and innovative tobacco products: a literature review. Regul. Toxicol. Pharmacol. 2018, 94, 203-33.
5. Benowitz, N. L.; Bernert, J. T.; Foulds, J.; et al. Biochemical verification of tobacco use and abstinence: 2019 update. Nicotine. Tob. Res. 2020, 22, 1086-97.
6. Pluym, N.; Burkhardt, T.; Scherer, G.; Scherer, M. The potential of new nicotine and tobacco products as tools for people who smoke to quit combustible cigarettes - a systematic review of common practices and guidance towards a robust study protocol to measure cessation efficacy. Harm. Reduct. J. 2024, 21, 130.
7. SRNT Subcommittee on Biochemical Verification. Biochemical verification of tobacco use and cessation. Nicotine. Tob. Res. 2002, 4, 149-59.
8. CORESTA Guides. No. 29 - Best practice in the application of biomarkers of exposure as compliance measures in long-term and epidemiological studies of new nicotine and tobacco products. 2024. https://www.coresta.org/best-practice-application-biomarkers-exposure-compliance-measures-long-term-and-epidemiological. (accessed 2026-02-11).
9. Feng, J.; Sosnoff, C. S.; Bernert, J. T.; et al. Urinary nicotine metabolites and self-reported tobacco use among adults in the population assessment of tobacco and health (PATH) study, 2013-2014. Nicotine. Tob. Res. 2022, 24, 768-77.
10. Wang, Z.; Zheng, Q.; Tscharke, B. J.; et al. High throughput and sensitive quantitation of tobacco-specific alkaloids and nitrosamines in wastewater. Talanta 2024, 277, 126401.
11. Goniewicz, M. L.; Havel, C. M.; Peng, M. W.; et al. Elimination kinetics of the tobacco-specific biomarker and lung carcinogen 4-(methylnitrosamino)-1-(3-pyridyl)-1-butanol. Cancer. Epidemiol. Biomarkers. Prev. 2009, 18, 3421-5.
12. Bhandari, D.; Zhang, L.; Zhu, W.; De Jesús, V. R.; Blount, B. C. Optimal cutoff concentration of urinary cyanoethyl mercapturic acid for differentiating cigarette smokers from nonsmokers. Nicotine. Tob. Res. 2022, 24, 761-7.
13. Jakubowski, M.; Linhart, I.; Pielas, G.; Kopecký, J. 2-Cyanoethylmercapturic acid (CEMA) in the urine as a possible indicator of exposure to acrylonitrile. Br. J. Ind. Med. 1987, 44, 834-40.
14. Burkhardt, T.; Pluym, N.; Scherer, G.; Scherer, M. 1,2-Propylene glycol: a biomarker of exposure specific to e-cigarette consumption. Separations 2021, 8, 180.
15. Hiler, M.; Breland, A.; Wolf, C. E.; Poklis, J. L.; Nanco, C. R.; Eissenberg, T. Are urine propylene glycol or vegetable glycerin markers of e-cigarette use or abstinence? Tob. Regul. Sci. 2020, 6, 235-41.
16. Yu, D. K.; Elmquist, W. F.; Sawchuk, R. J. Pharmacokinetics of propylene glycol in humans during multiple dosing regimens. J. Pharm. Sci. 1985, 74, 876-9.
17. International Council for Harmonisation of Technical Requirements for Pharmaceuticals for Human Use (ICH). ICH guideline M10 on bioanalytical method validation and study sample analysis. 2022. https://www.ema.europa.eu/en/documents/scientific-guideline/ich-guideline-m10-bioanalytical-method-validation-step-5_en.pdf. (accessed 2026-02-11).
18. Food and Drug Administration (FDA). Bioanalytical method validation - Guidance for Industry. 2018. https://www.fda.gov/files/drugs/published/Bioanalytical-Method-Validation-Guidance-for-Industry.pdf. (accessed 2026-02-11).
19. Scherer, G.; Mütze, J.; Pluym, N.; Scherer, M. Assessment of nicotine delivery and uptake in users of various tobacco/nicotine products. Curr. Res. Toxicol. 2022, 3, 100067.
20. Scherer, G.; Scherer, M.; Mütze, J.; Hauke, T.; Pluym, N. Assessment of the exposure to tobacco-specific nitrosamines and minor tobacco alkaloids in users of various tobacco/nicotine products. Chem. Res. Toxicol. 2022, 35, 684-93.
21. Pluym, N.; Gilch, G.; Scherer, G.; Scherer, M. Analysis of 18 urinary mercapturic acids by two high-throughput multiplex-LC-MS/MS methods. Anal. Bioanal. Chem. 2015, 407, 5463-76.
22. Scherer, G.; Newland, K.; Papadopoulou, E.; Minet, E. A correlation study applied to biomarkers of internal and effective dose for acrylonitrile and 4-aminobiphenyl in smokers. Biomarkers 2014, 19, 291-301.
23. Jaffé, M. On the precipitation produced by picric acid in normal urine and on a new reaction of creatinine (in Germany). 1886.
24. Benowitz, N. L.; Nardone, N.; Jain, S.; et al. Comparison of urine 4-(methylnitrosamino)-1-(3)pyridyl-1-butanol and cotinine for assessment of active and passive smoke exposure in urban adolescents. Cancer. Epidemiol. Biomarkers. Prev. 2018, 27, 254-61.
25. Bendik, P. B.; Rutt, S. M.; Pine, B. N.; et al. Anabasine and anatabine exposure attributable to cigarette smoking: National Health and Nutrition Examination Survey (NHANES) 2013-2014. Int. J. Environ. Res. Public. Health. 2022, 19, 9744.
26. Tavares, R.; Borba, H.; Monteiro, M.; et al. Monitoring of exposure to acrylonitrile by determination of N-(2-cyanoethyl)valine at the N-terminal position of haemoglobin. Carcinogenesis 1996, 17, 2655-60.
27. Maga, M.; Janik, M. K.; Wachsmann, A.; et al. Influence of air pollution on exhaled carbon monoxide levels in smokers and non-smokers. A prospective cross-sectional study. Environ. Res. 2017, 152, 496-502.
28. Castleden, C. M.; Cole, P. V. Carboxyhaemoglobin levels of smokers and non-smokers working in the City of London. Br. J. Ind. Med. 1975, 32, 115-8.
29. Benowitz, N. L.; Hukkanen, J.; Jacob, P. Nicotine chemistry, metabolism, kinetics and biomarkers. In Nicotine psychopharmacology. Henningfield, J. E.; London, E. D.; Pogun, S.; Eds; Berlin: Springer Berlin Heidelberg, 2009; pp. 29-60.
30. Campo, L.; Polledri, E.; Bechtold, P.; et al. Determinants of active and environmental exposure to tobacco smoke and upper reference value of urinary cotinine in not exposed individuals. Environ. Res. 2016, 148, 154-63.
31. Edwards, K. C.; Naz, T.; Stanton, C. A.; et al. Urinary cotinine and cotinine + trans-3'-hydroxycotinine (TNE-2) cut-points for distinguishing tobacco use from nonuse in the United States: PATH study (2013-2014). Cancer. Epidemiol. Biomarkers. Prev. 2021, 30, 1175-84.
32. Kim, S. Overview of cotinine cutoff values for smoking status classification. Int. J. Environ. Res. Public. Health. 2016, 13, 1236.
33. Paci, E.; Pigini, D.; Bauleo, L.; Ancona, C.; Forastiere, F.; Tranfo, G. Urinary cotinine concentration and self-reported smoking status in 1075 subjects living in central Italy. Int. J. Environ. Res. Public. Health. 2018, 15, 804.
34. Park, E. Y.; Lim, M. K.; Park, E.; Kim, Y.; Lee, D.; Oh, K. Optimum urine cotinine and NNAL levels to distinguish smokers from non-smokers by the changes in tobacco control policy in Korea from 2008 to 2018. Nicotine. Tob. Res. 2022, 24, 1821-8.
35. Piller, M.; Gilch, G.; Scherer, G.; Scherer, M. Simple, fast and sensitive LC-MS/MS analysis for the simultaneous quantification of nicotine and 10 of its major metabolites. J. Chromatogr. B. Analyt. Technol. Biomed. Life. Sci. 2014, 951-2, 7-15.
36. CORESTA Reports. Meta-analysis study to establish baseline levels of COHb and NEQs in smokers and non-smokers. 2019. https://www.coresta.org/meta-analysis-study-establish-baseline-levels-cohb-and-neqs-smokers-and-non-smokers-33007.html. (accessed 2026-02-11).
37. Jacob, P. 3rd; Yu, L.; Shulgin, A. T.; Benowitz, N. L. Minor tobacco alkaloids as biomarkers for tobacco use: comparison of users of cigarettes, smokeless tobacco, cigars, and pipes. Am. J. Public. Health. 1999, 89, 731-6.
38. Xia, B.; Blount, B. C.; Guillot, T.; et al. Tobacco-specific nitrosamines (NNAL, NNN, NAT, and NAB) exposures in the US Population Assessment of Tobacco and Health (PATH) Study Wave 1 (2013-2014). Nicotine. Tob. Res. 2021, 23, 573-83.
39. Colsoul, M. L.; Goderniaux, N.; Onorati, S.; et al. Novel proposed cutoff values for anatabine and anabasine in differentiating smokers from non-smokers. Clin. Biochem. 2023, 116, 128-31.
40. Suh-Lailam, B. B.; Haglock-Adler, C. J.; Carlisle, H. J.; Ohman, T.; McMillin, G. A. Reference interval determination for anabasine: a biomarker of active tobacco use. J. Anal. Toxicol. 2014, 38, 416-20.
41. Luo, X.; Carmella, S. G.; Chen, M.; et al. Urinary cyanoethyl mercapturic acid, a biomarker of the smoke toxicant acrylonitrile, clearly distinguishes smokers from nonsmokers. Nicotine. Tob. Res. 2020, 22, 1744-7.
42. Camacho, O. M.; Hedge, A.; Lowe, F.; et al. Statistical analysis plan for “A randomised, controlled study to evaluate the effects of switching from cigarette smoking to using a tobacco heating product on health effect indicators in healthy subjects”. Contemp. Clin. Trials. Commun. 2020, 17, 100535.
43. Scherer, G. Carboxyhemoglobin and thiocyanate as biomarkers of exposure to carbon monoxide and hydrogen cyanide in tobacco smoke. Exp. Toxicol. Pathol. 2006, 58, 101-24.
44. Sánchez Fernández, C.; Girón Matute, W. I.; Zichen, J.; et al. Correlation between blood carboxyhemoglobin levels and smoking. Eur. Respir. J. 2022, 60, 3618.
45. Whincup, P.; Papacosta, O.; Lennon, L.; Haines, A. Carboxyhaemoglobin levels and their determinants in older British men. BMC. Public. Health. 2006, 6, 189.
46. Pojer, R.; Whitfield, J. B.; Poulos, V.; Eckhard, I. F.; Richmond, R.; Hensley, W. J. Carboxyhemoglobin, cotinine, and thiocyanate assay compared for distinguishing smokers from non-smokers. Clin. Chem. 1984, 30, 1377-80.
48. Wang, Y.; Wong, L. Y.; Meng, L.; et al. Urinary concentrations of monohydroxylated polycyclic aromatic hydrocarbons in adults from the U.S. Population Assessment of Tobacco and Health (PATH) Study Wave 1 (2013-2014). Environ. Int. 2019, 123, 201-8.
49. Li, Z.; Romanoff, L.; Bartell, S.; et al. Excretion profiles and half-lives of ten urinary polycyclic aromatic hydrocarbon metabolites after dietary exposure. Chem. Res. Toxicol. 2012, 25, 1452-61.
Cite This Article
How to Cite
Download Citation
Export Citation File:
Type of Import
Tips on Downloading Citation
Citation Manager File Format
Type of Import
Direct Import: When the Direct Import option is selected (the default state), a dialogue box will give you the option to Save or Open the downloaded citation data. Choosing Open will either launch your citation manager or give you a choice of applications with which to use the metadata. The Save option saves the file locally for later use.
Indirect Import: When the Indirect Import option is selected, the metadata is displayed and may be copied and pasted as needed.
About This Article
Special Topic
Copyright

Data & Comments
Data
0


Comments
Comments must be written in English. Spam, offensive content, impersonation, and private information will not be permitted. If any comment is reported and identified as inappropriate content by OAE staff, the comment will be removed without notice. If you have any queries or need any help, please contact us at [email protected].