


fig2
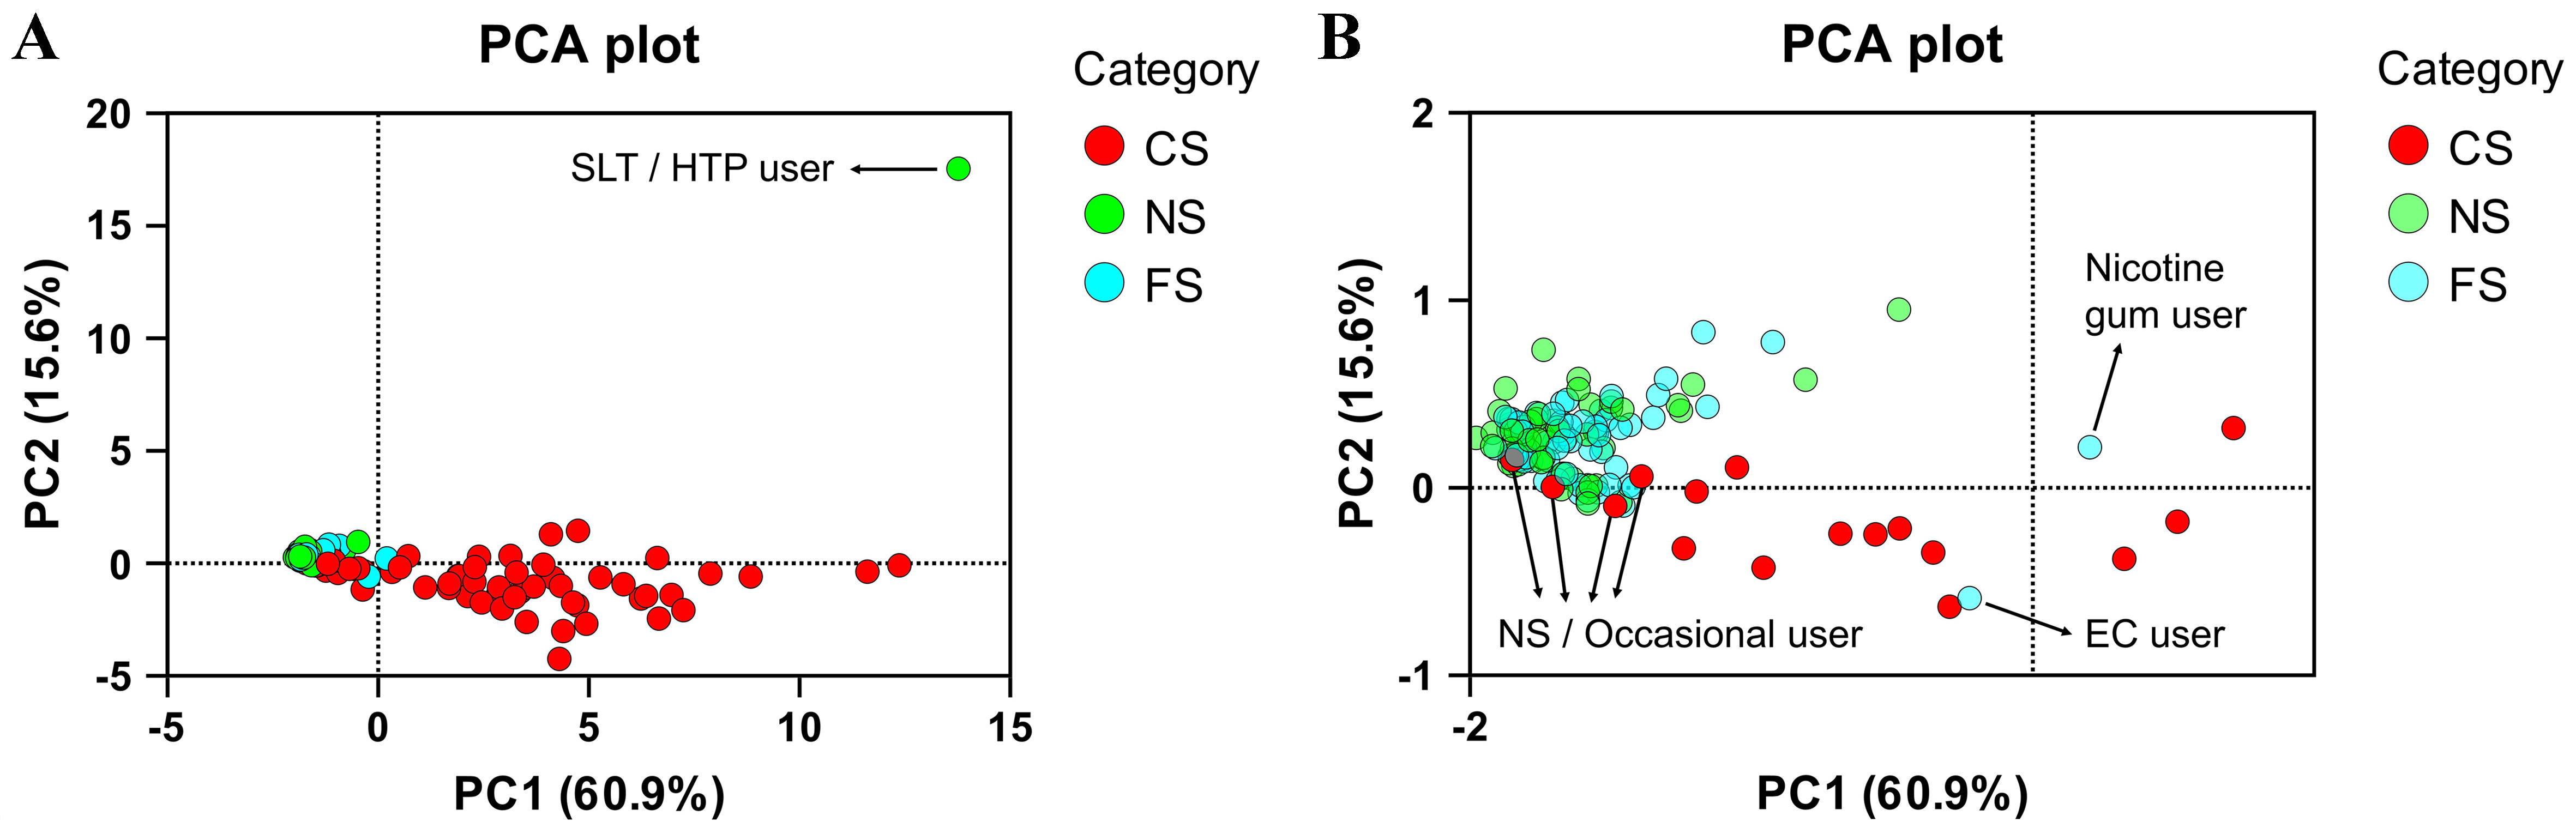
Figure 2. PCA plot of the study participants based on the BoEs. Six non-compliant subjects and one nicotine gum user are indicated in (A) the full PCA plot and (B) a zoomed-in PCA plot for clearer illustration of non-compliant participants. Figure created using GraphPad Prism, version 10. PCA: Principal component analysis; BoEs: biomarkers of exposure; SLT: smokeless tobacco; HTP: heated tobacco product; CS: current smokers; NS: never smokers; FS: former smokers; EC: electronic cigarette.


