


fig4
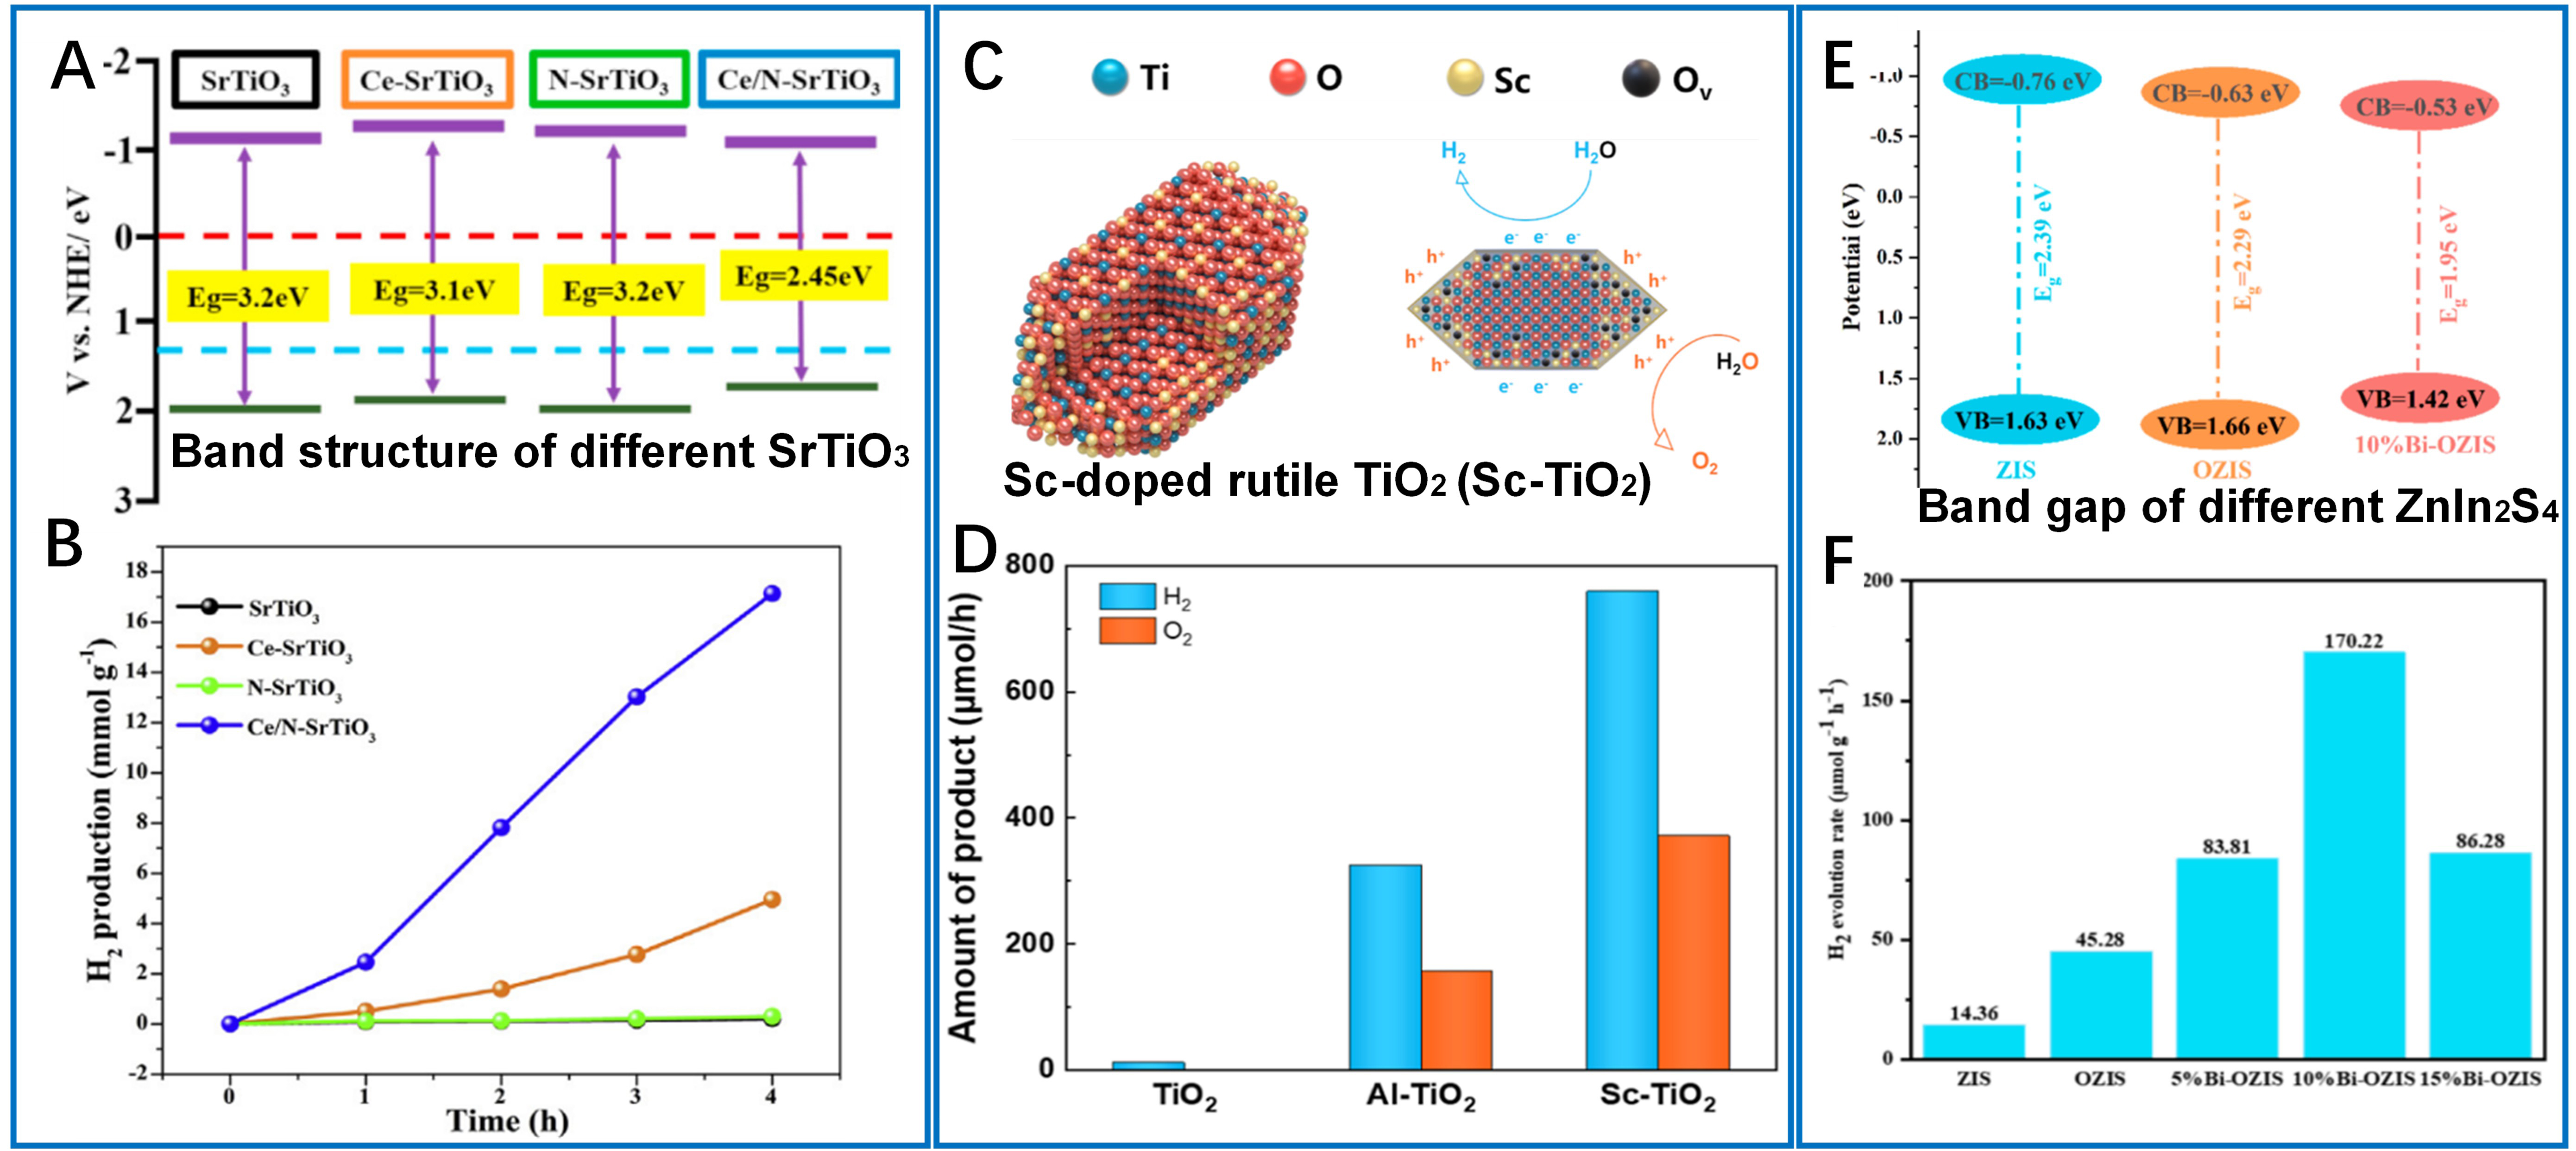
Figure 4. Metal ions-enhanced photocatalytic hydrogen production. (A) The VBM and CBM positions for different SrTiO3 samples; (B) Photocatalytic hydrogen evolution of SrTiO3 samples with irradiation time. These two figures are quoted with permission from Wang et al. Copyright (2022) Elsevier Ltd[68]; (C) Spontaneous exciton dissociation in Sc-doped rutile TiO2 for photocatalytic overall water splitting; (D) Comparison of hydrogen and oxygen evolution rates for photocatalytic overall water splitting over Pt cocatalyst modified with Sc-TiO2, Al-TiO2, and undoped TiO2. These two figures are quoted with permission from Qin et al. Copyright (2025) American Chemical Society[39]; (E) Band structure of ZIS, OZIS and 10%Bi-OZIS; (F) H2 yield over each sample. These two figures are quoted with permission from Tang et al. Copyright (2025) Elsevier Ltd[70]. VBM: Valence band maximum; CBM: conduction band minimum; ZIS: ZnIn2S4; OZIS: oxygen-doped ZnIn2S4.


