

Top-down synthesis of three-dimensional ABO3-type perovskite oxides with rich grain boundaries and lattice defects for molecular oxygen activation in catalytic oxidation reactions
 0
0 
Abstract
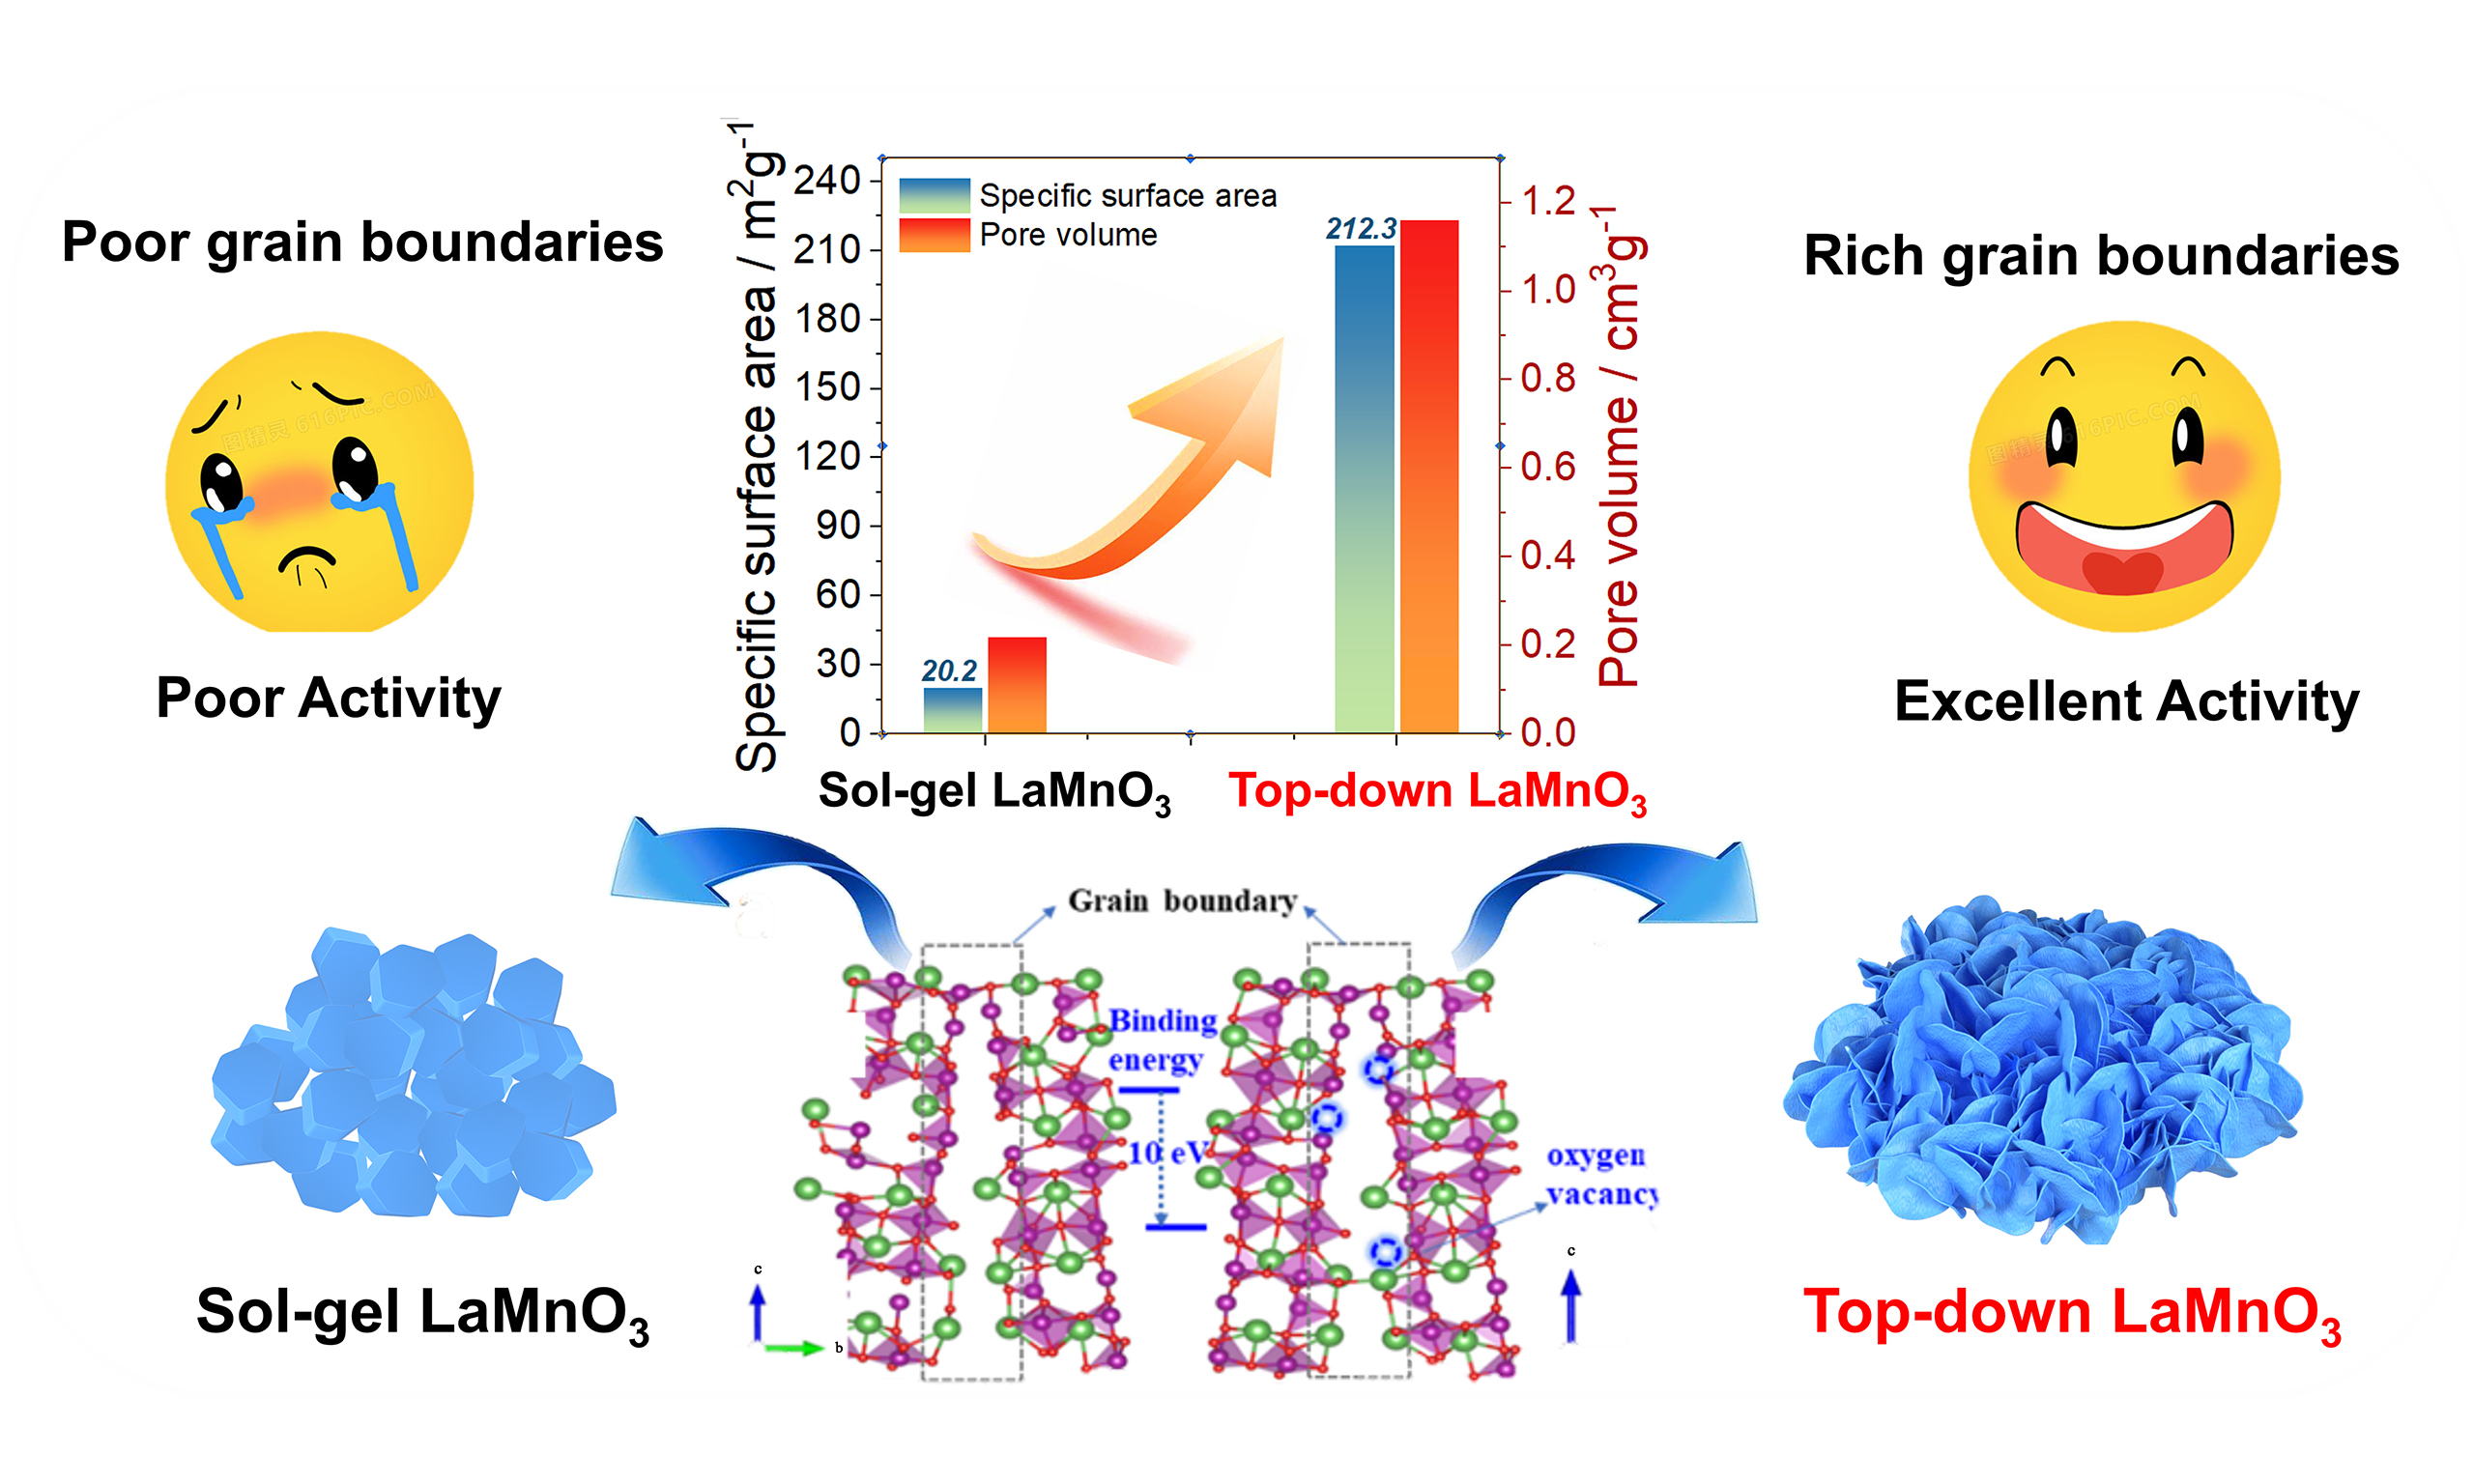
Perovskite oxides are potential materials that can replace noble metals for industrial catalysis. However, the high temperature (> 700 °C) required in the preparation process causes the lack of low-coordinated defect sites that are essential for catalytic reactions. To this end, herein we develop a top-down strategy to synthesize ABO3-type perovskite, by selectively etching the non-perovskite unit of a Ruddlesden-Popper (R-P) compound. The etching treatment not only promotes the formation of stable, three-dimensional reticular structure composed of nanosheets, but also generates rich amounts of grain boundaries and lattice defects, altering the electronic and surface properties. The LaMnO3, obtained by etching the La-O unit of R-P La3Mn2O7, exhibits not only enriched grain boundaries and lattice defects, but also excellent surface hydrophobicity. Moreover, the material possesses surface area of up to 212.3 m2/g, which is the highest value for perovskite oxides reported in literature, to the best of our knowledge. Owing to these exciting properties, the LaMnO3 shows prominent catalytic performances for oxygen involved oxidation reactions, including the full oxidation of volatile organic compounds and partial oxidation of alcohols, with stable activity and strong resistance to water. These results suggest that the top-down strategy is a promising method for synthesizing ABO3-type perovskites and could be a driving force to promote their progress for industrial catalysis.
Keywords
INTRODUCTION
ABO3-type perovskite oxides with stable structure, alterable ionic compositions, good redox properties, and low prices have been reported to be potential alternatives to noble metals for catalysis use[1-4]. They can be applied to various catalytic reactions, e.g., chemicals synthesis[5-7], pollutant treatment[8-10], and electrochemical reduction[11-15]. However, the high synthesis temperature (normally above 700 °C) greatly challenges their catalytic efficiency, as this inevitably causes severe particle aggregations, low surface area, and ordered lattice structure that are disadvantageous for catalysis, which belongs to a type of surface reactions[16-19].
Conventional synthesis of perovskite oxides predominantly adheres to a “bottom-up” paradigm, wherein simple oxides (e.g., La2O3, MnO2) undergo high-temperature solid-state reactions or solution-phase processing to form complex ABO3 structures. A typical example is the sol-gel method, which involves dissolving metal precursors (e.g., nitrates or alkoxides) in a solvent, followed by hydrolysis and polycondensation to form a gel network. Subsequent calcination at temperatures above 700 °C promotes the conversion of simple oxides into compound oxides with perovskite structure[20]. While this approach ensures stoichiometric control and phase purity, the requisite thermal energy input inevitably triggers particle agglomeration, resulting in densely aggregated microstructures with limited surface area (< 20 m2/g) and poorly defined morphologies. Such characteristics are inherently disadvantageous for catalysis, where high surface-to-volume ratios and accessible active sites are paramount.
Similar limitations exist in other bottom-up strategies. The co-precipitation method, for example, relies on simultaneous precipitation of metal hydroxides from aqueous solutions, followed by high-temperature decomposition to yield perovskites[21]. Although this method offers scalability, precise control over nucleation kinetics remains challenging, thus often causing varied particle size distributions. Hydrothermal synthesis, conducted in autoclaves under elevated temperature and pressure, enables the formation of nanoscale perovskites with improved surface areas[22]. However, the confined reaction environment restricts defect engineering and fails to mitigate lattice ordering, which is a critical drawback for redox-active catalysts requiring dynamic surface reconstruction during operation.
Compared to other bottom-up approaches, the template method has emerged as a promising route for modulating perovskite morphology[23]. By employing high-surface-area scaffolds such as zeolites or mesoporous silica, precursor ions are confined within nanoscale pores during assembly, enabling the synthesis of nanostructured perovskites with enhanced surface areas (e.g., 50-150 m2/g)[24-27]. Nevertheless, this strategy introduces inherent compromise: post-synthesis template removal via calcination or chemical etching often degrades structural integrity, while residual template fragments (e.g., silica) may poison active sites or alter surface chemistry. Additionally, the rigid framework of templates like zeolites limits the flexibility in tailoring defect density and grain boundaries, which are critical for catalytic activity. These limitations underscore a fundamental challenge in bottom-up synthesis strategy.
ABO3-type perovskite oxides have emerged as promising alternatives to noble metals in catalysis due to their tunable compositions and redox properties. However, conventional methods (e.g., sol-gel) require high-temperature calcination (> 700 °C), which inevitably leads to particle aggregation, low surface area, and ordered lattice structures detrimental to surface-mediated reactions. To address these limitations, we propose a novel “top-down” strategy that bypasses high-temperature processing. This approach aims to construct ABO3 perovskites with enriched grain boundaries, lattice defects, and high surface area by selectively etching non-perovskite units from materials with more complicated structures, e.g., Ruddlesden-Popper (R-P) structures. We hypothesize that such structural modifications will significantly enhance its ability for oxygen activation and catalytic performance in oxidation reactions.
To illuminate the priority of perovskite oxides prepared by the “top-down” strategy for catalysis use, we used LaMnO3 perovskite as an objective material and tested its performances for complete oxidation of ethyl acetate (EA) and partial oxidation of benzyl alcohol (BzOH), both of which use molecular oxygen as an oxidant. Various apparatuses were applied to characterize LaMnO3 prepared by different methods, to differentiate the physicochemical properties between them, such as the morphology, the grain boundary, the oxygen defects, the redox ability, etc., which were then correlated to the catalytic activities for EA and BzOH oxidation. The results showed that the LaMnO3 prepared by the top-down strategy exhibits significantly enhanced activities for the reactions, due to its superiorities in grain boundaries, surface area, oxygen defects, and so on, which are favorable for oxygen activation. This is also verified by the density functional theory calculation. Further investigations indicated that the material not only displayed excellent activity for the reactions, but also exhibited good stability and showed strong resistance to water poisoning. Finally, a mechanism for EA oxidation was proposed to reveal the reaction process and the possible intermediates.
EXPERIMENTAL
Chemicals and Reagents. La(NO3)3·6H2O, 50 wt% Mn(NO3)2, ethylene glycol, methanol and NH4HCO3 were obtained from Innochem Technology Co., Ltd. (Beijing, China); MnCl2 was purchased from Xinta Chemical Factory of Jinshan County (Shanghai, China); citric acid was supplied by Aladdin Biochemical Technology Co., Ltd. (Shanghai, China); nitric acid was obtained from Shantou Dahu Fine Chemical Co., Ltd. (Guangdong, China).
Catalyst preparation
Preparation of LaMnO3 (LMO-S) by conventional sol-gel method
The LMO-S was synthesized by a traditional sol-gel method[28]. Stoichiometric amounts of La(NO3)3·6H2O (0.002 mol) and 50 wt% Mn(NO3)2 aqueous solution (0.002 mol) were dissolved in a mixture of ethylene glycol (3 mol) and methanol (2 mol). The mixture was stirred thoroughly in a water bath at 70 °C for 6 h at a stirring rate of 1,000 rpm to form a gel, and then the gel was dried at 100 °C overnight. The resulting solid was calcined in a muffle furnace at 700 °C for 5 h (heating rate of 1 °C/min).
Preparation of R-P La3Mn2O7 oxide
The layered La3Mn2O7 was synthesized by a sol-gel modification method reported by Du et al.[29]. Briefly, La(NO3)3·6H2O (0.006 mol), 50 wt% Mn(NO3)2 aqueous solution (0.003 mol) and MnCl2 (0.001 mol) were dissolved in distilled water (20 mL) to obtain solution A. Then, citric acid (0.012 mol) and NH4HCO3
Preparation of LaMnO3 (LMO-E) by “top down” method
LaMnO3 with hierarchical dimensions (LMO-E) was synthesized through a novel “top-down” method. 1.0 g La3Mn2O7 was dispersed in 20 mL nitric acid (1 M) and stirred at room temperature for 1 h (25 °C, 1,000 rpm). The resulting sample was filtered and washed with deionized water, until the filtrate reached neutral pH = 7. The obtained solids were finally dried overnight at 130 °C to yield LMO-E. Note that optimization of the experimental conditions was conducted in order to obtain the satisfied product, as follows:
Concentration of nitric acid: Three concentrations (0.5, 1.0 and 2.0 M) were adopted to etch the La3Mn2O7 precursor, and the results showed that concentration of 0.5 M cannot completely remove the La-O unit, while concentration of 2.0 M causes deep corrosion of the precursor, resulting in few products. Concentration of 1.0 M can completely etch the La-O unit and the quantity of product is considerable; therefore, nitric acid is selected to be 1 M.
Etching temperature: Set the concentration of nitric acid at 1.0 M; the etching treatment was conducted at two temperature points: room temperature (25 °C) and 50 °C. Pure LaMnO3 with considerable yield was obtained at 25 °C. High temperature (50 °C) can accelerate the etching process but lead to excessive leaching of precursor and few products. Hence, the etching process was done at room temperature.
Etching time: Under the above two conditions, the etching process was done for 0.5, 1.0, and 1.5 h. The results showed that etching time of 0.5 h cannot completely convert La3Mn2O7 to LaMnO3 [as detected by X-ray diffraction (XRD)], and etching time of 1.5 h causes low surface area [as verified by Brunauer-Emmett-Teller (BET)]. Therefore, the etching time was selected to 1.0 h, at which pure LaMnO3 with high surface area (212.3 m2/g) was obtained.
Catalyst characterization
Powder XRD patterns were recorded on Ultima IV-type apparatus (Rigaku Corporation, Japan) with Cu Kα radiation
The Mn K-edge X-ray absorption fine structure (XAFS) spectra were collected at the BL14W1 beamline of the Shanghai Synchrotron Radiation Facility (SSRF) in fluorescence mode using a silicon drift detector. The incident X-ray energy was monochromatized by a Si (111) double-crystal monochromator and calibrated with a Mn foil reference. Each spectrum was averaged over three scans to improve the signal-to-noise ratio. Data processing and fitting were performed using the Athena and Artemis programs of the Demeter data analysis packages[30] that utilize the FEFF6 program[31] to fit the extended XAFS (EXAFS) data. The energy calibration was conducted through standard and Mn foil. A linear function was subtracted from the pre-edge region; then the edge jump was normalized using Athena software. The χ(k) data were isolated by subtracting a smooth, third-order polynomial approximating the absorption background of an isolated atom. The k3-weighted χ(k) data were Fourier transformed after applying a HanFeng window function
EA-temperature-programmed desorption mass spectrometry (TPD/MS) experiment was carried out on a fixed-bed instrument connected with an HPR-20 EGA Mass Spectrometer from the Hidden Analytical company, with m/z = 43 for EA and m/z = 44 for CO2. Hydrogen temperature-programmed reduction (H2-TPR) was conducted on a DAS-7000 instrument (Hunan Huasi Technology Company, China) equipped with a thermal conductivity detector. Firstly, a 100 mg sample was loaded into a fixed-bed quartz microreactor, pretreated in N2 (30 mL/min) at 300 °C for 1 h, and cooled to 40 °C. Then, the reductive gas containing 10 vol% H2 (balanced with N2) was switched on at a flow rate of 50 mL/min. After the baseline reached stability, the sample was heated at a ramp of 10 °C/min from 50 to 850 °C. O2 temperature-programmed desorption (O2-TPD) was performed on an AMI-300 instrument (Altamira Instruments Company) equipped with a thermal conductivity detector. Firstly, a 50 mg sample was loaded into a fixed-bed U-shaped quartz microreactor, pretreated in 20 vol% O2/N2 at 300 °C for 1 h, and cooled to 50 °C. Then, pure He at a flow rate of 30 mL/min was switched on, and after the baseline reached stability, the sample was heated at a ramp of 10 °C/min from 50 to 850 °C. The in-situ diffuse reflectance Fourier transform infrared spectra (in-situ DRIFTS) were acquired using a Thermo Nicolet iS50 Fourier transform infrared (FTIR) spectrometer equipped with a liquid nitrogen cooled mercury cadmium telluride (MCT) detector. First, the catalysts were purged with N2 for 1 h at 300 °C. Subsequently, the backgrounds were collected after the samples were cooled to room temperature. In-situ DRIFTS spectra were collected in flow streams of 1,000 ppm EA/20% O2/N2 at different temperatures.
Determination of catalytic activity
All the catalytic oxidation performance tests were carried out in a fixed bed quartz tube (i. d. 8 mm, length = 490 mm) at atmospheric pressure. First, 1.0 g of catalysts was put in the middle of the quartz tube and filled with silica wool at top and end of the catalyst. The reaction mixture containing 1,000 ppm of EA (or
The liquid-phase aerobic oxidation of benzyl alcohol was conducted in a 50 mL three-neck round-bottom flask at atmospheric pressure, containing 20 mL of toluene (solvent), 50 μL of benzyl alcohol, 50 μL of dodecane (internal standard), and 100 mg of catalysts. When the reaction temperature reached 50 °C, oxygen was bubbled into the solution at a flow rate of 50 mL/min to initiate the reaction. The entire reaction lasted for 3 h. At each 30-minute interval, 0.5 mL of aliquot was collected by filtration. The products were analyzed by gas chromatography (8890GC, Agilent, U.S.A.) equipped with a FID and HP-5 capillary column.
DFT calculations
The Materials Studio software was used to cut the optimized cells along the (310) and (-310) planes. Four layers of atomic thickness were stacked, and a 25 Å vacuum layer was added. This study’s first principal calculation is based on density functional theory using Vienna ab initio simulation package (VASP) software, where valence electron-ionic nucleus interactions are described by pseudopotentials, and electron wave functions at each K point are expanded according to a discrete plane wave basis set. The projector augmented wave (PAW) method was used in this study for more accurate calculations of some transition metals that cannot be well-described by ultra-soft pseudopotentials. In Perdew-Burke-Ernzerhof (PBE) function, commutative correlation terms in Kohn-Sham theory are treated with generalized gradient approximation. Truncation energy is set to 500 eV for optimization of geometric structure using force-based conjugate gradient algorithm with convergence standards of 0.01 eV/Å for force and 10-5 eV for energy. Due to actual calculation limitations, part of the supercell is intercepted with an additional 25 Å vacuum layer perpendicular to surface direction for subsequent valence analysis and adsorption model calculations. Gamma is selected as the K point during structure optimization while increasing it further to 2 × 2 × 1 during electronic structure calculation improves data reliability. To determine O2 adsorption position at LaMnO3 grain boundary, three parts comprise rough calculation: optimizing LaMnO3 surface structure completed previously; optimizing O2 molecule calculating bond length, angle, energy etc.; and comparing previous results in literature.
RESULTS AND DISCUSSION
Synthesis and characterization
Figure 1A presents the sketch of top-down method to yield three-dimensional (3D) LaMnO3 perovskite. Starting from a R-P La3Mn2O7 compound, we use nitric acid to selectively etch the La-O units to yield LaMnO3. The etching of La-O units results in the generation of bi-layer LaMnO3, which will self-assemble into ultrathin two-dimensional (2D) nanosheets, and finally interweave to a 3D reticular morphology, to stabilize the structure. During the self-assembly process, the random re-combination of nanosheets causes the mismatch of lattice frames and leads to the formation of grain boundaries, inducing unexpected properties. Moreover, the etching process also generates rich surface defects, causing Jahn-Teller distortion, shortening the Mn-Mn bond length, which is favorable for O2 activation. Because of these features, it is expected that the materials exhibit promising performances for oxidation reactions.
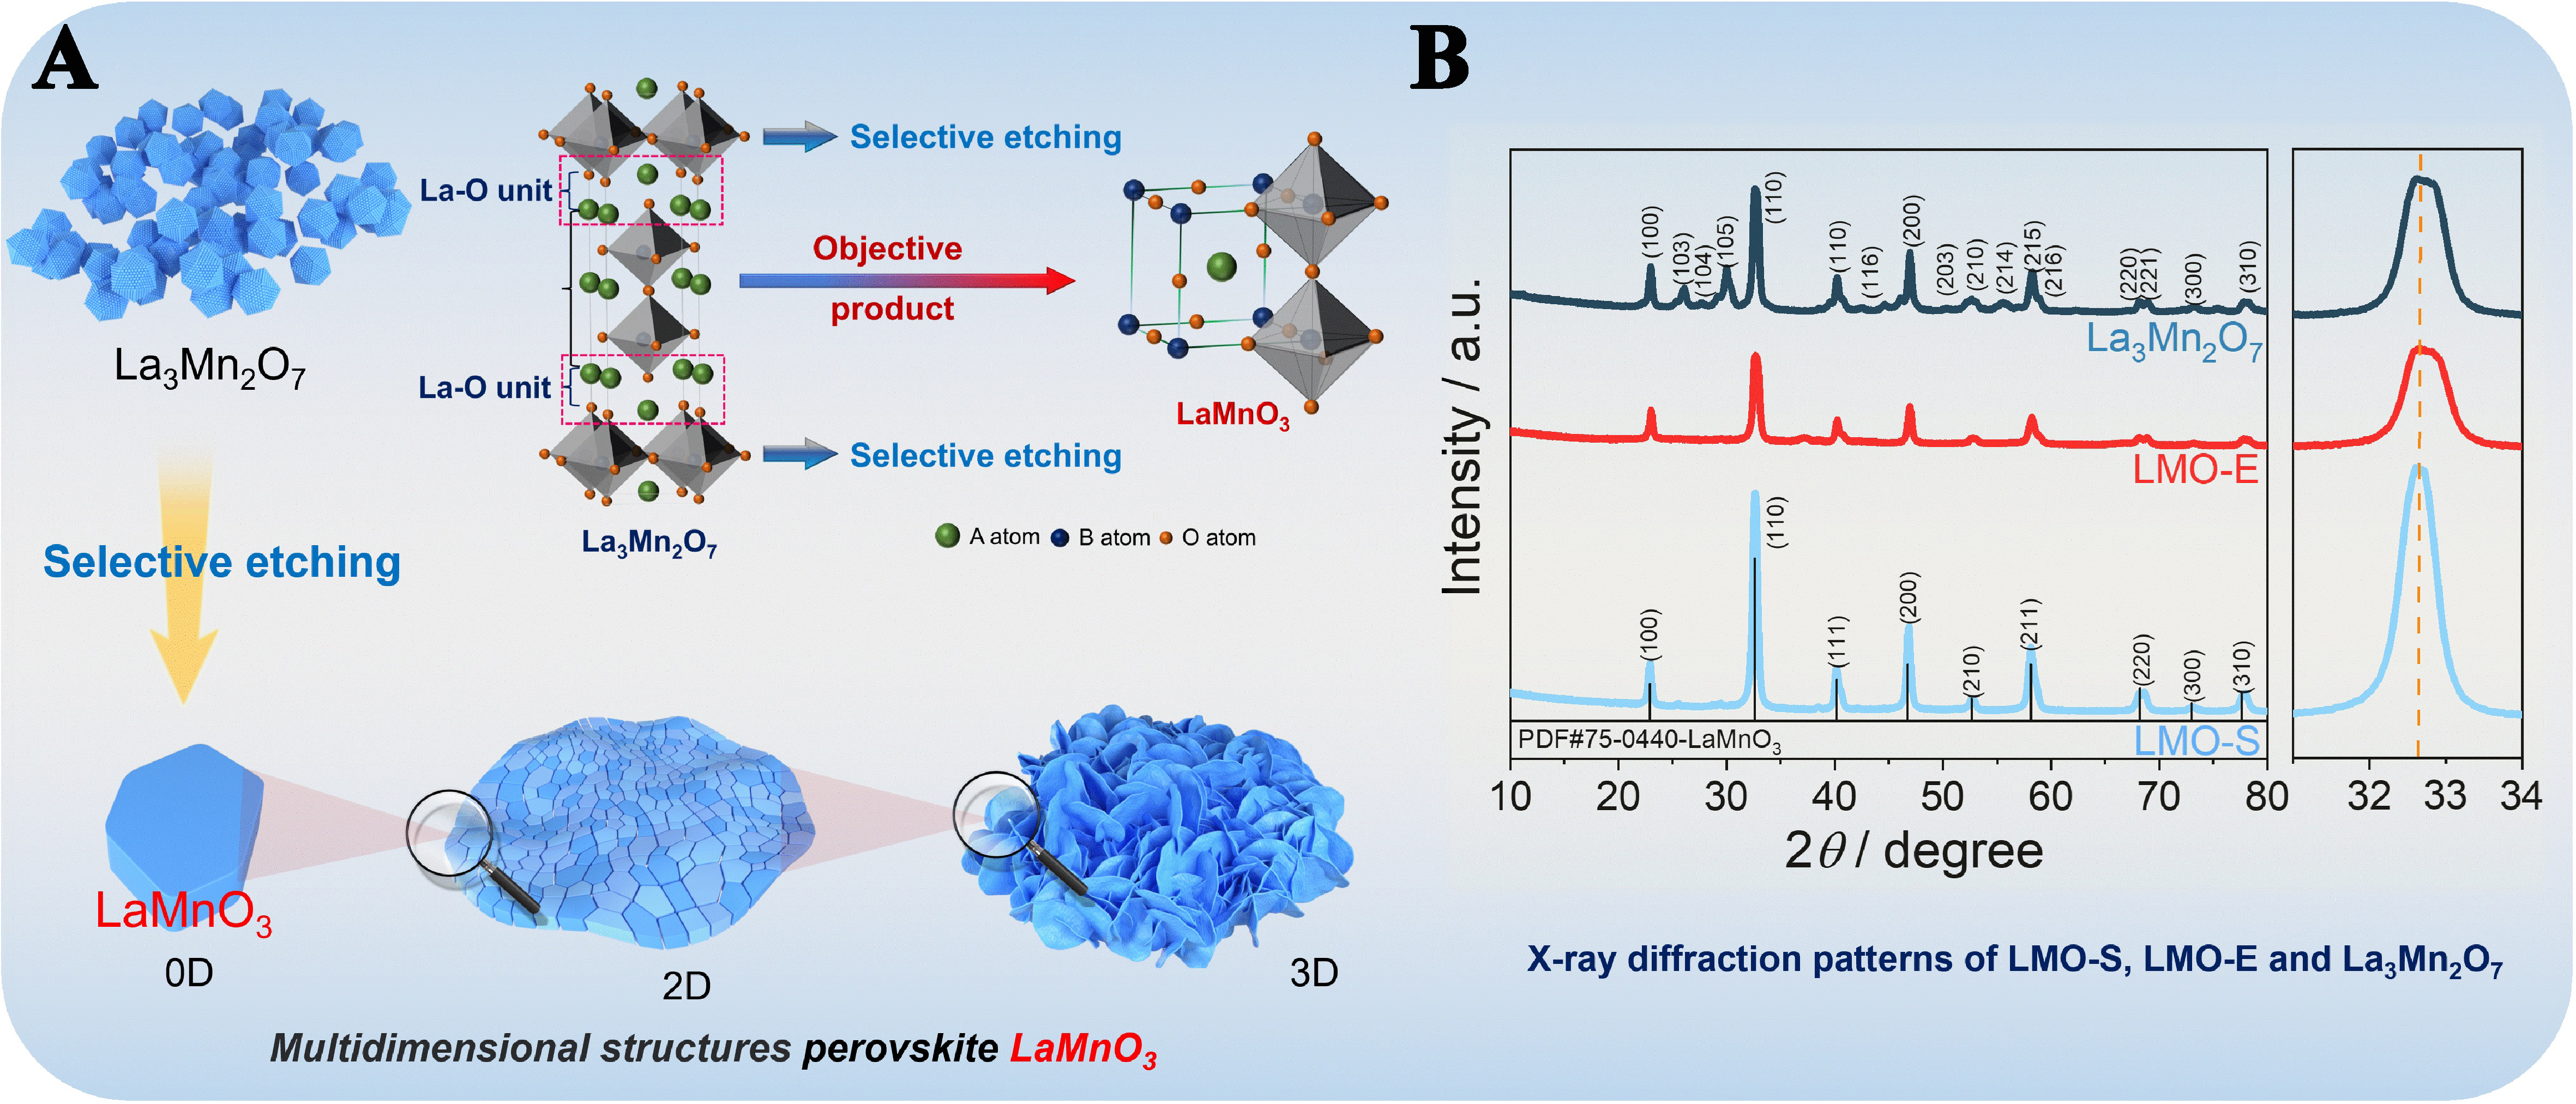
Figure 1. (A) Schematic diagram of the 3D-LaMnO3 prepared by “top-down” method and (B) XRD patterns of LMO-S, LMO-E and
The top-down synthesized LaMnO3 (denoted LMO-E) is obtained by selectively etching the La-O units of an R-P La3Mn2O7 material. For comparison, an extra LaMnO3 is prepared by sol-gel method and denoted as LMO-S. Detailed synthesis procedure and the materials’ characterizations are described in the Experimental section of the Supplementary Materials.
XRD patterns show that the precursor La3Mn2O7 has the R-P layered structure[29], and the product LMO-E forms a cubic LaMnO3 structure (PDF#75-0440) [Figure 1B]. This demonstrates that the treatment of
The generation of ionic defects in LMO-E is further confirmed by Raman and FTIR spectroscopy
It is worth noting that LaBO3 perovskites with various B-site metals (e.g., Fe, Co) can also be prepared with the same strategy, by selectively etching the corresponding R-P compounds [Supplementary Figure 3], suggesting that the top-down strategy is a generalized method and has wide applicability to prepare ABO3-type perovskites.
The morphologies of the materials are observed by SEM and TEM. Supplementary Figure 4 shows the SEM and TEM images of LMO-S and La3Mn2O7. These two catalysts present totally different morphologies. LMO-S displays severely aggregated particles, while La3Mn2O7 exhibits fluffier morphology with homogeneous particle dispersion.
In contrast, the TEM image of LMO-E shows a 3D flower-like morphology consisting of 2D nanosheets with a thickness of 3.5 nm [Figure 2A], which accords well with the height evaluated from the AFM images
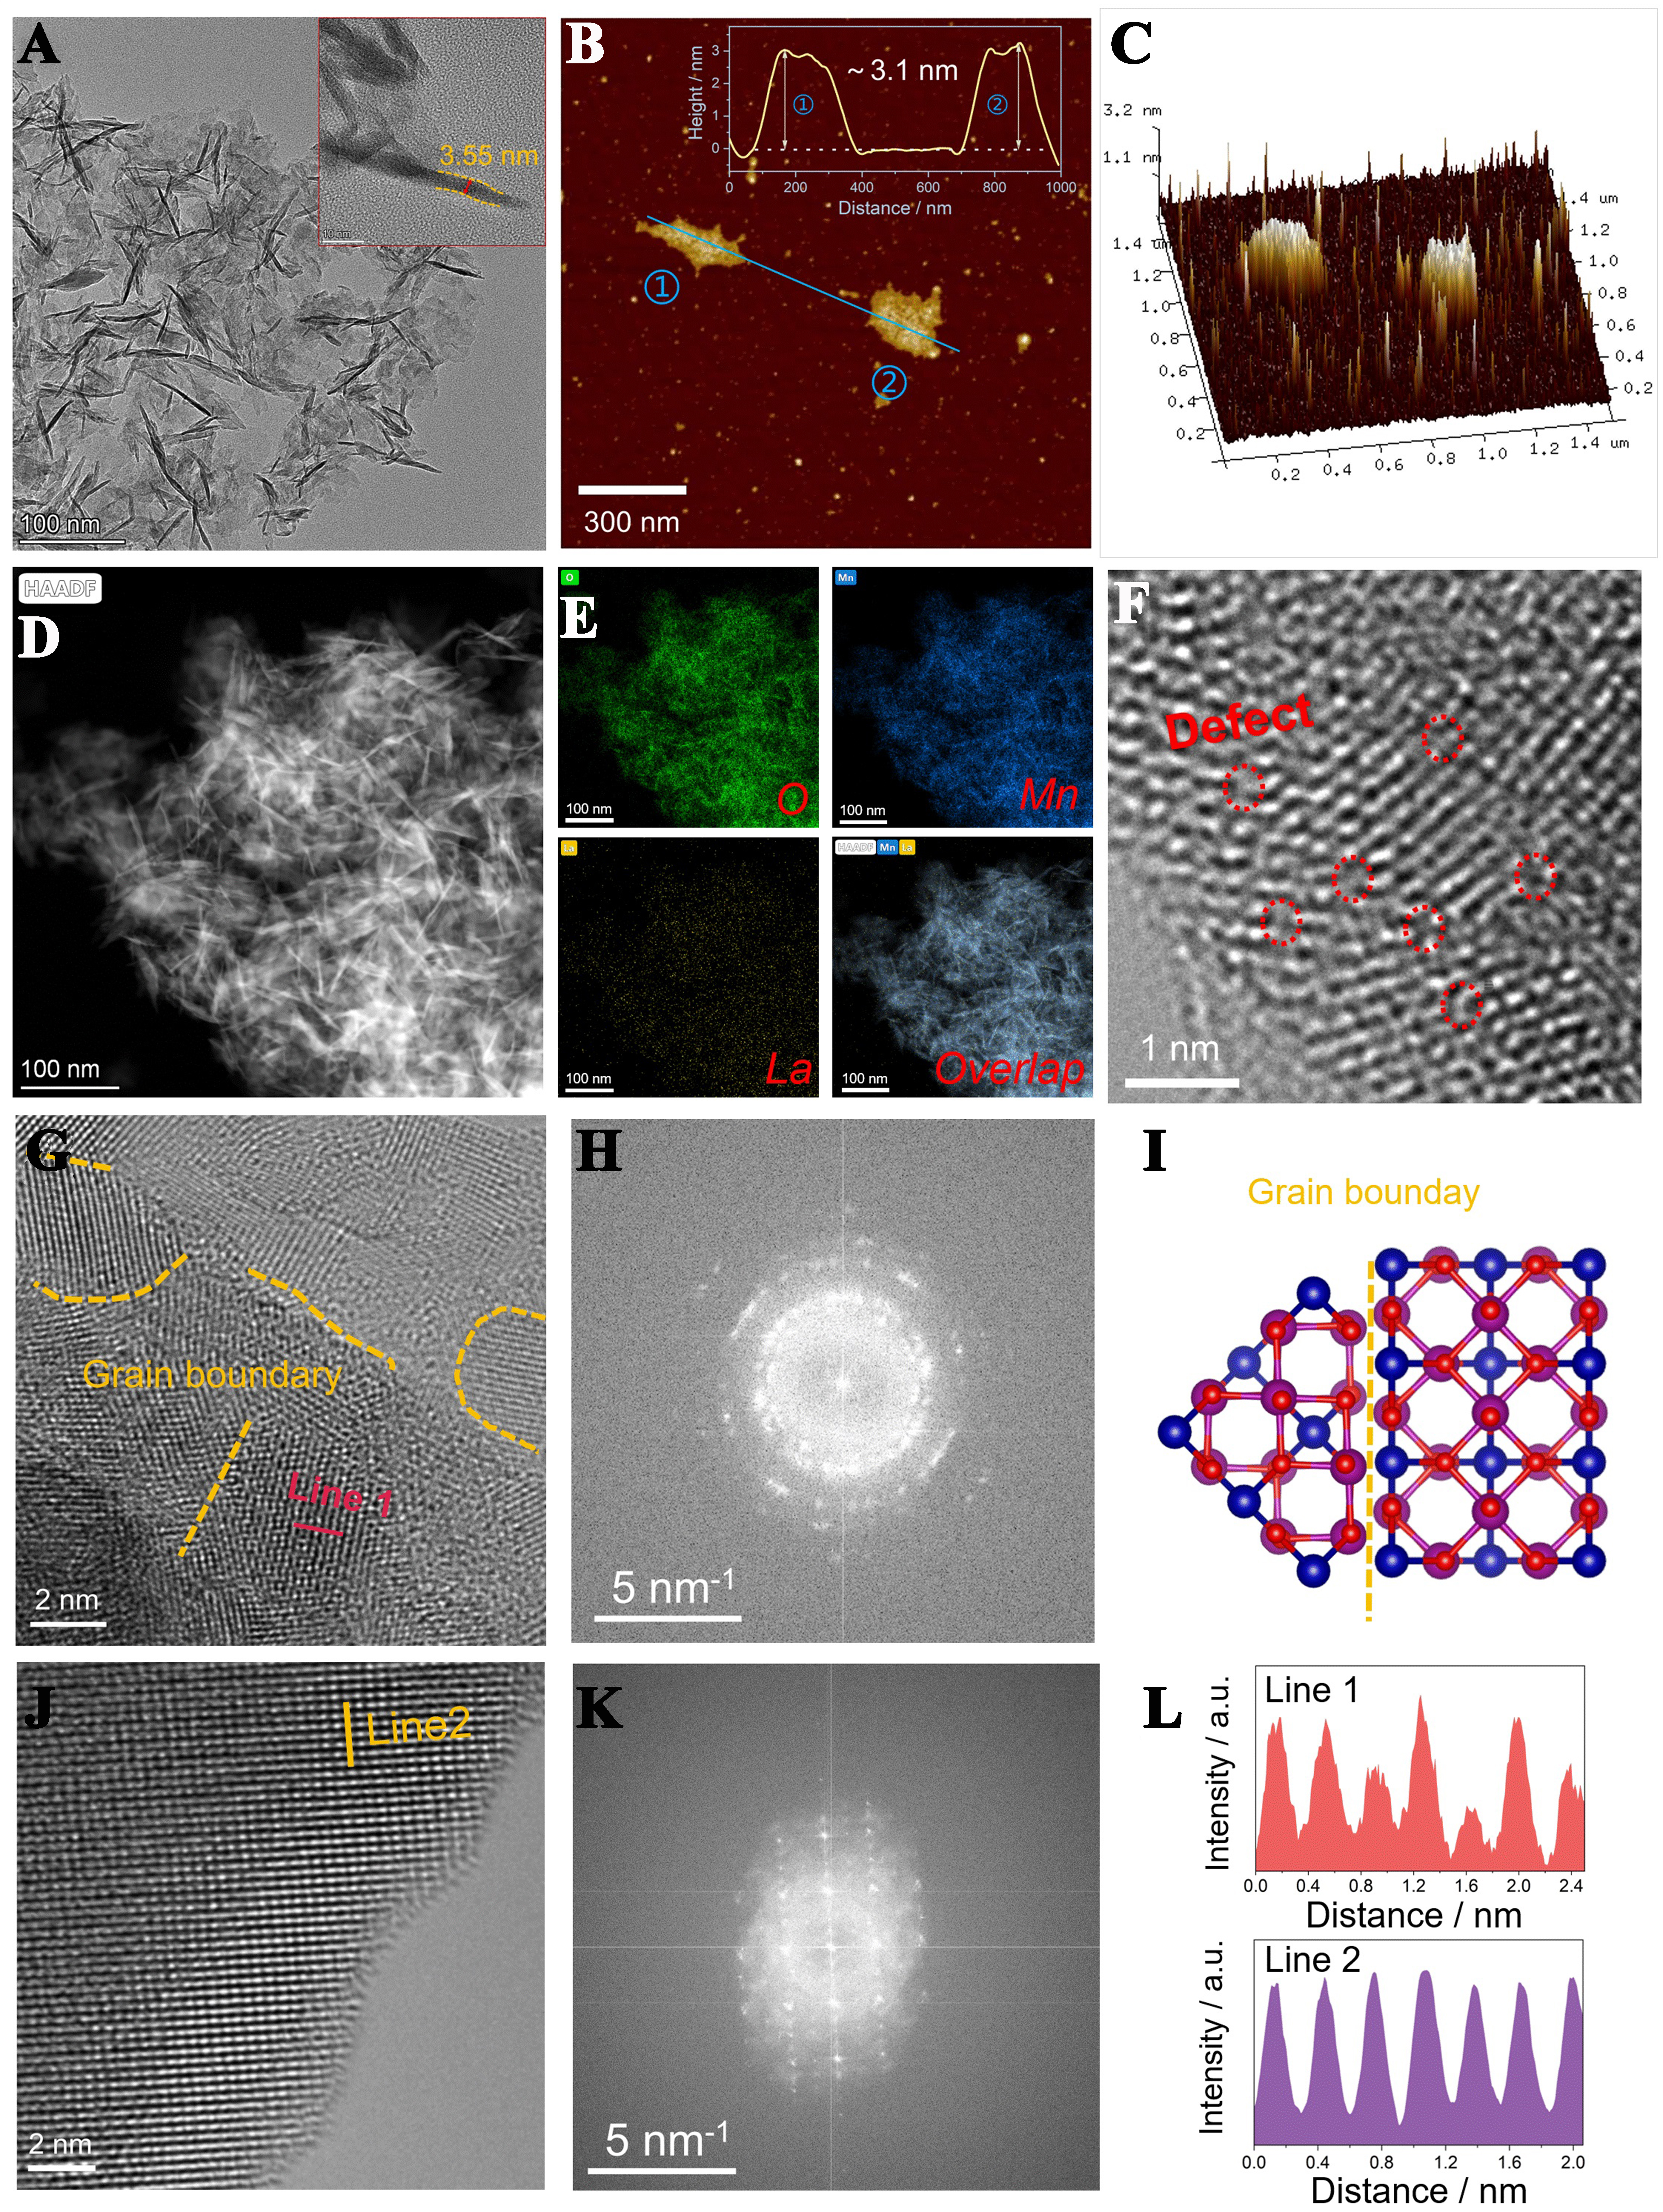
Figure 2. Surface morphology and microstructure of LaMnO3. (A) TEM, (B and C) AFM, (D and E) EDX mappings; (F-H) AC-HAADF STEM images and (I) imaged lattice distribution of the LMO-E. The blue, purple, and red spheres denote La, Mn, and O atoms, respectively; (J and K) AC-HAADF STEM images of the LMO-S; (L) Line intensity profiles of LMO-E and LMO-S. TEM: Transmission electron microscopy; AFM: atomic force microscopy; EDX: energy-dispersive X-ray spectroscope; AC-HAADF STEM: aberration-corrected high-angle-annular-dark-field scanning transmission electron microscopy; LMO-E: LaMnO3 prepared by the “top down” method; LMO-S: LaMnO3 prepared by the sol-gel method.
To confirm the interweavement of 2D nanosheets, the microstructure of LMO-E is probed by aberration-corrected high-angle-annular-dark-field scanning transmission electron microscopy (AC-HAADF STEM), which confirms that the 3D architecture is composed of plentiful nanosheets, with size of 3-10 nm, and various boundaries are formed between the nanosheets [Figure 2G]. This is also supported by the selected area electron diffraction (SAED) pattern of the sample [Figure 2H], which shows that the diffraction points are irregularly distributed, and the diffraction rings are ambiguous. Hence, it is concluded that the 3D architecture is composed of irregularly superposed nanosheets, as shown in Figure 2I.
For comparison, the AC-HAADF STEM image of LMO-S is also acquired, which shows that this material has intact and regular lattice fringes with long-range ordered atomic arrangement Figure 2J and K. Accordingly, the SAED pattern of LMO-S shows a clear diffraction point group, indicating a highly crystalline structure. Moreover, from the line profiles of LMO-E (Figure 2G, Line 1) and LMO-S (Figure 2J, Line 2) shown in Figure 2L, it is seen that the line intensity of LMO-E is irregular and chaotic, while the line intensity of LMO-S is uniform and strong. This supports that the LMO-E forms numerous grain boundaries with randomly distributed atomic arrangement, while the LMO-S forms regular atomic arrangement.
It has been reported that grain boundaries always consist of large areas of dangling bonds and exhibit unexpected properties[34]. For example, Shao et al. report that ionic migration is faster at the grain boundary than within the grain[35]. Royer et al. demonstrate that mass diffusion at the grain boundary proceeds quickly in comparison with that in bulk[36]. Therefore, it could be expected that the LMO-E, with numerous grain boundaries, exhibits good performances for mass adsorption and diffusion, benefiting the mass conversions in catalytic reactions.
Physicochemical properties
Because of the formation of grain boundaries and lattice defects, we compare the physicochemical properties of LMO-E with those of the traditional LMO-S. Firstly, we investigate the oxygen defect of the materials, which is a crucial property of perovskite oxide[37-39]. EPR results show that all samples exhibit a notable axial signal at around g = 2.004 that is contributed by the superoxide anion O2- species[40], and the signal intensity of LMO-E (56 a.u.) is far stronger than that of LMO-S (0.5 a.u.) and La3Mn2O7 (3 a.u.) [Figure 3A]. By comparison, the number of oxygen defects formed in LMO-E is 112 and 19 times higher than that in LMO-S and La3Mn2O7, respectively, suggesting that large amounts of oxygen defects are generated in LMO-E. The surface oxygen defect is generally believed to be the site for O2 activation and hence is especially concerned in oxidation reactions[41].
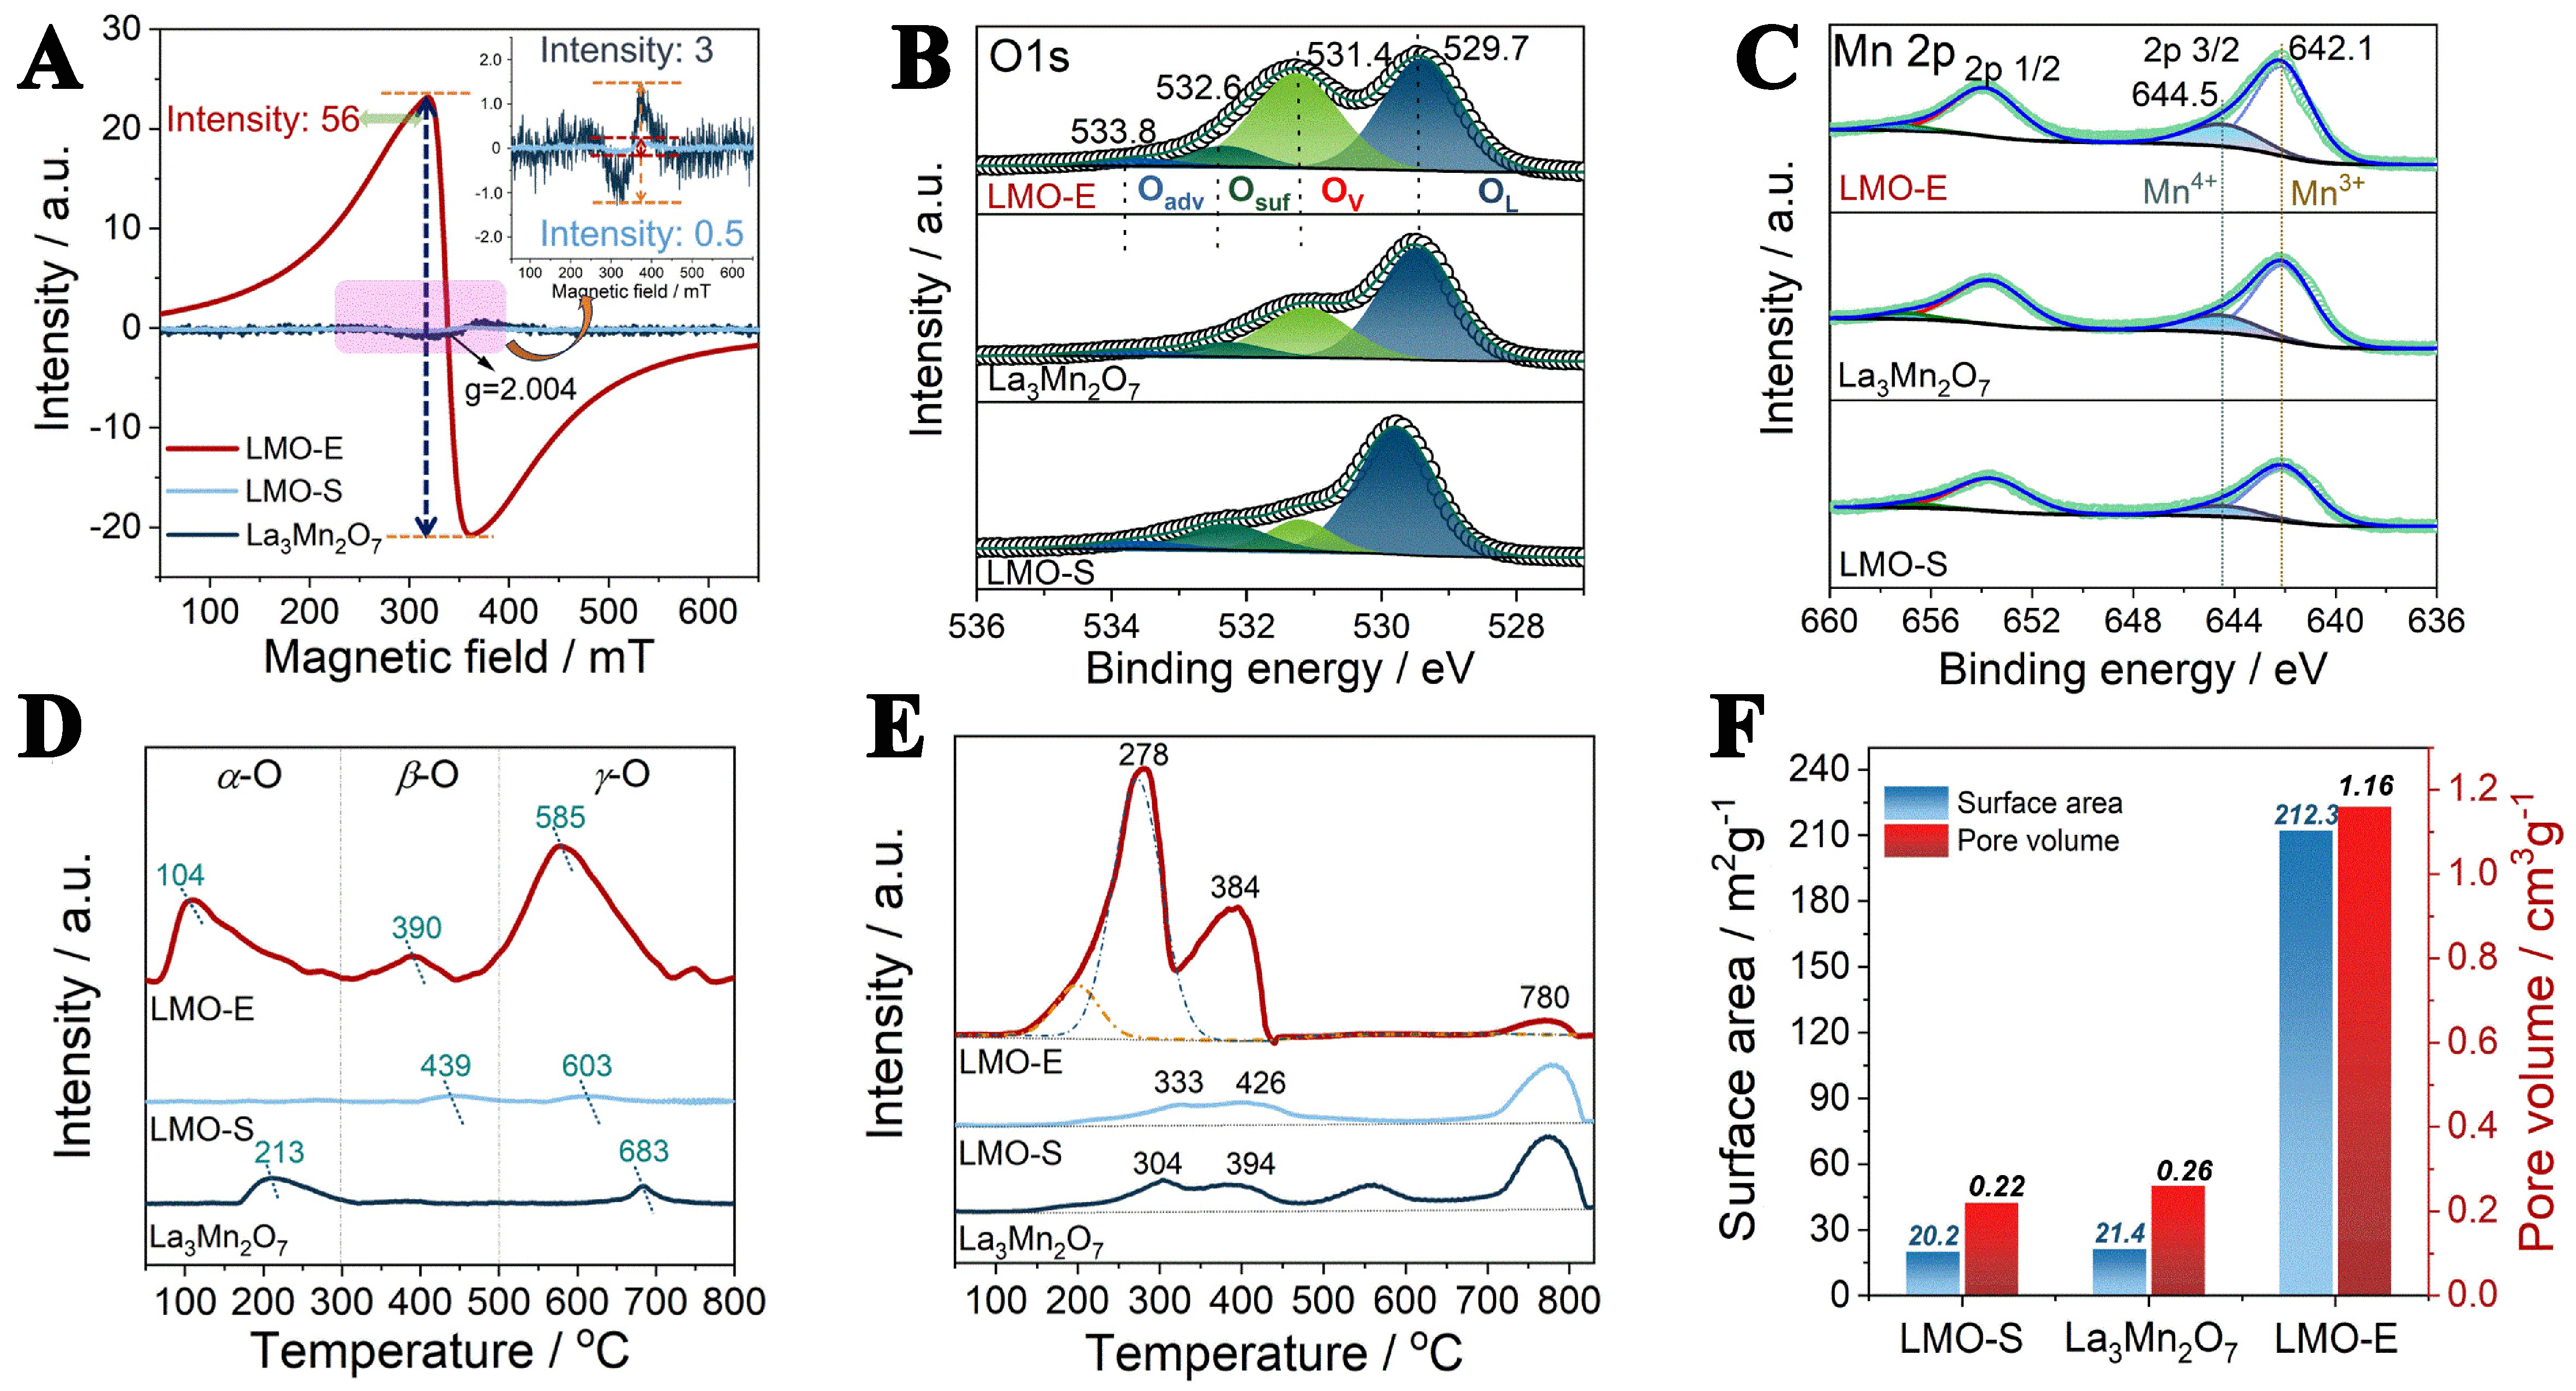
Figure 3. (A) EPR spectra, (B) O 1s and (C) Mn 2p XPS spectra, (D) O2-TPD profiles, (E) H2-TPR profiles, and (F) Histogram of surface area and pore volume of the LMO-E, La3Mn2O7 and LMO-S. EPR: Electron paramagnetic resonance; XPS: X-ray photoelectron spectroscopy; O2-TPD: O2 temperature-programmed desorption; H2-TPR: hydrogen temperature-programmed reduction; LMO-E: LaMnO3 prepared by the “top down” method; LMO-S: LaMnO3 prepared by the sol-gel method.
To verify the generation of oxygen defects and analyze the reasons, we perform the XPS measurement. The full-range XPS spectrum of the samples is shown in Supplementary Figure 6, which shows the presence of characteristic peaks attributed to La, Mn, O and C atoms. No characteristic peak attributed to N atom appears, suggesting that no nitrates are present in the sample. For the peak of C atom, it could originate from the adventitious carbon. These results confirm that no impurities are present in LMO-E prepared by the top-down method.
The fine XPS spectra of O 1s and Mn 2p are shown in Figure 3B and C, and the corresponding data are listed in Supplementary Table 2. The results show that the O 1s spectrum includes four deconvoluted peaks, with binding energy centering at 529.7, 531.4, 532.6 and 533.8 eV that attributed to lattice oxygen (OL), low oxygen-coordinated defects (Ov), surface oxygen (Osurf), and adsorbed oxygen (Oadv), respectively[12]. The percentage of Ov for LMO-E is 36.9%, which is much higher than those for La3Mn2O7 (23.9%) and LMO-S (17.7%) [Supplementary Table 3], in line with the EPR results. Analysis on Mn 2p spectra indicates the presence of Mn4+ (644.5 eV) and Mn3+ (642.1 eV) species[42], and the Mn4+/Mn3+ ratio calculated for LMO-E is 1.31, which is larger than that of La3Mn2O7 (1.13) and LMO-S (1.06). The La 3d XPS spectrum
The formation of oxygen defects in LMO-E is also confirmed by the temperature programmed desorption of oxygen (O2-TPD) profiles [Figure 3D], which show basically three regions (T < 300 °C, 300-500 °C and T > 500 °C) depending on the desorption temperature and are respectively attributed to the desorption of oxygen chemosorbed on the surface (marked as α-O), on the oxygen vacancies (marked as β-O), and that of the lattice oxygen (marked as γ-O)[44,45]. Overall, the LMO-E shows not only the largest peak area but also the lowest desorption temperature in each region, indicating that the oxygen species of LMO-E has larger amounts and is more active than that of LMO-S and La3Mn2O7. The large first desorption peak of LMO-E could be due to its large surface area, which enables it to have more opportunities to contact and adsorb oxygen. The second desorption peak can be attributed to its numerous oxygen vacancies, as verified by EPR and XPS results. The large third desorption peak suggests that the lattice oxygen of LMO-E is more active and is easier mobilized than that of LMO-S and La3Mn2O7, owing to the large amounts of La and O defects generated in the structure. The significant increase of oxygen species implies that the catalytic ability of LMO-E could be greatly improved for oxygen involved reactions.
The generation of La and O defects and the mismatch of lattice frames greatly affect the electronic configuration and thus the redox behaviors of the materials. In this respect, we evaluate the redox properties with H2-TPR measurement. Figure 3E displays the H2-TPR profiles of the samples. According to literature[46], the reduction of LaMnO3 mainly includes two stages: (1) Mn4+ → Mn3+ and (2) Mn3+ → Mn2+. Thus, the first reduction peak, containing a main peak at 278 °C and a shoulder peak at 384 °C for LMO-E, is attributed to the reduction of surface and bulk Mn4+ to Mn3+, respectively, and the second peak at 780 °C (for LMO-E) is attributed to the reduction of Mn3+ to Mn2+[47]. For the first reduction peak that reflects the reducibility of materials in the reaction, LMO-E shows larger peak area (H2 consumption: 9.31 mmol·g-1) and lower reduction temperature than LMO-S (H2 consumption: 2.43 mmol·g-1) and La3Mn2O7 (H2 consumption:
In addition, because of the formation of 2D nanosheets and the construction of 3D architecture, the LMO-E exhibits amazing surface area and pore volume, reaching 212.3 m2·g-1 and 1.16 cm3·g-1, which are ten and five times higher than those of LMO-S, respectively [Figure 3F and Supplementary Figure 8]. To the best of our knowledge, these are the highest values reported in literature for perovskite oxides. Hence, it is expected that the material exhibits exciting performances for catalysis, which belongs to a type of surface reaction, by increasing the contact efficiency with reactants.
To investigate the effects of surface defects on the structure from atomic level, the electronic configuration and coordination information of Mn species in LMO-E and LMO-S are studied with X-ray absorption near-edge structure (XANES) and EXAFS spectroscopy. The Mn adsorption edge position of LMO-E and LMO-S is located between that of Mn foil and MnO2 [Figure 4A], demonstrating that the valence of Mn in both samples is lower than +4. This is right as the Mn species of an ideal LaMnO3 is +3. The normalized Mn K-edge XANES spectra (inset of Figure 4A) show that with the increase of surface defects, the Mn K-edge and the white line gradually shift to higher energy, suggesting the increase of Mn valence. By comparison, LMO-E exhibits higher Mn valence than LMO-S, which accords well with the Mn4+/Mn3+ ratio measured from XPS. This could be because the generation of La defects causes the loss of positive charges; thus, the Mn oxidation state has to be raised in order to maintain electroneutrality.
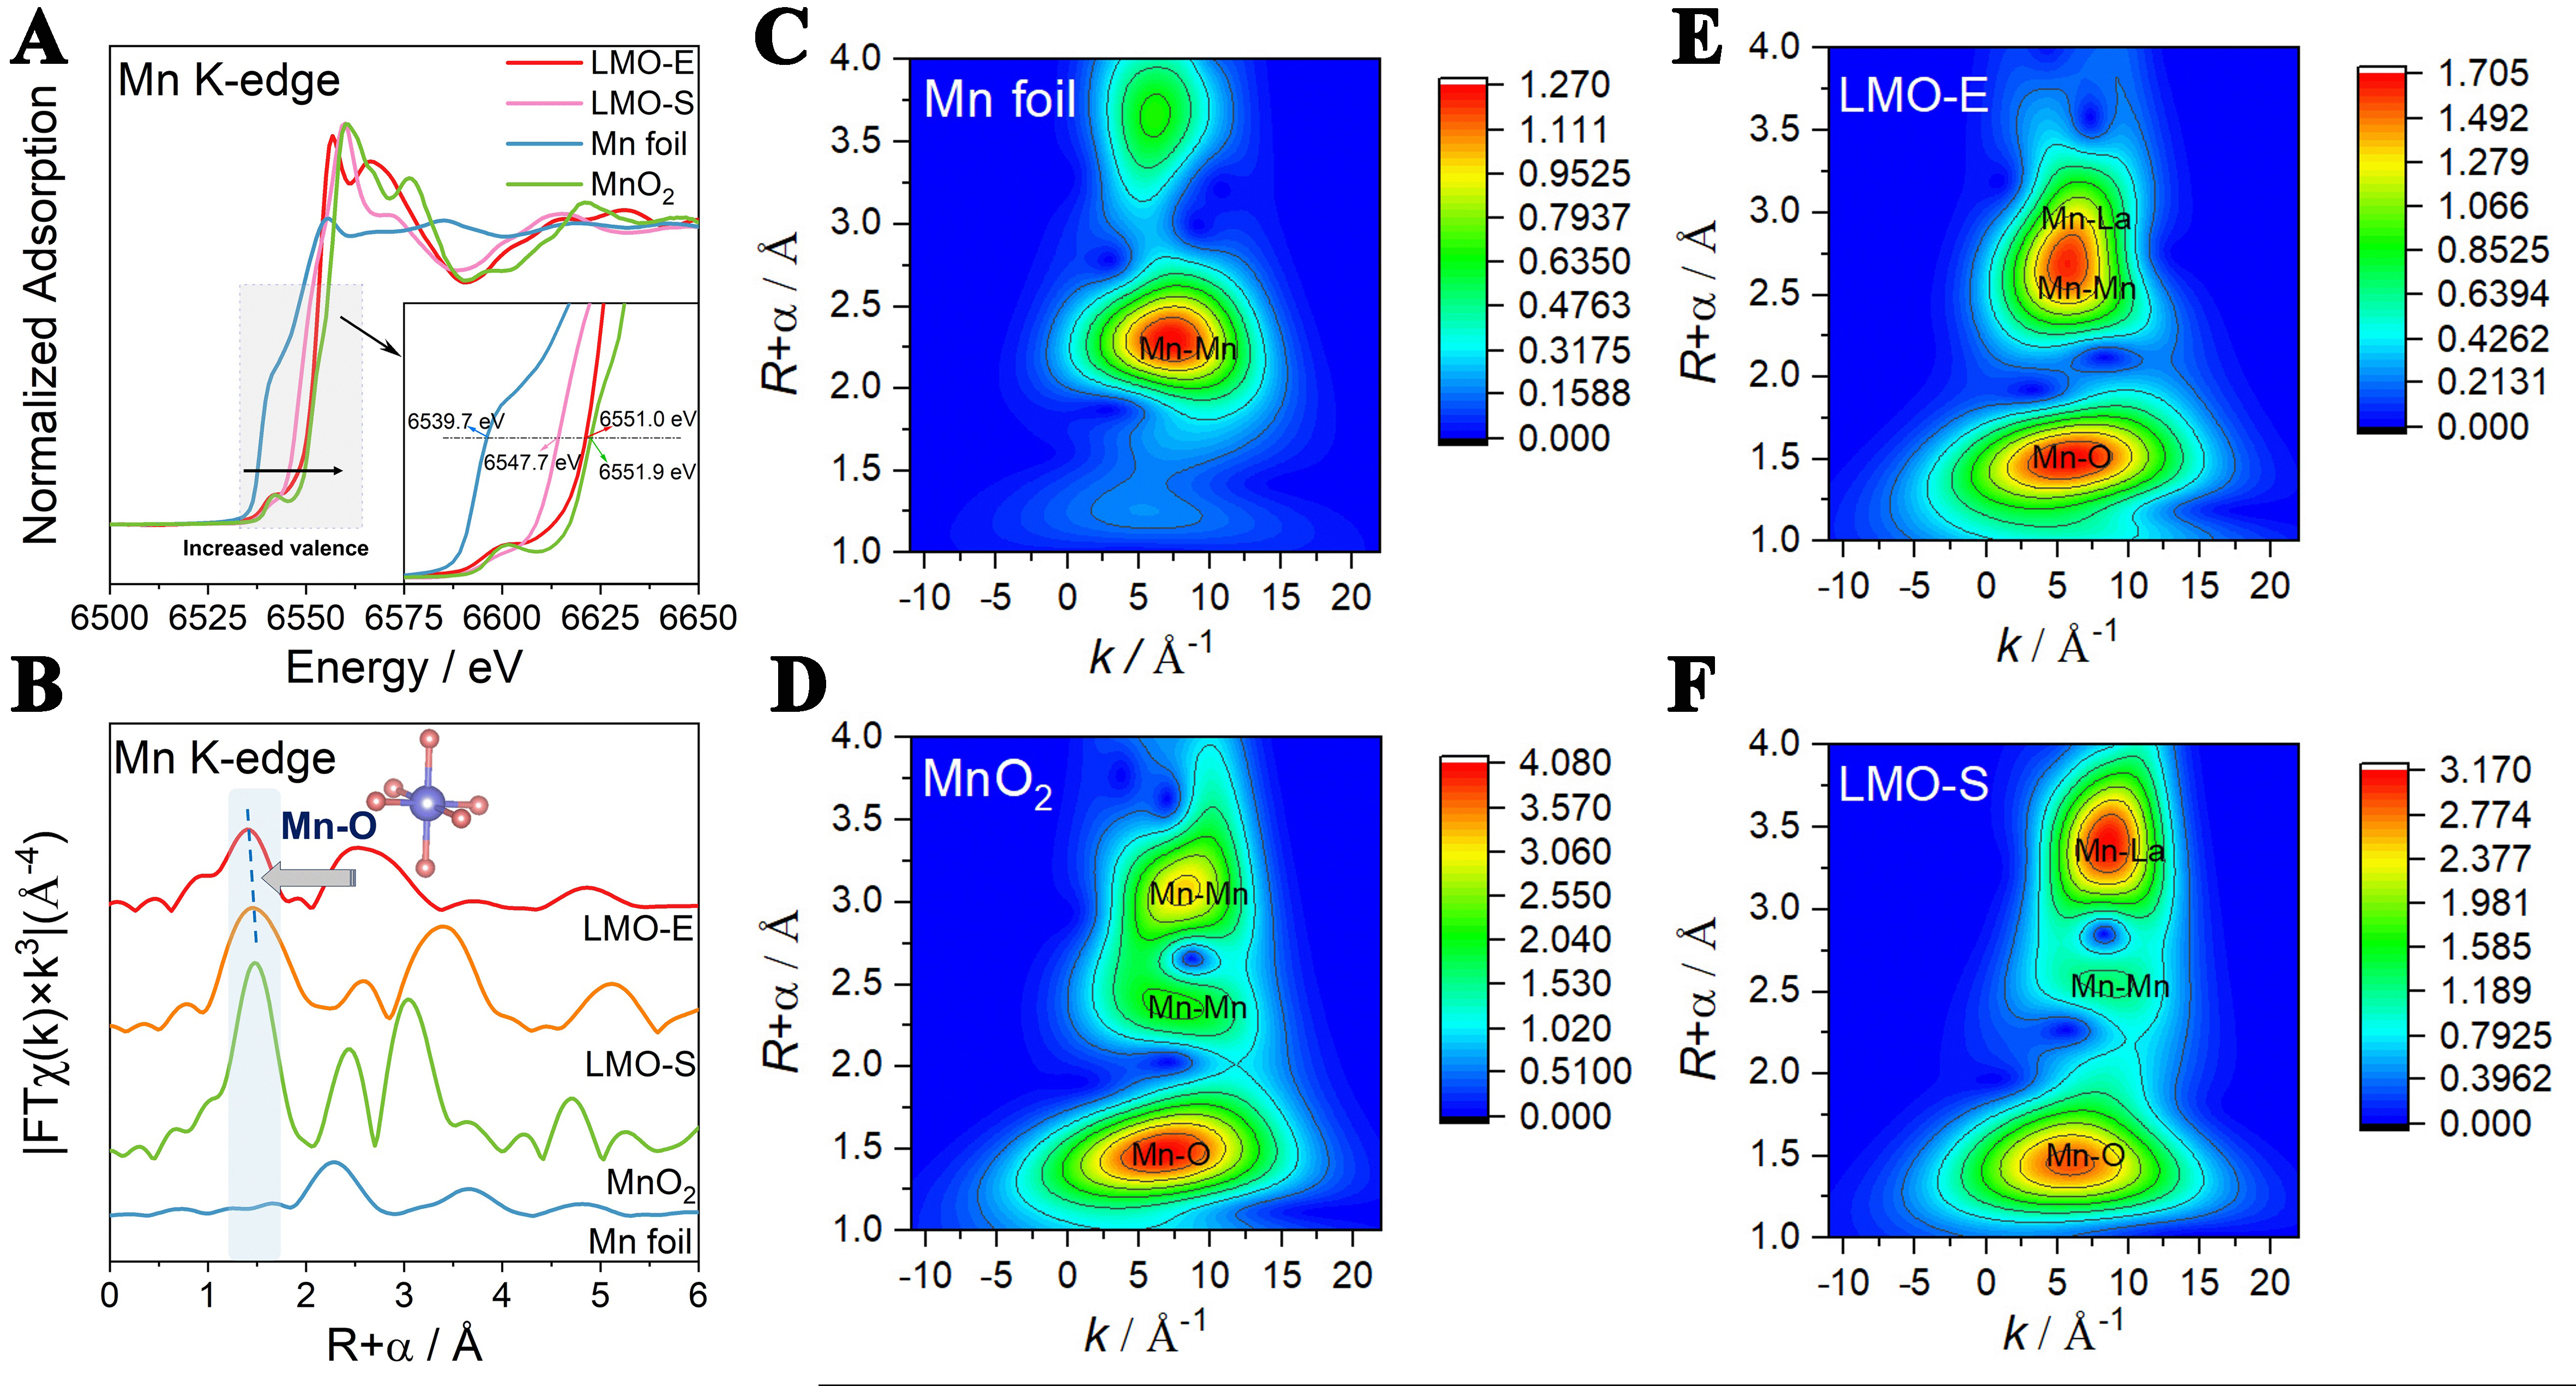
Figure 4. (A) Mn K-edge XANES, (B) the R-space Fourier-transformed FT [k3χ(k)] of Mn K-edge EXAFS profiles recorded for LMO-S and LMO-E catalysts. The purple and orange spheres denote Mn and O atoms, respectively; WT plots at the Mn K-edge of (C) Mn foil, (D) MnO2, (E) LMO-E and (F) LMO-S. XANES: X-ray absorption near-edge structure; FT: Fourier transform; EXAFS: extended X-ray absorption fine structure; LMO-S: LaMnO3 prepared by the sol-gel method; LMO-E: LaMnO3 prepared by the “top down” method; WT: wavelet transforms.
Figure 4B displays the Mn K-edge EXAFS k3c(k) function curves of LMO-E and LMO-S, showing that both samples have the Mn-O coordination peak at 1.4 Å. Compared with the peak of LMO-S, the peak of LMO-E significantly shifts to left, due to the contraction of the Mn–O bond. Quantitative EXAFS fitting parameters reveal that the R distances of Mn-O, Mn-Mn and Mn-La shells of the LMO-E are all shortened, from
Catalytic performances
Catalytic performances of the materials are evaluated for the oxidation removal of EA, which is one of the main pollutants emitted from the printing and dyeing industry. Figure 5A and B displays the EA conversion and CO2 yield obtained from the materials. The LMO-E shows a T90 (the temperature at 90% EA conversion) value of 184 °C, which is far lower than the T90 for LMO-S (222 °C) and La3Mn2O7 (215 °C). Meanwhile, the CO2 yield has also greatly improved when compared to that of LMO-S and La3Mn2O7. This demonstrates that the LMO-E is highly active for the oxidation of EA into CO2. The superiority of LMO-E for EA oxidation is also verified by comparing to the catalysts reported in literature [Supplementary Table 5].
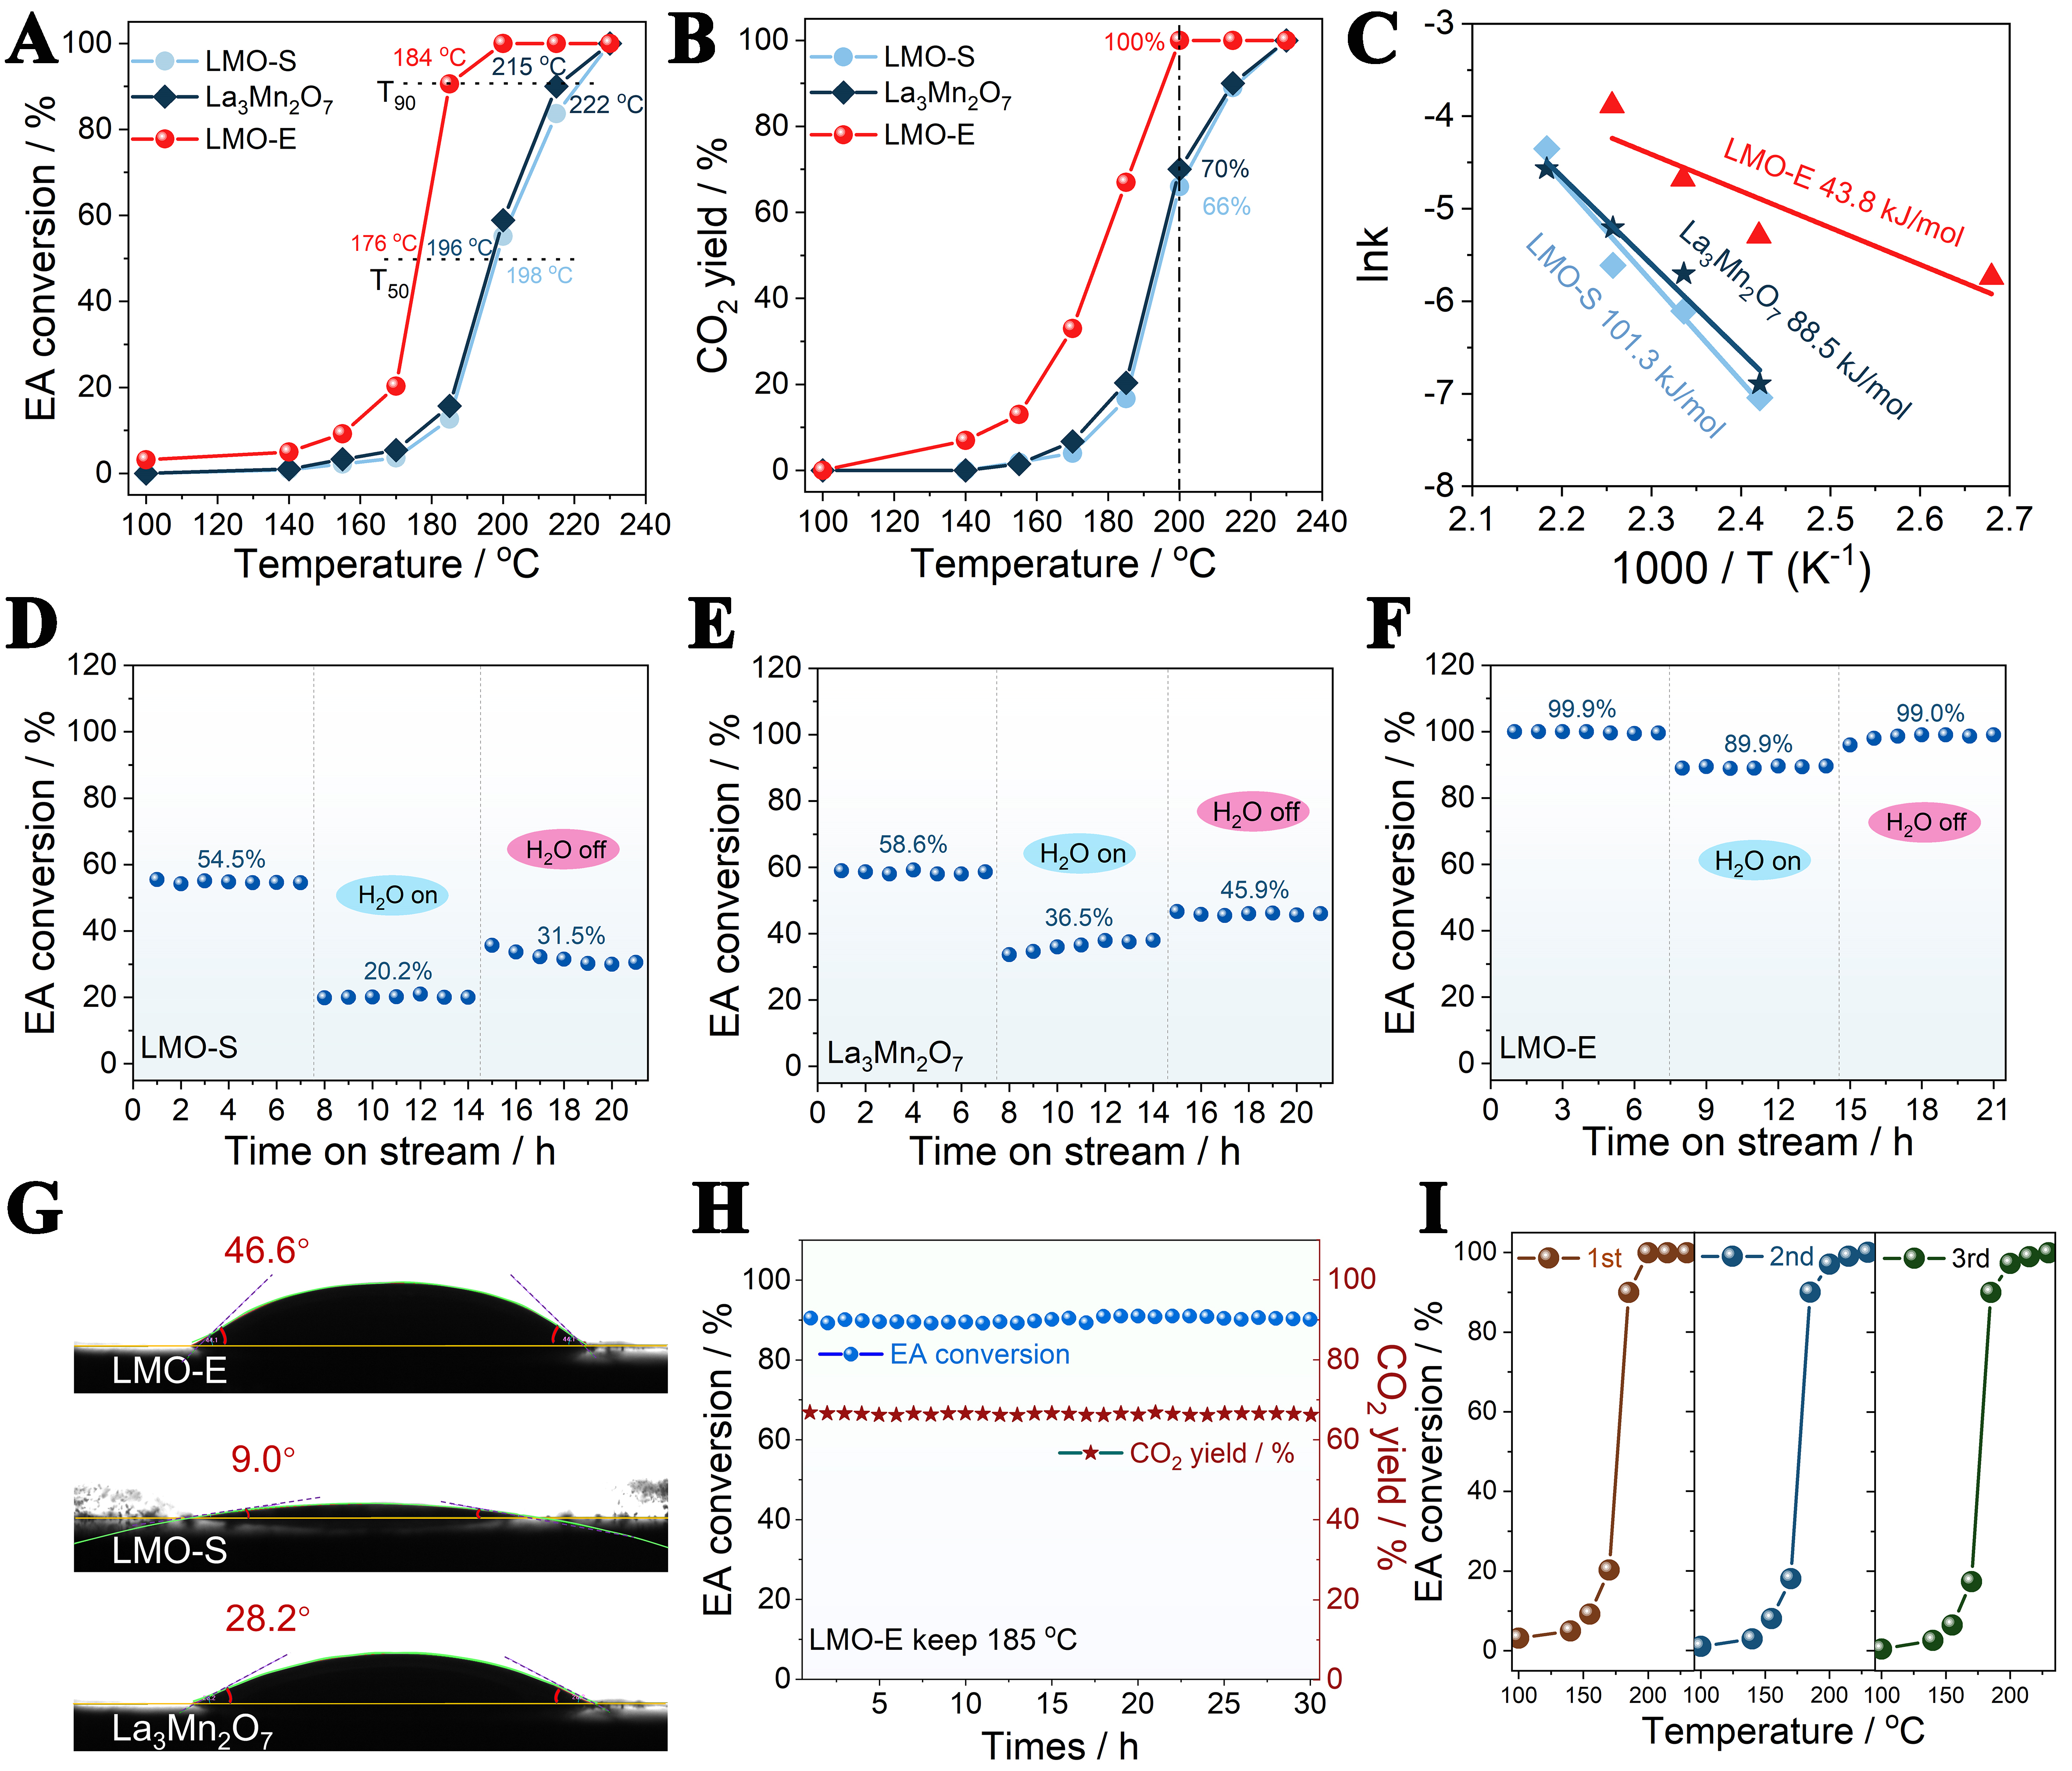
Figure 5. (A) EA conversion, (B) CO2 yield and (C) the Arrhenius plots of EA oxidation over the samples; Effects of 5.0 vol% vapor on EA oxidation over (D) LMO-S, (E) La3Mn2O7, and (F) LMO-E conducted under the conditions: 200 °C, 70,000 h-1 WHSV and 1,000 ppm EA; (G) the water contact angle tests of LMO-E, LMO-S and La3Mn2O7; (H) long-term stability and (I) recyclability of the LMO-E for EA oxidation. EA: Ethyl acetate; LMO-S: LaMnO3 prepared by the sol-gel method; LMO-E: LaMnO3 prepared by the “top down” method; WHSV: weight hourly space velocities.
To reveal the natural ability of catalysts for the reaction, the Arrhenius curves of EA oxidation, which is used to calculate the reaction activation energy (Ea), are plotted, according to
It is worth noting that the LMO-E also exhibits strong resistance to vapor during the reaction. Vapor is an indispensable gas in industrial exhausts, and is also a product of the VOCs combustion reaction. Hence, its effect on the catalytic behaviors of the catalyst has to be considered. Figure 5D-F shows the effect of vapor (5.0 vol%) on the catalytic activity of catalysts for EA oxidation. For LMO-S, the EA conversion greatly decreases from 54.5% to 20.2% when 5% vapor is introduced to the feed gases, and it can only be recovered to 31.5% after removing the water, with an activity loss of 23%. A similar phenomenon is observed for
In contrast, LMO-E shows 99.9% EA conversion under dry conditions and the conversion is only decreased to 89.5% when 5% vapor is introduced. Moreover, the conversion can be almost fully recovered (99.0%) after removing the vapor, with an activity loss of only 0.9%. A more visual comparison of the resistibility of the catalysts to vapor can be found in Supplementary Figure 12. The excellent vapor resistibility of LMO-E is also observed when lowering the temperature to 185 °C, with an initial EA conversion of 86.6% and recovered conversion of 86.0% [Supplementary Figure 13].
To explore the reasons why LMO-E exhibits good resistance to vapor, we perform the water contact angle tests, finding that the contact angle of LMO-E is 46.6°, which is 5.2 and 1.7 times larger than that of LMO-S (9.0°) and La3Mn2O7 (28.2°), as shown in Figure 5G. This clearly demonstrates why LMO-E exhibits stronger hydrophobicity than LMO-S and La3Mn2O7, and why it displays well recovered activity after removing the vapor. The strong hydrophobicity of LMO-E can be attributed to the presence of La defects on the surface. Therefore, the surface of LMO-E mainly exposes Mn oxides, which has weaker affinity to water than La oxides[49], consequently improving the hydrophobicity of LMO-E. The strong hydrophobicity of Mn-O surface, relative to that of La-O surface, has been well recognized in literature. For example, Hong et al. reported that La oxides exhibit strong hydrophilicity due to the formation of hydrophilic hydroxyl groups (La-OH), while Mn oxides exhibit strong hydrophobicity because its surface is dominated with non-polar Mn–O bonds[50]. Considering that materials with nanostructure and smooth surface also exhibit good hydrophobicity[51], the ultrathin nanosheet (thickness ~3.1 nm) and smooth surface of LMO-E could also be a reason accounting for its strong hydrophobicity. This result also provides a strategy to design perovskite oxides with strong resistibility to vapor for industrial use.
Stability is also an important criterion to evaluate the industrial prospect of catalyst. In this respect, we test both the long-term stability and cycling stability of LMO-E for EA oxidation. Figure 5H and I shows that both the EA conversion and CO2 yield are very stable during the long-term stability test (185 °C, ~90% EA conversion, for 30 h), and no appreciable activity changes are observed in the cycling stability test (for three cycles). This indicates that the LMO-E is highly stable in the reaction. Indeed, the crystal structure, particle size, oxygen defects, and surface morphology of the LMO-E are almost unchanged after the reaction, and no appreciable carbon deposition is observed on the used LMO-E in the TGA measurement [Supplementary Figures 14-17].
The breakthrough physicochemical properties (e.g., surface area, La and O defect, mismatched lattice) achieved for LMO-E enable it to be a promising catalyst for oxidation reactions. For example, in the oxidation of benzene and chlorobenzene, the T90 reaches 228 and 365 °C, which is 68 and 177 °C lower than that of LMO-S, respectively [Supplementary Figure 18]. In addition to full oxidation reaction, LMO-E also exhibits exciting activities for partial oxidation reactions, e.g., liquid-phase selective oxidation of benzyl alcohol [Supplementary Figure 19]. All these results suggest that the top-down strategy is a potential method to synthesize perovskite oxide for oxidation reactions.
DFT calculations on LaMnO3 grain boundaries
It has been reported that the oxygen vacancies at the core of grain boundaries can enhance the diffusion of electrons via long-range diffusion paths, facilitating the reaction[52]. Herein, to fully understand the consolidated properties of grain boundary promoted by oxygen vacancies, we calculate and compare the stability, the electronic configuration, and the adsorption capability to O2 of the grain boundary with and without oxygen vacancies. Referring to the above study, we choose the (310) surface slab as an optimum supercell to construct the grain boundary, and three oxygen vacancies (the blue circles) are configured for calculation [Figure 6A]. The results show that the oxygen vacancies significantly distort the local configuration of grain boundaries, and the binding energy is 10 eV lower than that of the regular grain boundaries (without oxygen vacancies). That is, the presence of oxygen vacancies greatly improves the stability of the grain boundary.
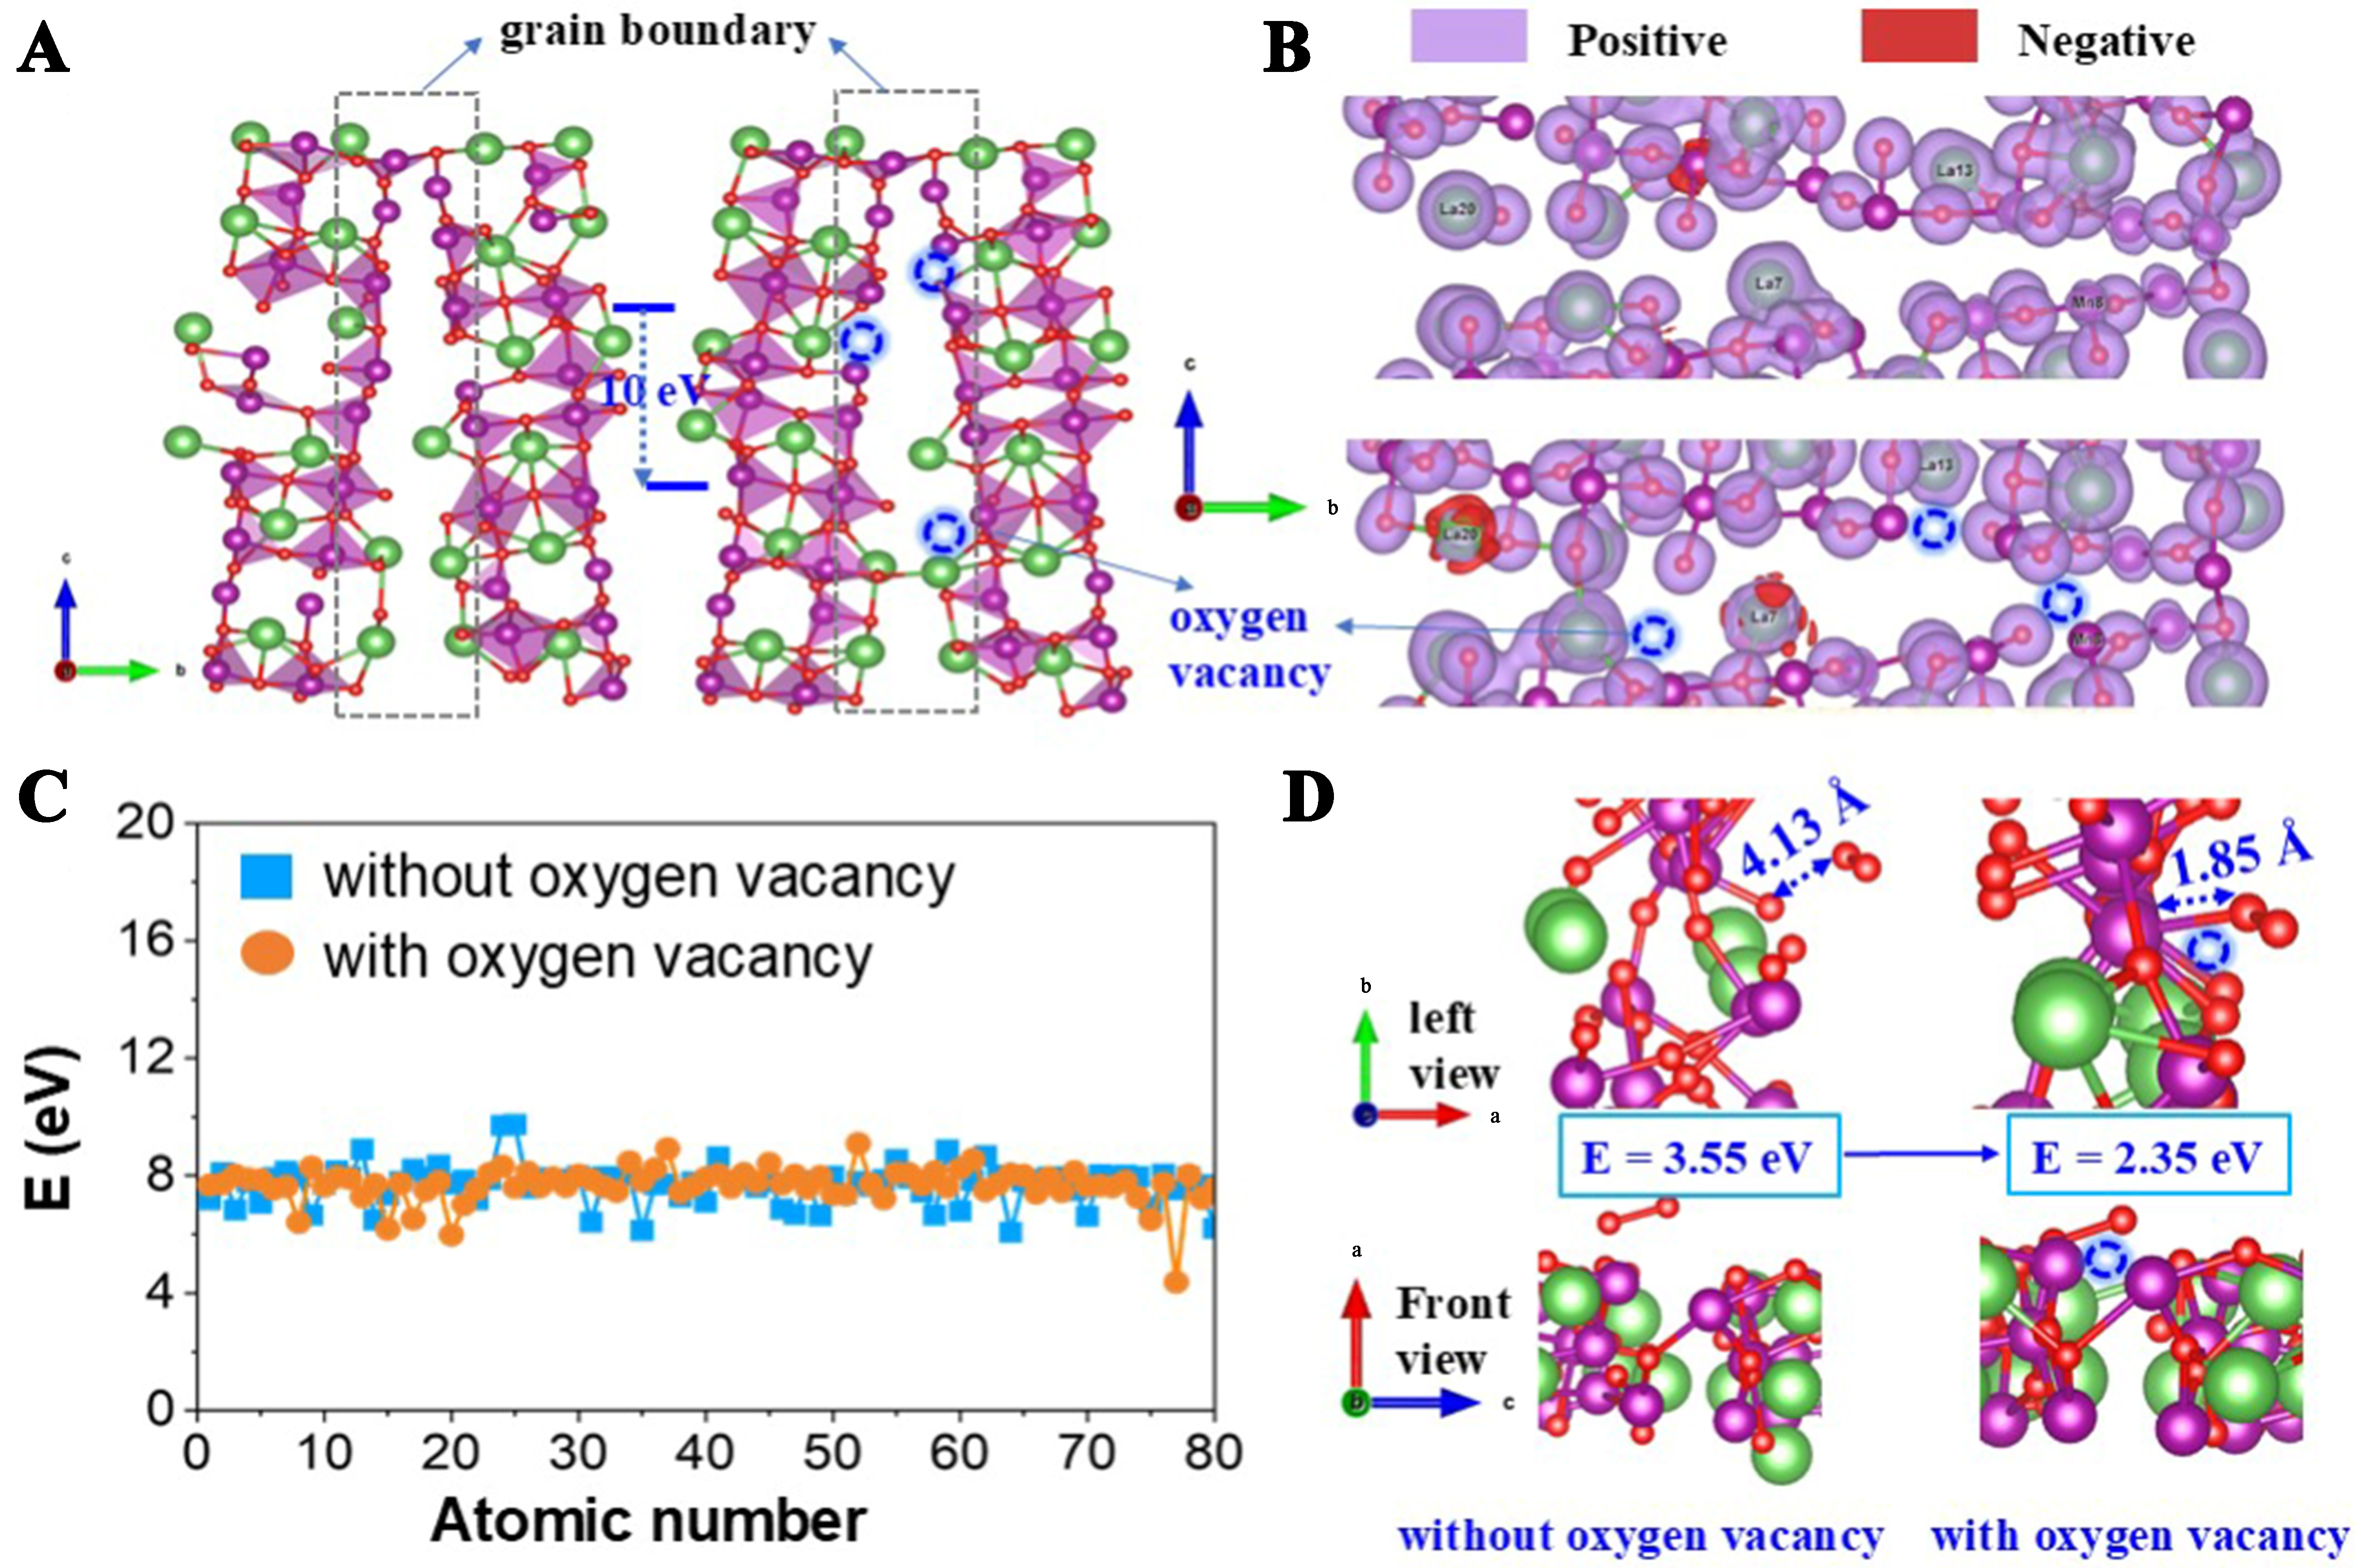
Figure 6. (A) Optimized quasi-cubic LaMnO3 (310) and (-310) grain boundaries, with and without oxygen defects; (B) The Bader charge distribution on the grain boundaries containing with and without oxygen defects; (C) Effect of oxygen defect construction on the Bader charge at the grain boundary surface; (D) DFT calculations of O2. The green, purple, and red spheres denote La, Mn, and O atoms, respectively. DFT: Density functional theory.
Effects of oxygen vacancies on the electronic configuration of the grain boundary region are evaluated using the Bader charges [Figure 6B]. From the color changes, we see that the charge density of La atoms is greater in the vicinity of oxygen vacancies (the greater the difference in color, the greater the charge density), indicating that the presence of oxygen vacancies elevates the charge difference at the grain boundaries. This is also supported by the electron energies of the atoms in the two structures, which shows that the energy difference is larger in the structure containing oxygen vacancies [Figure 6C]. It is true that lattice oxygen is negatively charged; thus, when the oxygen atoms escape to generate oxygen vacancies, the left electrons will spread and increase the charge density of the grain boundaries.
As for the adsorption capability to O2, we compare the adsorption energy of O2 on the grain boundary with and without oxygen vacancies. Figure 6D shows that the bond length of O2 adsorbed on LaMnO3 with oxygen vacancy is 1.85 Å, which is far shorter than that on LaMnO3 without oxygen vacancy (4.13 Å), corresponding to a decrease of 1.2 eV in the O2 adsorption energy. Hence, it is believed that the presence of oxygen vacancies can promote the ability of materials to adsorb and activate O2, benefiting the O2-involved oxidation reactions. O2 is adsorbed on (310) and (-310) grain boundaries containing with and without oxygen defects.
To verify that LMO-E has a stronger ability to adsorb and activate O2, we conduct EA-TPD/MS experiments, showing that two CO2 desorption peaks appear in the profile [Figure 7A]. Considering that no external oxygen is injected in this experiment, we believe that the formation of CO2 must be attributed to the oxidation of EA by oxygen species that are adsorbed on the surface and/or on the oxygen defects. By comparison, we see that the desorption temperature detected from LMO-E is lower than that from LMO-S (216 vs. 251 °C; 310 vs. 341 °C). Moreover, the peak area measured from LMO-E is 6.3 times larger than that measured from LMO-S. These results clearly demonstrate that the oxygen species of LMO-E is much more abundant and far more active than that of LMO-S or that LMO-E has a stronger ability to adsorb and activate O2 than LMO-S, in line with the results of O2-TPD experiments and DFT calculation.
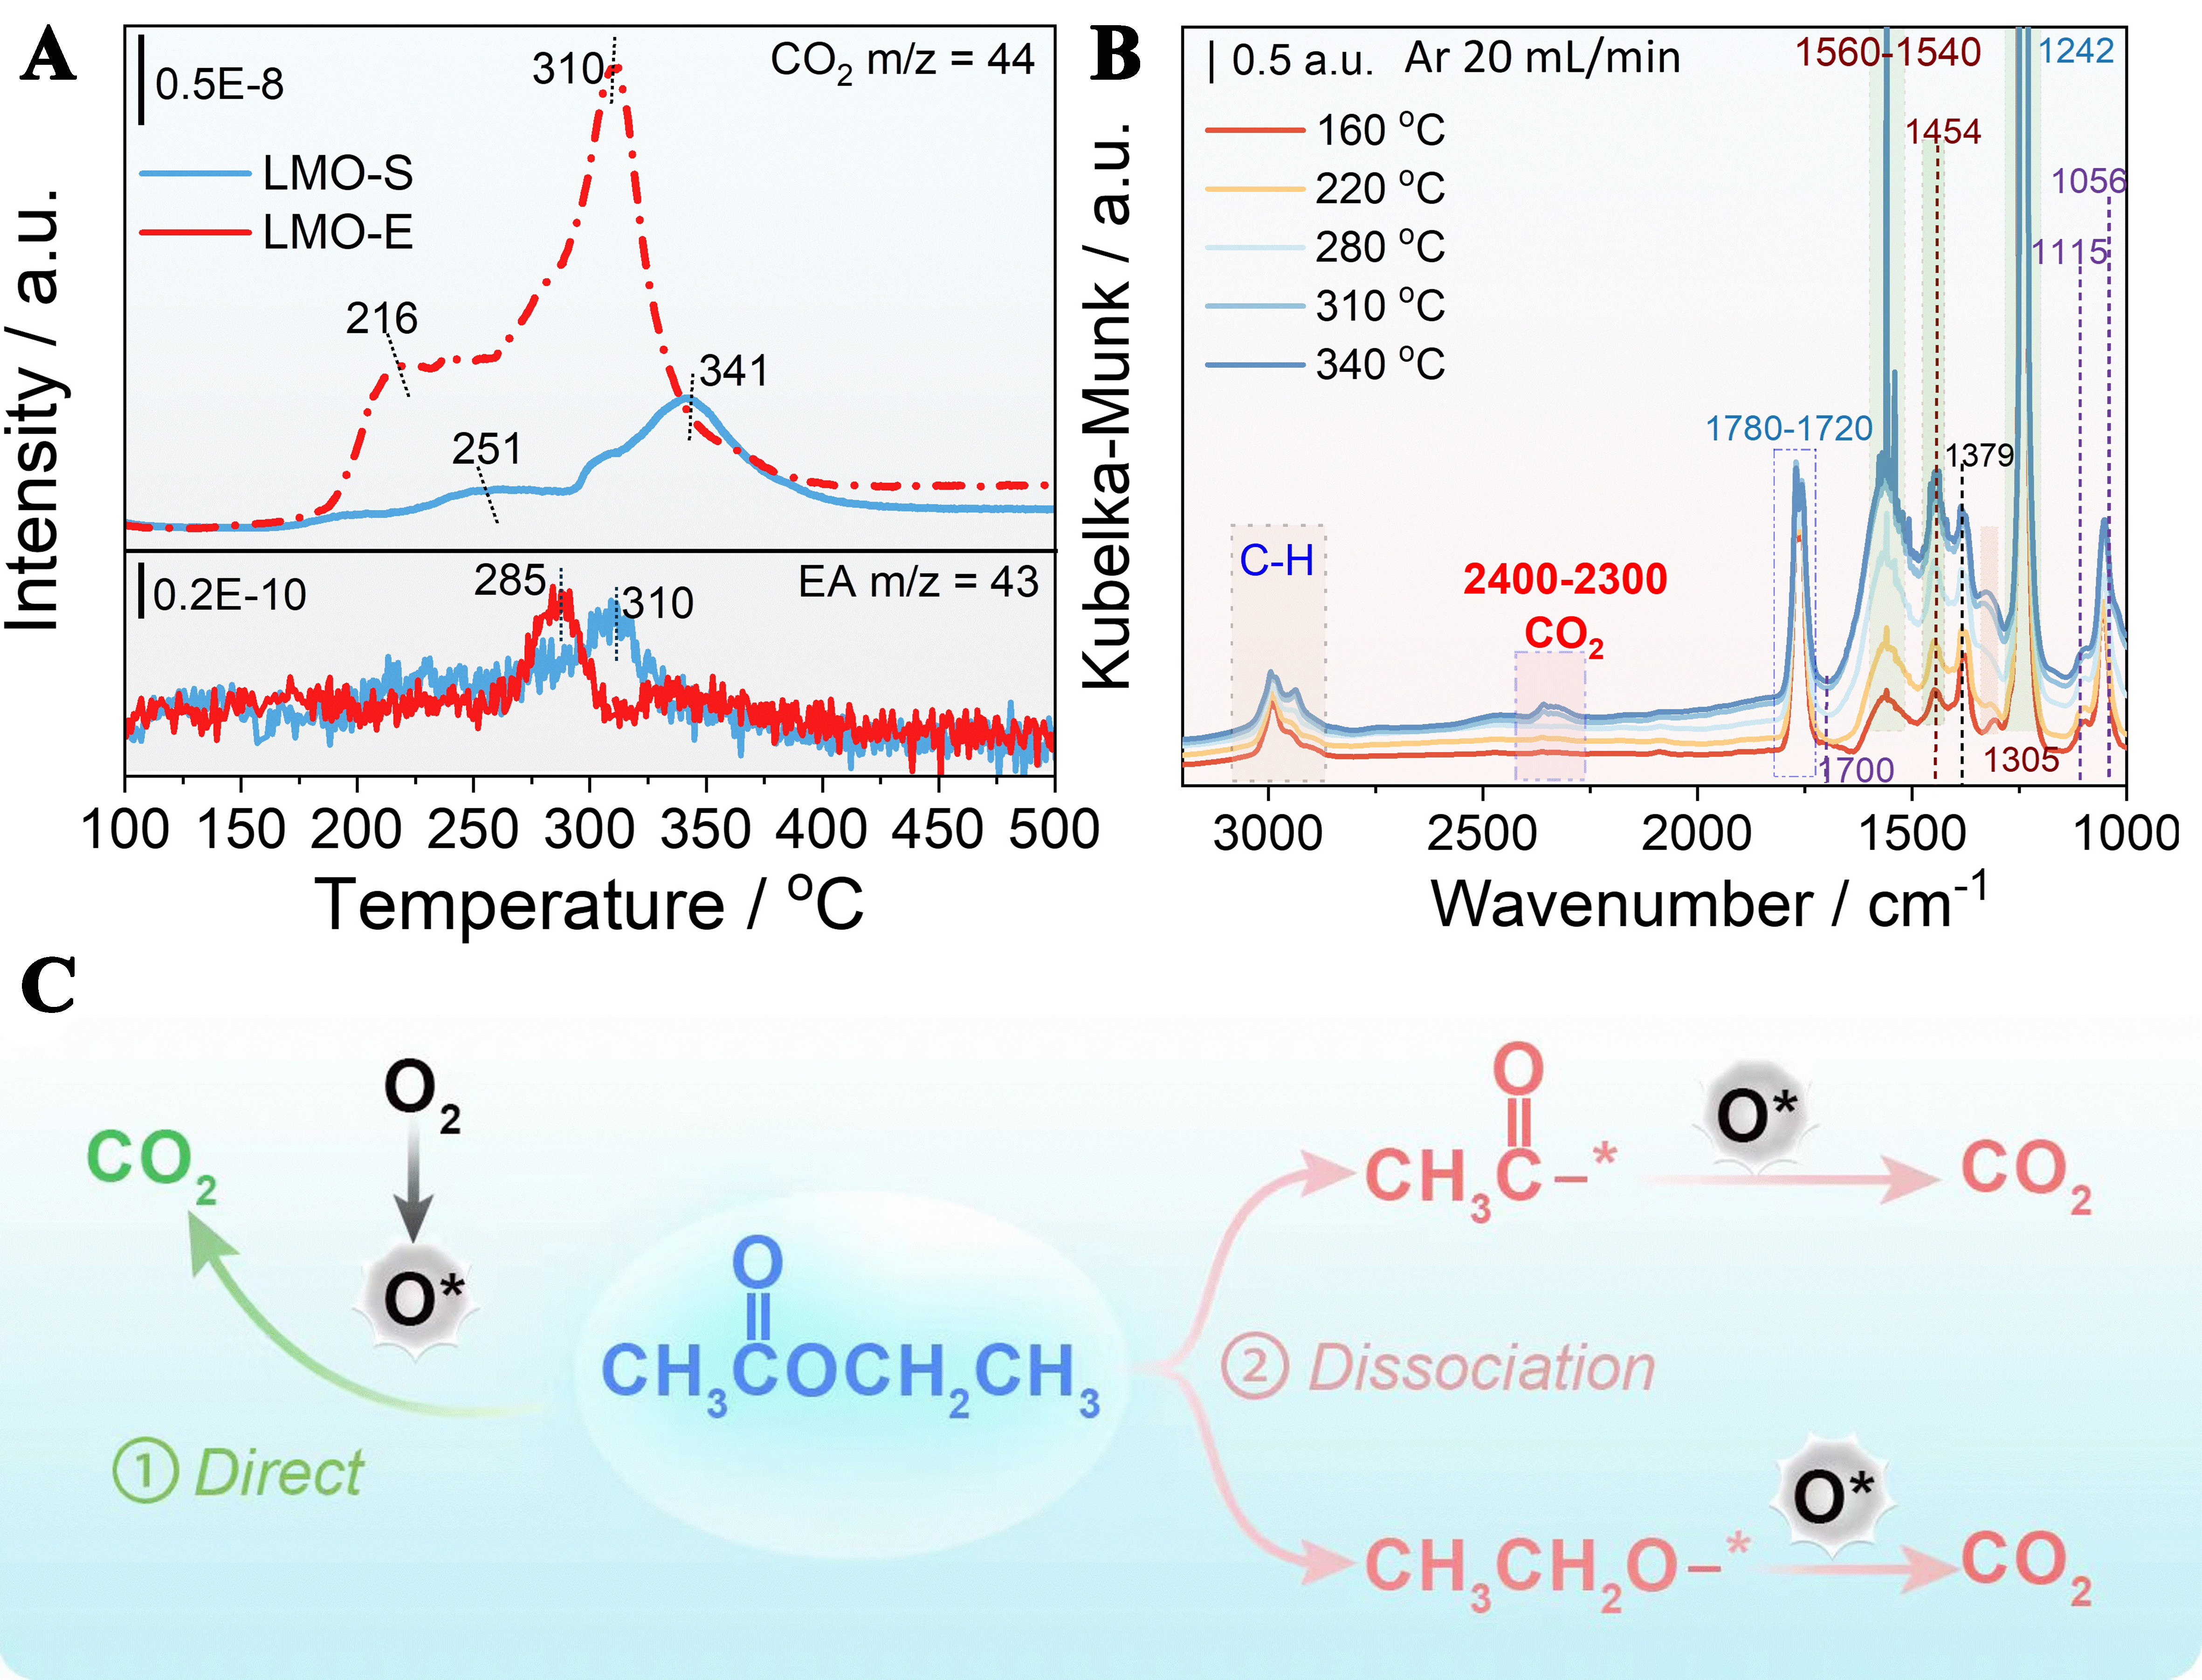
Figure 7. (A) EA-TPD/MS profiles of LMO-S and optimized LMO-E catalysts; (B) In situ DRIFTS spectra of EA adsorption over LMO-E catalysts from 160 to 340 °C; (C) A proposed sketchy mechanism for the oxidation removal of EA over LMO-E. EA: Ethyl acetate; TPD/MS: temperature-programmed desorption mass spectrometry; LMO-S: LaMnO3 prepared by the sol-gel method; LMO-E: LaMnO3 prepared by the “top down” method; DRIFTS: diffuse reflectance Fourier transform infrared spectra.
In addition to the CO2 desorption peak, a small EA desorption peak, attributed to the unreacted EA, is also observed in the profile, which could reflect EA desorption behavior over the catalyst. The desorption temperature of EA from LMO-E (285 °C) is lower than that of LMO-S (310 °C). This suggests that the adsorbed EA can be easily mobilized to react with the activated oxygen, promoting the reaction. Indeed, we find that the initial temperature for EA desorption fits well with that of the second CO2 desorption peak. This implies that the two CO2 desorption peaks are formed with different patterns: the first is by oxidation of EA that is directly adsorbed on the oxygen species, while the second is by oxidation of a free or mobilized EA.
To detail the EA adsorption/desorption behaviors on LMO-E, we conduct in-situ diffuse reflectance infrared spectroscopy (in-situ DRIFTS) in the temperature range of 100-370 °C. For clarification, we select several typical data and present them in Figure 7B, which indicates that an abrupt change appears from 280 to
In detail, the bands at 3,000-2,800 cm-1 belong to the vibration of vC-H of aldehydes, the bands at 2,400-
On the above basis, a sketchy mechanism for the oxidation removal of EA over LMO-E is proposed [Figure 7C]. Generally, the oxidation of EA could be proceeded in two pathways: one is direct oxidation of EA by neighboring activated oxygen species, which mainly occurs at low temperatures; another is that the EA is first dissociated into ethanolyl and glyoxyl groups, which then move and react with activated oxygen species to yield CO2, and this way mainly occurs at high temperatures.
CONCLUSIONS
In summary, we developed a convenient and general strategy to prepare LaMnO3 perovskite with 3D flower-like morphology consisting of 2D nanosheets via a top-down approach. Because of the destruction of the original complex structure (La3Mn2O7), the resulting LMO-E exhibits surface area of up to 212.3 m2·g-1, which is ten times larger than that of LMO-S prepared by the sol-gel method. Meanwhile, the etching of La and O atoms led to an abrupt increase in oxygen vacancy and Mn oxidation state, promoting the redox behavior. EXAFS spectroscopy confirmed that the generation of La defects enhances the interaction between Mn and O atoms. In-situ DRIFTS and EA-TPD/MS experiments revealed that LMO-E with rich defects and oxygen vacancies possesses the strongest EA adsorption capacity and the lowest CO2 deposition temperature. DFT calculation combined with experimental results revealed that the presence of oxygen vacancies not only promote the stability of grain boundaries for the lower binding energy, but also benefit the O2 adsorption and activation for the higher charge density, revealing that oxygen vacancy is a good regulator for the stability and activity of grain boundary. These advantages enabled the material to exhibit excellent catalytic activity and stability for both full (e.g., conversion of EA to CO2) and partial (e.g., conversion of benzyl alcohol to benzaldehyde) oxidation reaction, as well as strong resistibility to water poison, potentiating its industrial application.
DECLARATIONS
Authors’ contributions
Supervised the whole project, designed the study, and co-wrote the manuscript: Zhu, J.
Performed all the experiments and analysed the experiment data: Wang, S.
Helped to do the characterizations: Luo, Y.; Xiao, P.
Helped to do the DFT simulations, proposed new ideas and co-wrote the manuscript: Lyu, S.; Chen, Y.
Availability of data and materials
The data supporting the findings of this study are available within this Article and the Supplementary Materials. Further data are available from the corresponding authors upon request.
AI and AI-assisted tools statement
Not applicable.
Financial support and sponsorship
This work is financed by the National Natural Science Foundation of China (22102123, 42277485), the Department of Science and Technology of Hubei Province (2021CFA034, 2024CSA084), and the Department of Science and Technology of Yunnan Province (202401BA070001-035, 202505AF350065).
Conflicts of interest
All authors declared That there are no conflicts of interest.
Ethical approval and consent to participate
Not applicable.
Consent for publication
Not applicable.
Copyright
© The Author(s) 2026.
Supplementary Materials
REFERENCES
1. Parravano, G. Catalytic activity of lanthanum and strontium manganite. J. Am. Chem. Soc. 1953, 75, 1497-8.
2. Nguyen, L. T.; Cava, R. J. Hexagonal perovskites as quantum materials. Chem. Rev. 2021, 121, 2935-65.
3. Voorhoeve, R. J.; Johnson, D. W. J.; Remeika, J. P.; Gallagher, P. K. Perovskite oxides: materials science in catalysis. Science 1977, 195, 827-33.
4. Zheng, X.; Li, B.; Wang, Q.; Wang, D.; Li, Y. Emerging low-nuclearity supported metal catalysts with atomic level precision for efficient heterogeneous catalysis. Nano. Res. 2022, 15, 7806-39.
5. Wang, B.; Zhang, N.; Xiao, P.; Zhang, J.; Carabineiro, S. A. C.; Zhu, J. Carbon coated LaFe0.92Pd0.08O3 composites for catalytic transfer hydrogenation: balance in the ability of substrates adsorption and conversion. Nano. Res. 2024, 17, 3724-32.
6. Zheng, Y.; Zhang, R.; Zhang, L.; Gu, Q.; Qiao, Z. A. A resol-assisted cationic coordinative co-assembly approach to mesoporous ABO3 perovskite oxides with rich oxygen vacancy for enhanced hydrogenation of furfural to furfuryl alcohol. Angew. Chem. Int. Ed. Engl. 2021, 60, 4774-81.
7. Chen, G.; Liu, X.; An, J.; et al. Nucleation-mediated growth of chiral 3D organic-inorganic perovskite single crystals. Nat. Chem. 2023, 15, 1581-90.
8. Hwang, J.; Rao, R. R.; Giordano, L.; et al. Regulating oxygen activity of perovskites to promote NOx oxidation and reduction kinetics. Nat. Catal. 2021, 4, 663-73.
9. Feng, C.; Gao, Q.; Xiong, G.; et al. Defect engineering technique for the fabrication of LaCoO3 perovskite catalyst via urea treatment for total oxidation of propane. Appl. Catal. B. Environ. 2022, 304, 121005.
10. Wang, S.; Zhu, J.; Carabineiro, S. A.; Xiao, P.; Zhu, Y. Selective etching of in-situ formed La2O3 particles to prepare porous LaCoO3 perovskite for catalytic combustion of ethyl acetate. Appl. Catal. A. Gen. 2022, 635, 118554.
11. Schreier, M.; Curvat, L.; Giordano, F.; et al. Efficient photosynthesis of carbon monoxide from CO2 using perovskite photovoltaics. Nat. Commun. 2015, 6, 7326.
12. Zheng, H.; Zhang, Y.; Wang, Y.; et al. Perovskites with enriched oxygen vacancies as a family of electrocatalysts for efficient nitrate reduction to ammonia. Small 2023, 19, e2205625.
13. Hwang, J.; Rao, R. R.; Giordano, L.; Katayama, Y.; Yu, Y.; Shao-Horn, Y. Perovskites in catalysis and electrocatalysis. Science 2017, 358, 751-6.
14. Luc, W.; Fu, X.; Shi, J.; et al. Two-dimensional copper nanosheets for electrochemical reduction of carbon monoxide to acetate. Nat. Catal. 2019, 2, 423-30.
15. Zhuang, Z.; Li, Y.; Yu, R.; et al. Reversely trapping atoms from a perovskite surface for high-performance and durable fuel cell cathodes. Nat. Catal. 2022, 5, 300-10.
16. Wang, K.; Han, C.; Shao, Z.; Qiu, J.; Wang, S.; Liu, S. Perovskite oxide catalysts for advanced oxidation reactions. Adv. Funct. Mater. 2021, 31, 2102089.
17. Si, W.; Wang, Y.; Peng, Y.; Li, J. Selective dissolution of A-site cations in ABO3 perovskites: a new path to high-performance catalysts. Angew. Chem. Int. Ed. Engl. 2015, 54, 7954-7.
18. Wang, S.; Zhu, J.; Yang, J.; Li, M.; Zhu, Y. Influence of LaCoO3 perovskite oxides prepared by different method on the catalytic combustion of ethyl acetate in the presence of NO. Appl. Surf. Sci. 2023, 623, 157045.
19. Wang, S.; Xiao, P.; Yang, J.; et al. Catalytic combustion of volatile organic compounds using perovskite oxides catalysts - a review. Front. Chem. Sci. Eng. 2023, 17, 1649-76.
20. Zhang, C.; Guo, Y.; Guo, Y.; et al. LaMnO3 perovskite oxides prepared by different methods for catalytic oxidation of toluene. Appl. Catal. B. Environ. 2014, 148-9, 490-8.
21. Sim, Y.; Yoo, J.; Ha, J.; Jung, J. C. Oxidative coupling of methane over LaAlO3 perovskite catalysts prepared by a co-precipitation method: effect of co-precipitation pH value. J. Energy. Chem. 2019, 35, 1-8.
22. Rendón-Angeles, J. C.; Matamoros-Veloza, Z.; Matamoros Veloza, A.; Perez-Garibay, R.; Rodriguez-Galicia, J. L.; Kazumichi, Y. Facile synthesis of perovskite-structured powders using barite–celestite ore under hydrothermal alkaline conditions. Ind. Eng. Chem. Res. 2017, 56, 9942-52.
23. Guiton, B. S.; Davies, P. K. Nano-chessboard superlattices formed by spontaneous phase separation in oxides. Nat. Mater. 2007, 6, 586-91.
24. Wang, L.; Wu, J.; Wang, S.; Liu, H.; Wang, Y.; Wang, D. The reformation of catalyst: from a trial-and-error synthesis to rational design. Nano. Res. 2024, 17, 3261-301.
25. Lu, T.; Yan, W.; Feng, G.; et al. Singlet oxygen-promoted one-pot synthesis of highly ordered mesoporous silica materials via the radical route. Green. Chem. 2022, 24, 4778-82.
26. Feng, G.; Wang, J.; Boronat, M.; et al. Radical-facilitated green synthesis of highly ordered mesoporous silica materials. J. Am. Chem. Soc. 2018, 140, 4770-3.
27. Tang, R.; Sun, H.; Zhang, Z.; et al. Incorporating plasmonic Au-nanoparticles into three-dimensionally ordered macroporous perovskite frameworks for efficient photocatalytic CO2 reduction. Chem. Eng. J. 2022, 429, 132137.
28. Wang, S.; Xu, X.; Zhu, J.; Tang, D.; Zhao, Z. Effect of preparation method on physicochemical properties and catalytic performances of LaCoO3 perovskite for CO oxidation. J. Rare. Earths. 2019, 37, 970-7.
29. Du, X.; Zou, G.; Zhang, Y.; Wang, X. A novel strategy for low-temperature synthesis of Ruddlesden–Popper type layered perovskite La3Mn2O7+δ for methane combustion. J. Mater. Chem. A. 2013, 1, 8411.
30. Ravel, B.; Newville, M. ATHENA, ARTEMIS, HEPHAESTUS: data analysis for X-ray absorption spectroscopy using IFEFFIT. J. Synchrotron. Radiat. 2005, 12, 537-41.
31. Zabinsky, S. I.; Rehr, J. J.; Ankudinov, A.; Albers, R. C.; Eller, M. J. Multiple-scattering calculations of X-ray-absorption spectra. Phys. Rev. B. Condens. Matter. 1995, 52, 2995-3009.
32. Olana, B. N.; Lin, S. D.; Hwang, B. In situ diffuse reflectance infrared Fourier-transformed spectroscopy study of solid electrolyte interphase formation from lithium bis(trifluoromethanesulfonyl)imide in 1,2-dimethoxyethane and 1,3-dioxolane with and without lithium nitrate additive over lithium and copper metal anodes. Electrochim. Acta. 2022, 416, 140266.
33. Sediva, E.; Rupp, J. L. M. Raman spectra and defect chemical characteristics of Sr(Ti,Fe)O3-y solid solution of bulk pellets vs. thin films. J. Mater. Chem. A. Mater. 2023, 11, 26752-63.
34. Huang, W.; Johnston-Peck, A. C.; Wolter, T.; et al. Steam-created grain boundaries for methane C-H activation in palladium catalysts. Science 2021, 373, 1518-23.
35. Shao, Y.; Fang, Y.; Li, T.; et al. Grain boundary dominated ion migration in polycrystalline organic–inorganic halide perovskite films. Energy. Environ. Sci. 2016, 9, 1752-9.
36. Royer, S.; Duprez, D.; Kaliaguine, S. Role of bulk and grain boundary oxygen mobility in the catalytic oxidation activity of LaCo1-xFexO3. J. Catal. 2005, 234, 364-75.
37. Lu, M.; Zheng, Y.; Hu, Y.; et al. Artificially steering electrocatalytic oxygen evolution reaction mechanism by regulating oxygen defect contents in perovskites. Sci. Adv. 2022, 8, eabq3563.
38. Zhu, Y.; Zhang, L.; Zhao, B.; et al. Improving the activity for oxygen evolution reaction by tailoring oxygen defects in double perovskite oxides. Adv. Funct. Mater. 2019, 29, 1901783.
39. Wu, M.; Chen, S.; Xiang, W. Oxygen vacancy induced performance enhancement of toluene catalytic oxidation using LaFeO3 perovskite oxides. Chem. Eng. J. 2020, 387, 124101.
40. Kang, L.; Wang, B.; Bing, Q.; et al. Adsorption and activation of molecular oxygen over atomic copper(I/II) site on ceria. Nat. Commun. 2020, 11, 4008.
41. Li, Y.; Chen, T.; Zhao, S.; et al. Engineering cobalt oxide with coexisting cobalt defects and oxygen vacancies for enhanced catalytic oxidation of toluene. ACS. Catal. 2022, 12, 4906-17.
42. Si, W.; Wang, Y.; Zhao, S.; Hu, F.; Li, J. A facile method for in situ preparation of the MnO2/LaMnO3 catalyst for the removal of toluene. Environ. Sci. Technol. 2016, 50, 4572-8.
43. Wang, Y.; Yang, D.; Li, S.; Zhang, L.; Zheng, G.; Guo, L. Layered copper manganese oxide for the efficient catalytic CO and VOCs oxidation. Chem. Eng. J. 2019, 357, 258-68.
44. Zhang, X.; Bi, F.; Zhu, Z.; et al. The promoting effect of H2O on rod-like MnCeOx derived from MOFs for toluene oxidation: a combined experimental and theoretical investigation. Appl. Catal. B. Environ. 2021, 297, 120393.
45. Dong, C.; Qu, Z.; Qin, Y.; Fu, Q.; Sun, H.; Duan, X. Revealing the highly catalytic performance of spinel CoMn2O4 for toluene oxidation: involvement and replenishment of oxygen species using in situ designed-TP techniques. ACS. Catal. 2019, 9, 6698-710.
46. Wang, F.; Dai, H.; Deng, J.; Bai, G.; Ji, K.; Liu, Y. Manganese oxides with rod-, wire-, tube-, and flower-like morphologies: highly effective catalysts for the removal of toluene. Environ. Sci. Technol. 2012, 46, 4034-41.
47. Li, M.; Zhang, C.; Fan, L.; Lian, Y.; Niu, X.; Zhu, Y. Enhanced catalytic oxidation of toluene over manganese oxide modified by lanthanum with a coral-like hierarchical structure nanosphere. ACS. Appl. Mater. Interfaces. 2021, 13, 10089-100.
48. Tang, W.; Wu, X.; Li, D.; et al. Oxalate route for promoting activity of manganese oxide catalysts in total VOCs’ oxidation: effect of calcination temperature and preparation method. J. Mater. Chem. A. 2014, 2, 2544-54.
49. Tu, Y.; Zhou, Z.; Wei, W.; et al. Ti surface-doped spinel lithium manganese oxide with porous structure and improved stability for Li extraction from salt-lake brine. Chem. Eng. J. 2025, 503, 158533.
50. Hong, X.; Zhu, S.; Xia, M.; Du, P.; Wang, F. Investigation of the efficient adsorption performance and adsorption mechanism of 3D composite structure La nanosphere-coated Mn/Fe layered double hydrotalcite on phosphate. J. Colloid. Interface. Sci. 2022, 614, 478-88.
51. Luo, J.; Gao, Y.; Liu, Y.; et al. Self-assembled degradable nanogels provide foliar affinity and pinning for pesticide delivery by flexibility and adhesiveness adjustment. ACS. Nano. 2021, 15, 14598-609.
52. Polfus, J. M.; Yildiz, B.; Tuller, H. L. Origin of fast oxide ion diffusion along grain boundaries in Sr-doped LaMnO3. Phys. Chem. Chem. Phys. 2018, 20, 19142-50.
53. Zhou, Y.; Zhang, H.; Yan, Y. Catalytic oxidation of ethyl acetate over CuO/ZSM-5 catalysts: effect of preparation method. J. Taiwan. Inst. Chem. Eng. 2018, 84, 162-72.
54. Lao, Y.; Jiang, X.; Huang, J.; Zhang, Z.; Wang, X. Catalytic oxidation of ethyl acetate on Ce–Mn–O catalysts modified by La. Rare. Met. 2021, 40, 547-54.
55. Ye, Y.; Xu, J.; Gao, L.; et al. CuO/CeO2 catalysts prepared by modified impregnation method for ethyl acetate oxidation. Chem. Eng. J. 2023, 471, 144667.
56. Wang, X.; Wu, L.; Wang, Z.; et al. Photothermal synergistic catalytic oxidation of ethyl acetate over MOFs-derived mesoporous N-TiO2 supported Pd catalysts. Appl. Catal. B. Environ. 2023, 322, 122075.
Cite This Article

How to Cite
Download Citation
Export Citation File:
Type of Import
Tips on Downloading Citation
Citation Manager File Format
Type of Import
Direct Import: When the Direct Import option is selected (the default state), a dialogue box will give you the option to Save or Open the downloaded citation data. Choosing Open will either launch your citation manager or give you a choice of applications with which to use the metadata. The Save option saves the file locally for later use.
Indirect Import: When the Indirect Import option is selected, the metadata is displayed and may be copied and pasted as needed.
About This Article
Copyright

Data & Comments
Data
0


Comments
Comments must be written in English. Spam, offensive content, impersonation, and private information will not be permitted. If any comment is reported and identified as inappropriate content by OAE staff, the comment will be removed without notice. If you have any queries or need any help, please contact us at [email protected].