

fig4
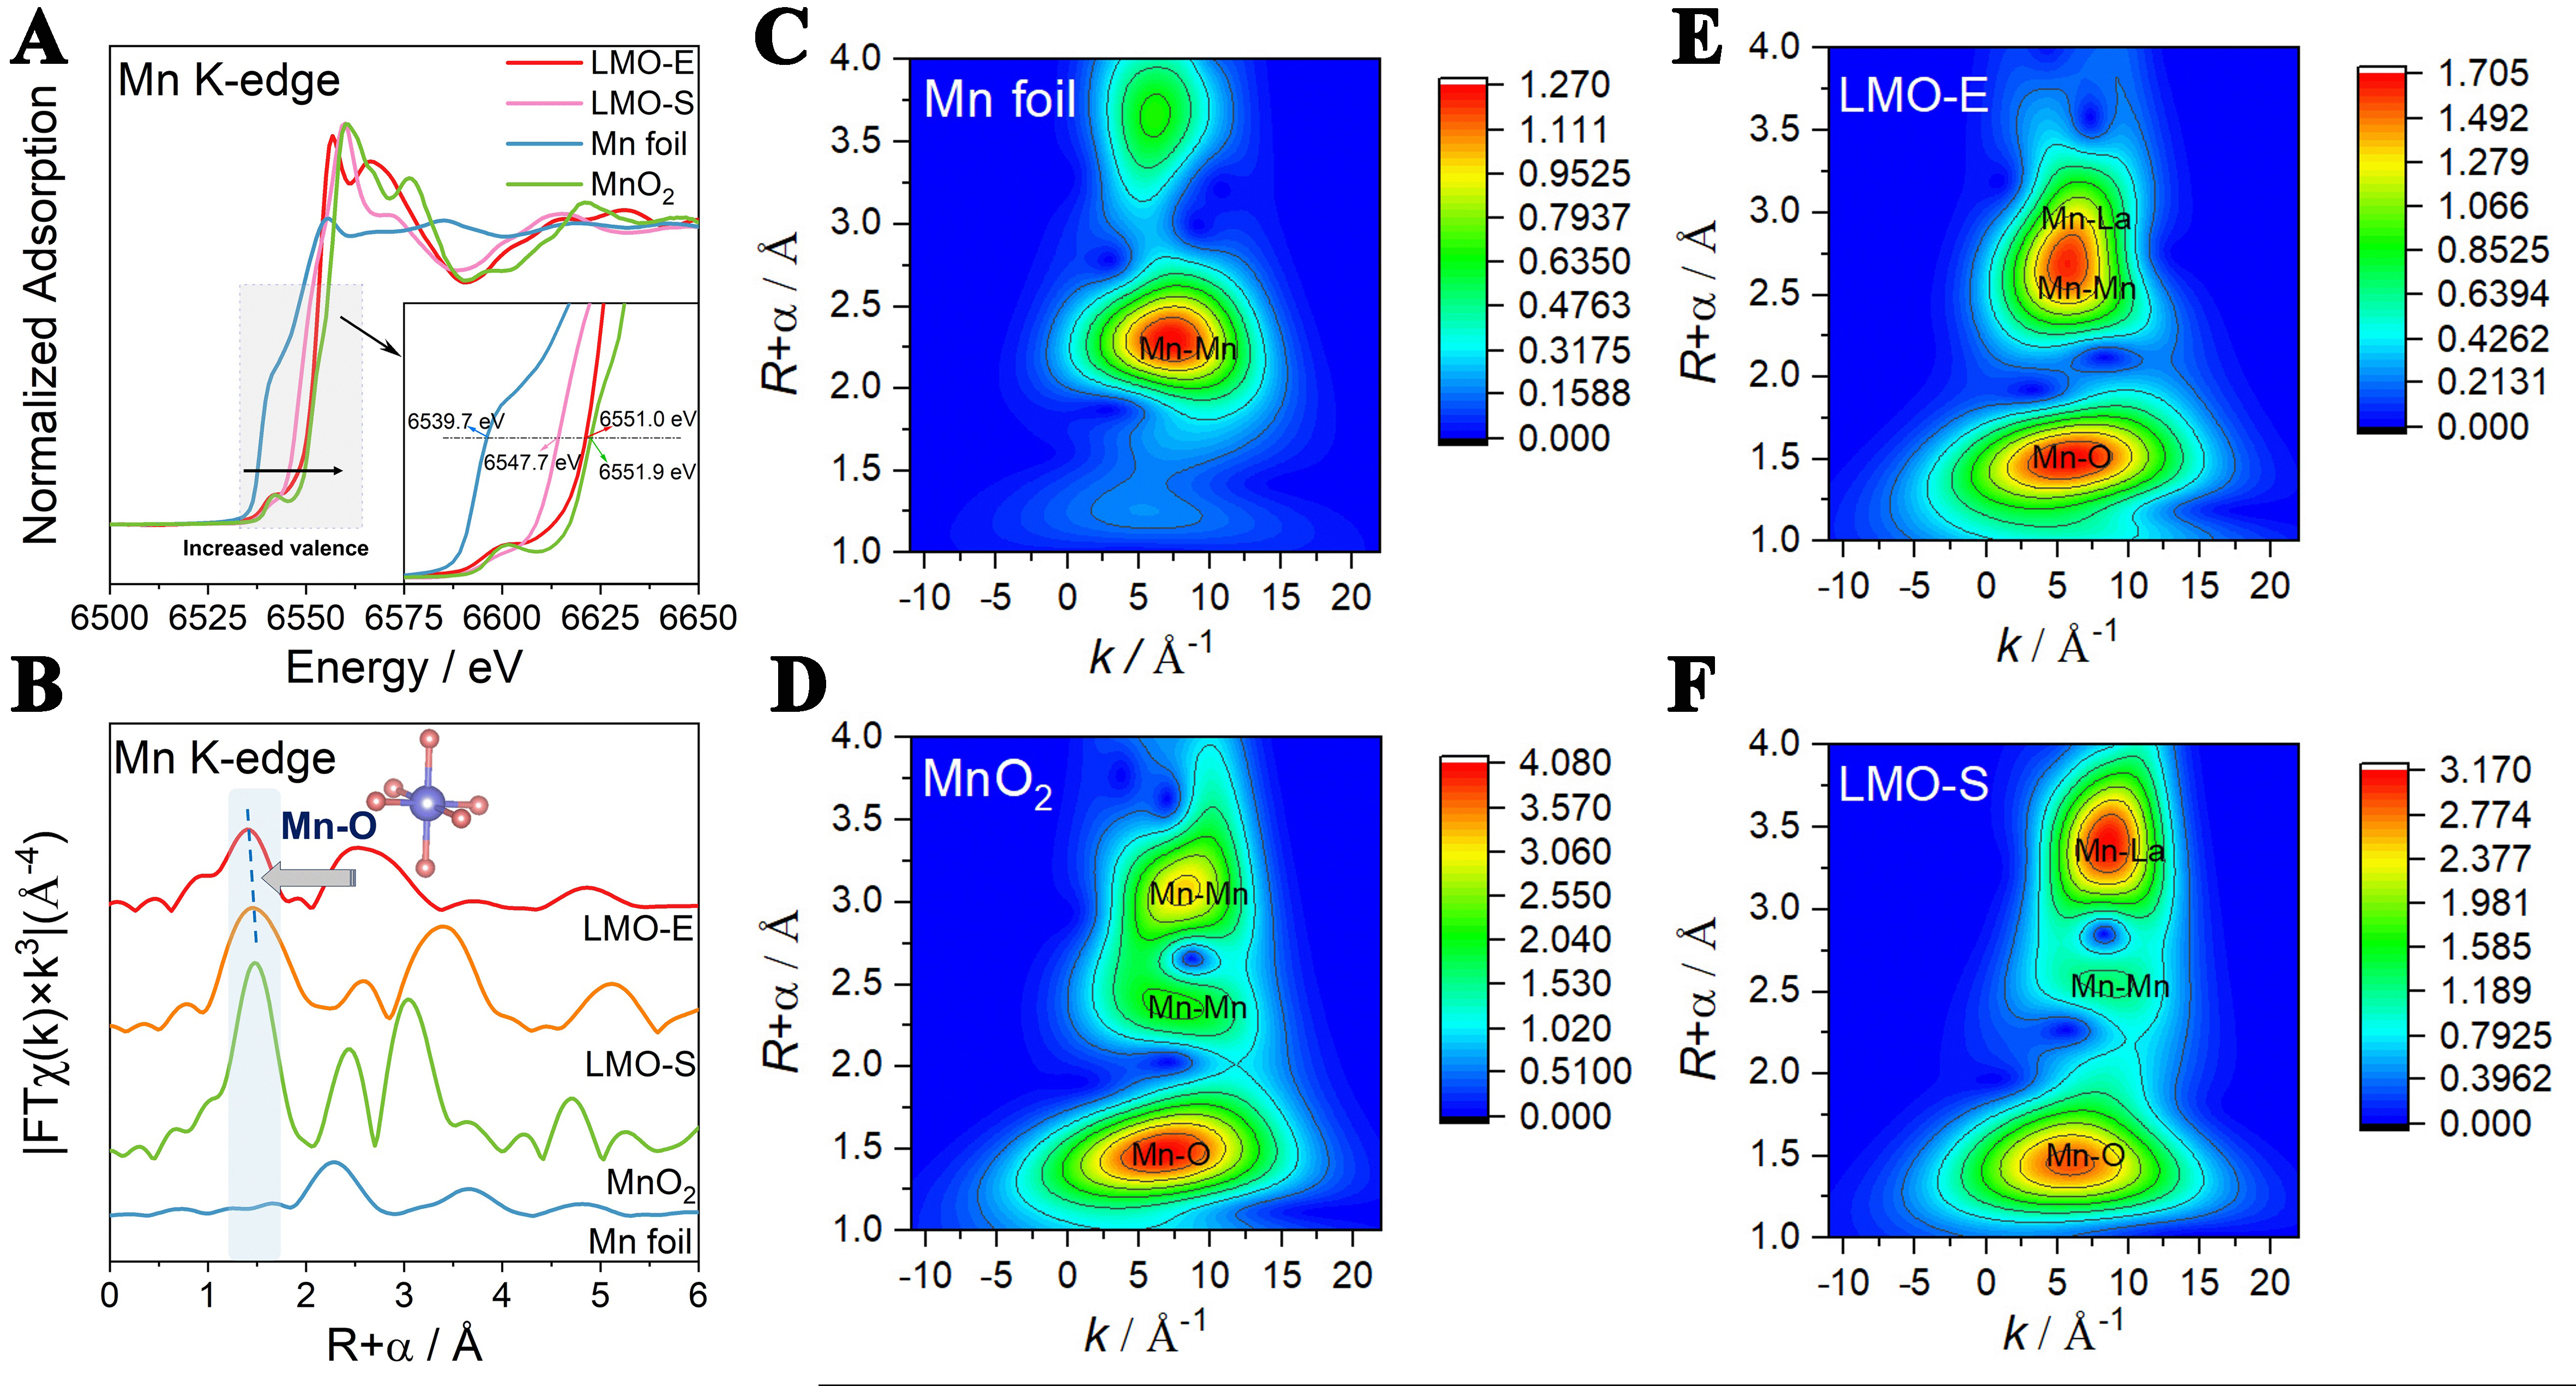
Figure 4. (A) Mn K-edge XANES, (B) the R-space Fourier-transformed FT [k3χ(k)] of Mn K-edge EXAFS profiles recorded for LMO-S and LMO-E catalysts. The purple and orange spheres denote Mn and O atoms, respectively; WT plots at the Mn K-edge of (C) Mn foil, (D) MnO2, (E) LMO-E and (F) LMO-S. XANES: X-ray absorption near-edge structure; FT: Fourier transform; EXAFS: extended X-ray absorption fine structure; LMO-S: LaMnO3 prepared by the sol-gel method; LMO-E: LaMnO3 prepared by the “top down” method; WT: wavelet transforms.


