

fig2
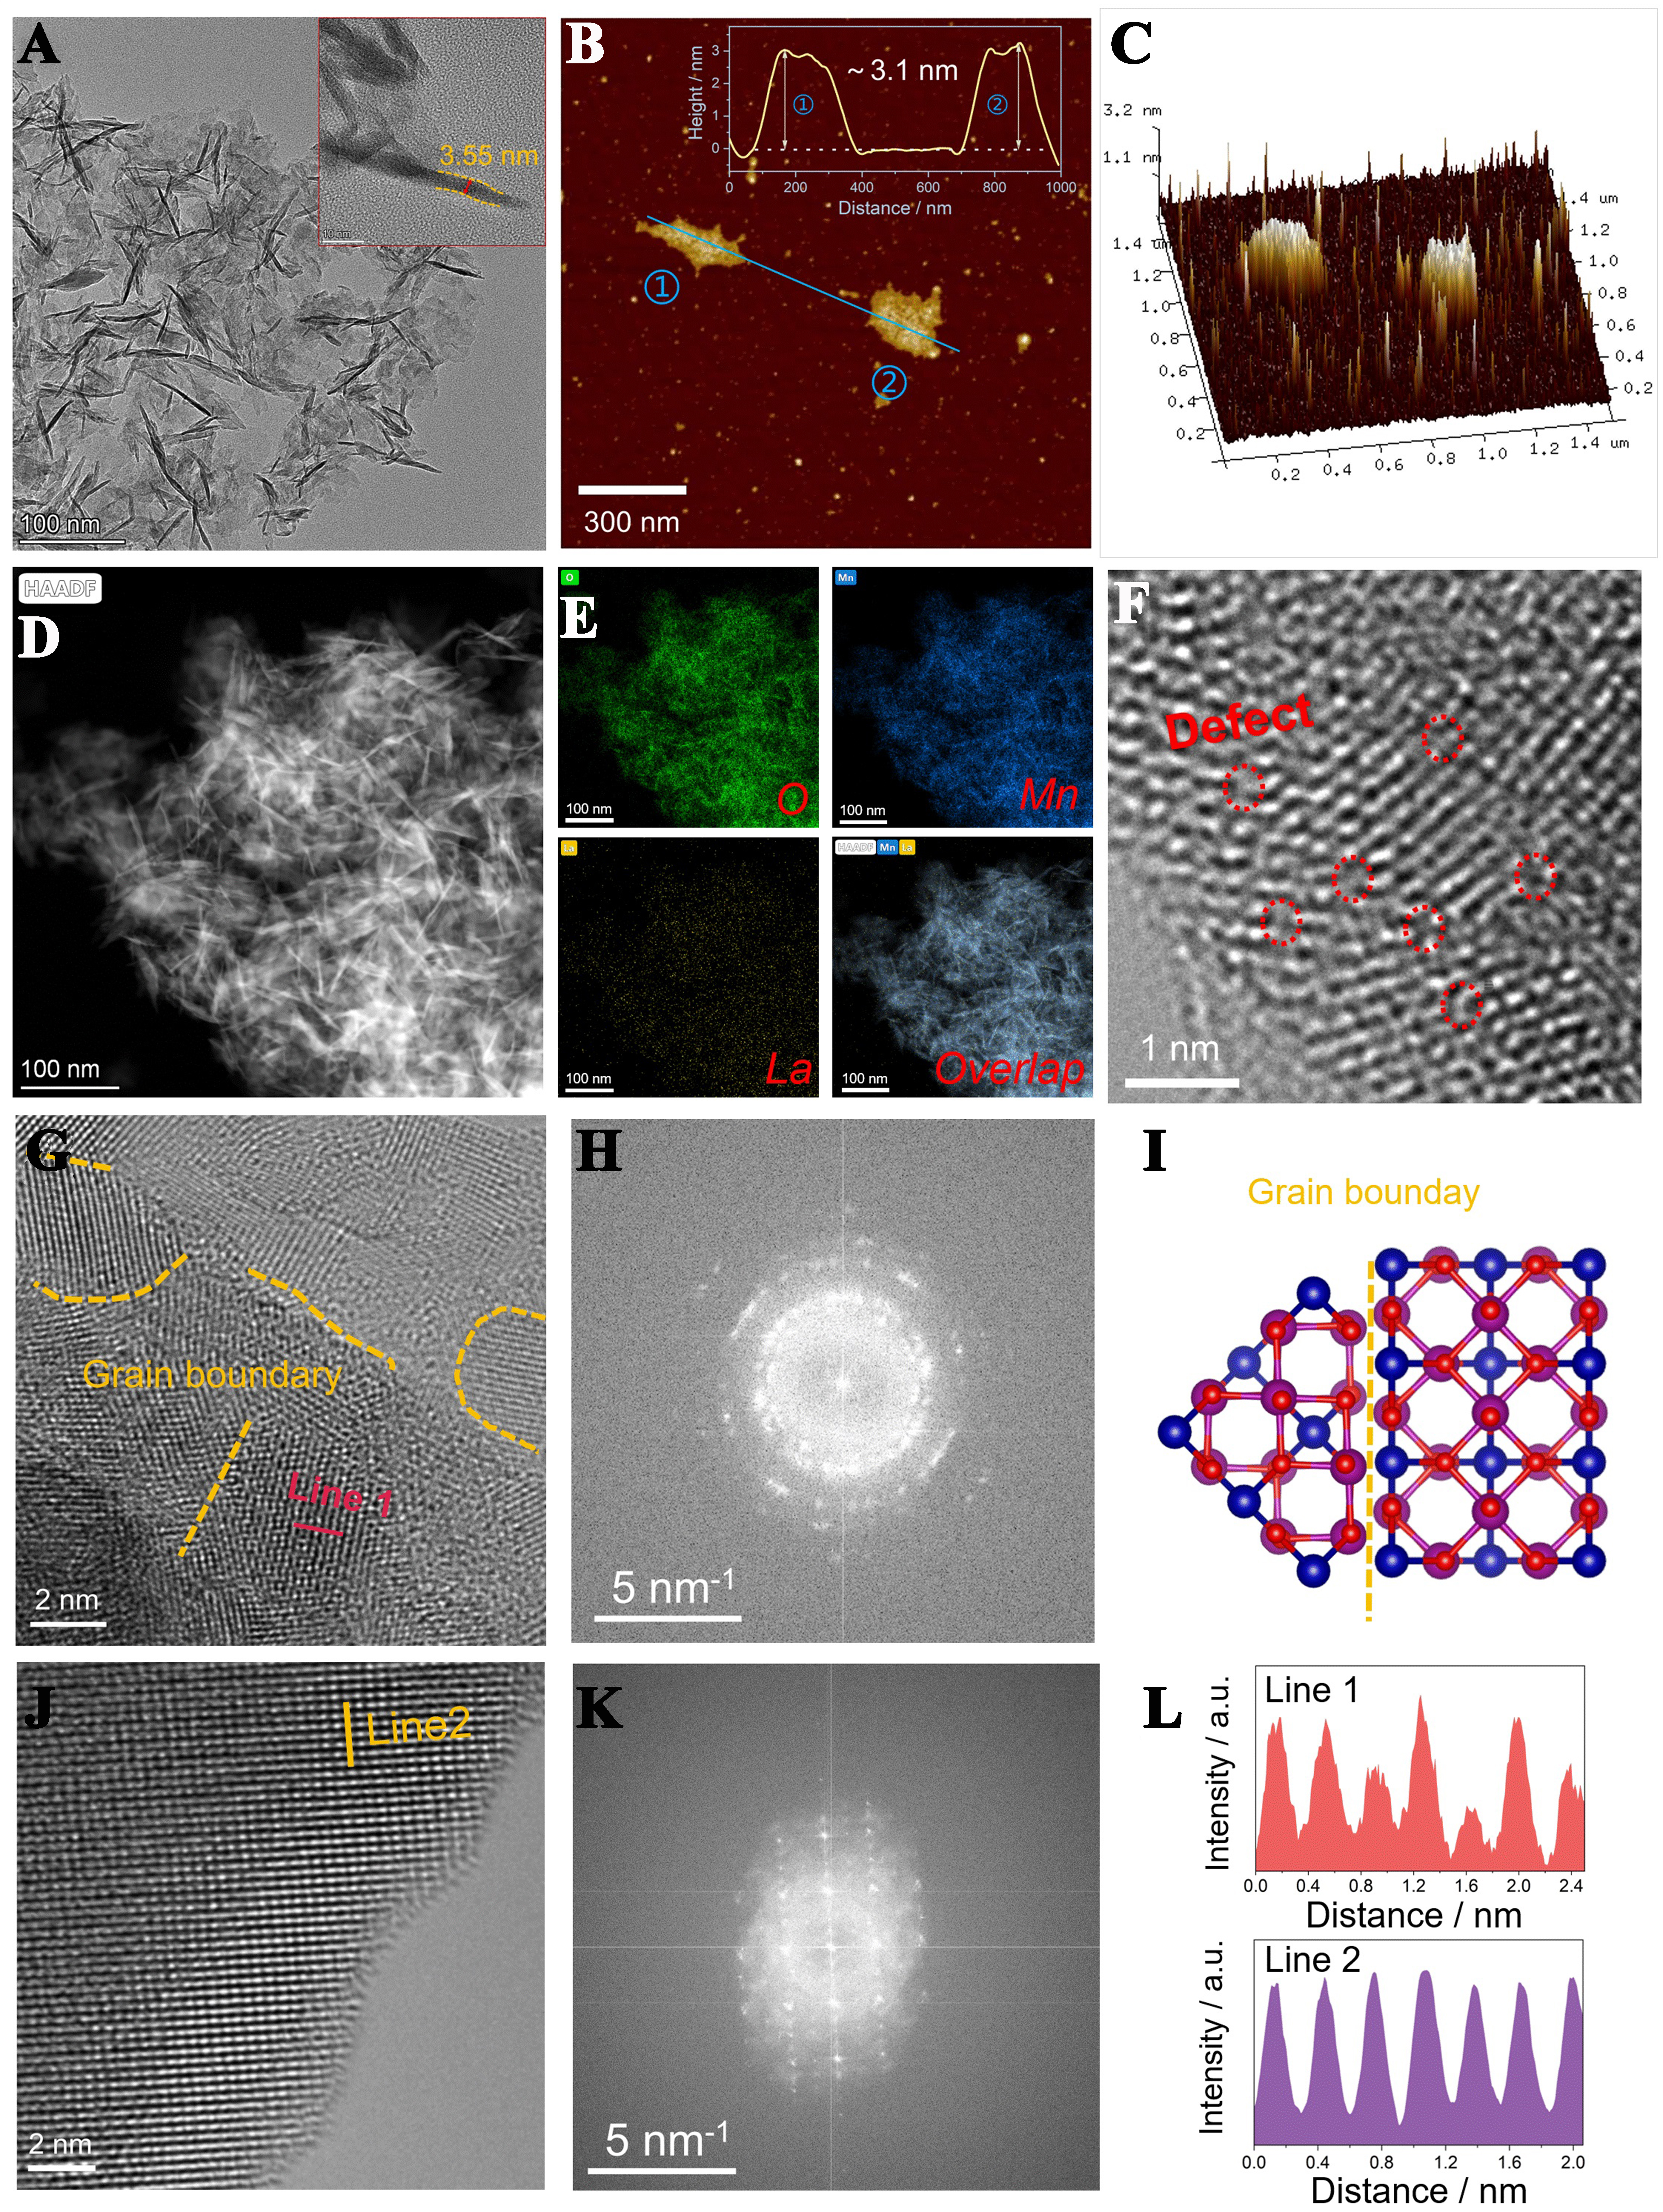
Figure 2. Surface morphology and microstructure of LaMnO3. (A) TEM, (B and C) AFM, (D and E) EDX mappings; (F-H) AC-HAADF STEM images and (I) imaged lattice distribution of the LMO-E. The blue, purple, and red spheres denote La, Mn, and O atoms, respectively; (J and K) AC-HAADF STEM images of the LMO-S; (L) Line intensity profiles of LMO-E and LMO-S. TEM: Transmission electron microscopy; AFM: atomic force microscopy; EDX: energy-dispersive X-ray spectroscope; AC-HAADF STEM: aberration-corrected high-angle-annular-dark-field scanning transmission electron microscopy; LMO-E: LaMnO3 prepared by the “top down” method; LMO-S: LaMnO3 prepared by the sol-gel method.


