

Decarbonizing China's grid: provincial grid carbon footprint factors and export-embedded electricity emissions from 2020 to 2060
 0
0 Abstract
Quantifying the dynamic evolution of grid carbon footprint factors (GCFFs) is crucial for evaluating electricity-related emissions and advancing China’s dual-carbon goals. This study develops a dynamic model for 30 provinces covering 2020-2060 under three renewable energy development scenarios. Results reveal substantial spatial heterogeneity: between 2020 and 2022, hydropower-rich provinces such as Sichuan and Yunnan maintained GCFF values more than 70% below the national average, whereas coal-dependent regions including Shanxi and Inner Mongolia remained over 40% higher. Under the “Ambitious renewable energy development” scenario (S2), the national average GCFF in 2060 declines by 4.53% relative to the “Business as usual” scenario (representing a 6.22% decrease relative to the “Conservative renewable energy development” (S1) scenario), with reductions exceeding 80% in Jilin and Hainan. Export-sector analysis shows that aluminum-related electricity emissions are highly sensitive to power decarbonization (62% reduction in Shandong under the S2 scenario), while cement emissions are primarily demand-driven. This study establishes the first long-term coupling framework of provincial GCFFs with export-sector emissions, incorporating both non-fossil electricity and upstream extraction. The findings provide a high-resolution evidence base for subnational carbon accounting and targeted low-carbon transition strategies.
Keywords
INTRODUCTION
In alignment with the Paris Agreement's objective to limit global mean temperature rise to within 1.5 °C[1,2], the Chinese government has established ambitious dual-carbon goals: peaking carbon emissions before 2030 and achieving carbon neutrality by 2060[3]. The electricity sector, as a significant contributor to national emissions, accounted for approximately 38.00% to 50.10% of China's total carbon dioxide (CO2) emissions between 2010 and 2020, with coal-fired electricity generation consuming 41.53% to 52.66% of the country's coal resources[4]. Moreover, the Carbon Border Adjustment Mechanism (CBAM) introduced by the European Union (EU) - scheduled to be implemented in 2026[5] - is anticipated to engender mounting compliance challenges for China's export-oriented industries[6], wherein electricity represents a substantial source of indirect emissions[7,8]. Against this backdrop, China has actively pursued the phase-out of outdated coal-fired capacity while accelerating the deployment of non-fossil energy sources such as wind, solar, and hydro[9]. However, these transitions are accompanied by challenges in ensuring electricity supply security and maintaining grid stability[10,11]. Therefore, establishing a robust and systematic regional electricity carbon footprint accounting framework is essential for optimizing the electricity generation structure, enhancing emission reduction efficiency, and strengthening China's capacity to adapt to global carbon governance regimes and maintain export competitiveness.
In parallel, China has promulgated a series of national policy documents and regional energy plans to steer the low-carbon transition of its power system. For instance, the 14th Five-Year Plan for Modern Energy System[12] and the 14th Five-Year Plan for Renewable Energy Development[13] stipulate that by 2025, non-fossil energy will account for approximately 20% of primary energy consumption and 39% of total electricity generation, with electricity representing around 30% of final energy use. By 2030, the share of non-fossil energy in primary consumption is expected to reach 25%. Complementarily, policy guidelines issued by the National Development and Reform Commission (NDRC) and the National Energy Administration (NEA) - such as the Guiding Opinions on Accelerating the Construction of a Unified National Electricity Market System[14] and the Opinions on Improving the Institutional Mechanisms and Policy Measures for Green and Low-Carbon Energy Transition[15] - emphasize interprovincial power dispatch and mechanisms for renewable energy integration. At the subnational level, provinces have released tailored 14th Five-Year Energy Development Plans. For example, Inner Mongolia[16] and Gansu prioritize[17] the construction of large-scale wind-solar hybrid bases, while the Yangtze River Delta and Pearl River Delta regions accelerate clean electricity imports and strengthen regional grid coordination[18,19]. Collectively, these policy documents and regional strategies not only delineate concrete pathways toward China’s dual-carbon targets but also provide critical institutional and practical foundations for understanding the dynamic evolution of provincial grid carbon footprint factors (GCFFs).
Notably, as the electrification of end-use sectors[20] accelerates and energy systems undergo deep decarbonization, electricity has emerged as a key energy carrier driving carbon mitigation across multiple industries[21,22]. In this context, the accuracy of indirect emission accounting from electricity consumption becomes increasingly critical[23]. The GCFF, which quantifies the carbon emissions embedded per unit of electricity delivered, serves as a fundamental parameter for assessing indirect emissions in sectors such as buildings, industry, and transportation[24-27]. Despite the publication of multiple datasets providing national- and regional-level emission factors[28-30], extant provincial-level studies in China remain limited, particularly with regard to spatial granularity, data resolution, and temporal dynamics[31]. Moreover, the majority of extant GCFF estimates have concentrated predominantly on fossil-based electricity[32], thus disregarding the life cycle carbon emissions associated with non-fossil energy sources and upstream mining processes. As China's electricity structure continues to shift toward non-fossil generation in line with the dual-carbon goals[33], failing to incorporate such emission sources risks underestimating the actual indirect carbon footprint and misguiding mitigation efforts in emission-intensive sectors subject to mechanisms such as the EU's CBAM[5]. Therefore, it is essential to develop a comprehensive provincial-level GCFF framework that integrates both fossil and non-fossil electricity generation, as well as upstream resource extraction, to address current accounting discrepancies and facilitate accurate product-level carbon footprint assessments and effective policy formulation.
In recent years, the accounting and projection of GCFFs have become focal points in research on the low-carbon transition of the electricity sector[34,35]. Existing studies have explored various aspects of carbon emissions in electricity systems, including electricity structure optimization[36] and time-varying electricity emission factors[25]. One group of studies focuses on the life cycle carbon emissions of specific electricity sources (e.g., wind[37] and solar[38]), or evaluates emission factors at the scale of individual provinces[39] or electricity plants[40], often with limited temporal coverage (typically less than a decade), making it difficult to capture long-term trends or spatial heterogeneity. Another stream of research employs energy system optimization models to forecast future electricity mix trajectories under different policy scenarios and assess their carbon implications[41-43], yet these are predominantly conducted at the national or regional level, lacking provincial granularity. Additionally, some efforts apply graph attention network or neural network methods to predict emission factor trends[44,45]; however, such forecasts are often short-term in nature and insufficiently account for system-wide emissions from non-fossil electricity and upstream processes. Therefore, there remains an urgent need for a comprehensive, long-term, and province-level GCFF accounting and forecasting framework that encompasses all major electricity sources. This is essential for informing multi-level decarbonization strategies and supporting the refinement of product carbon footprint evaluation systems.
In this study, we develop a nationwide dynamic evolution model to dynamically estimate provincial GCFFs and electricity emissions from major export products in China over the period from 2020 to 2060, fully accounting for spatial heterogeneity, long-term evolution, and sectoral linkages. The major innovations of this study can be divided into the following three aspects: (1) A dynamic modeling system is established that encompasses 30 provinces, spans four decades, and incorporates diverse renewable energy development trajectories, enabling multi-scenario projections of provincial GCFF evolution; (2) Compared to existing literature, this study systematically integrates various electricity generation structures and energy transition pathways, with special emphasis on the coordinated development of non-fossil energy sources, the transformation of coal-fired electricity, and carbon emissions from upstream resource extraction - greatly enhancing the completeness and accuracy of GCFF estimation; and (3) For the first time, provincial GCFFs are coupled with trade and production data of energy-intensive export sectors, such as steel, cement, and aluminum, to quantify indirect electricity emissions. This reveals critical regional and product-level disparities in the electricity-driven carbon footprint. Moreover, the model provides a high-resolution, spatially explicit analytical tool for evaluating low-carbon transition strategies in export-oriented industries under varying technology, policy, and product structure scenarios.
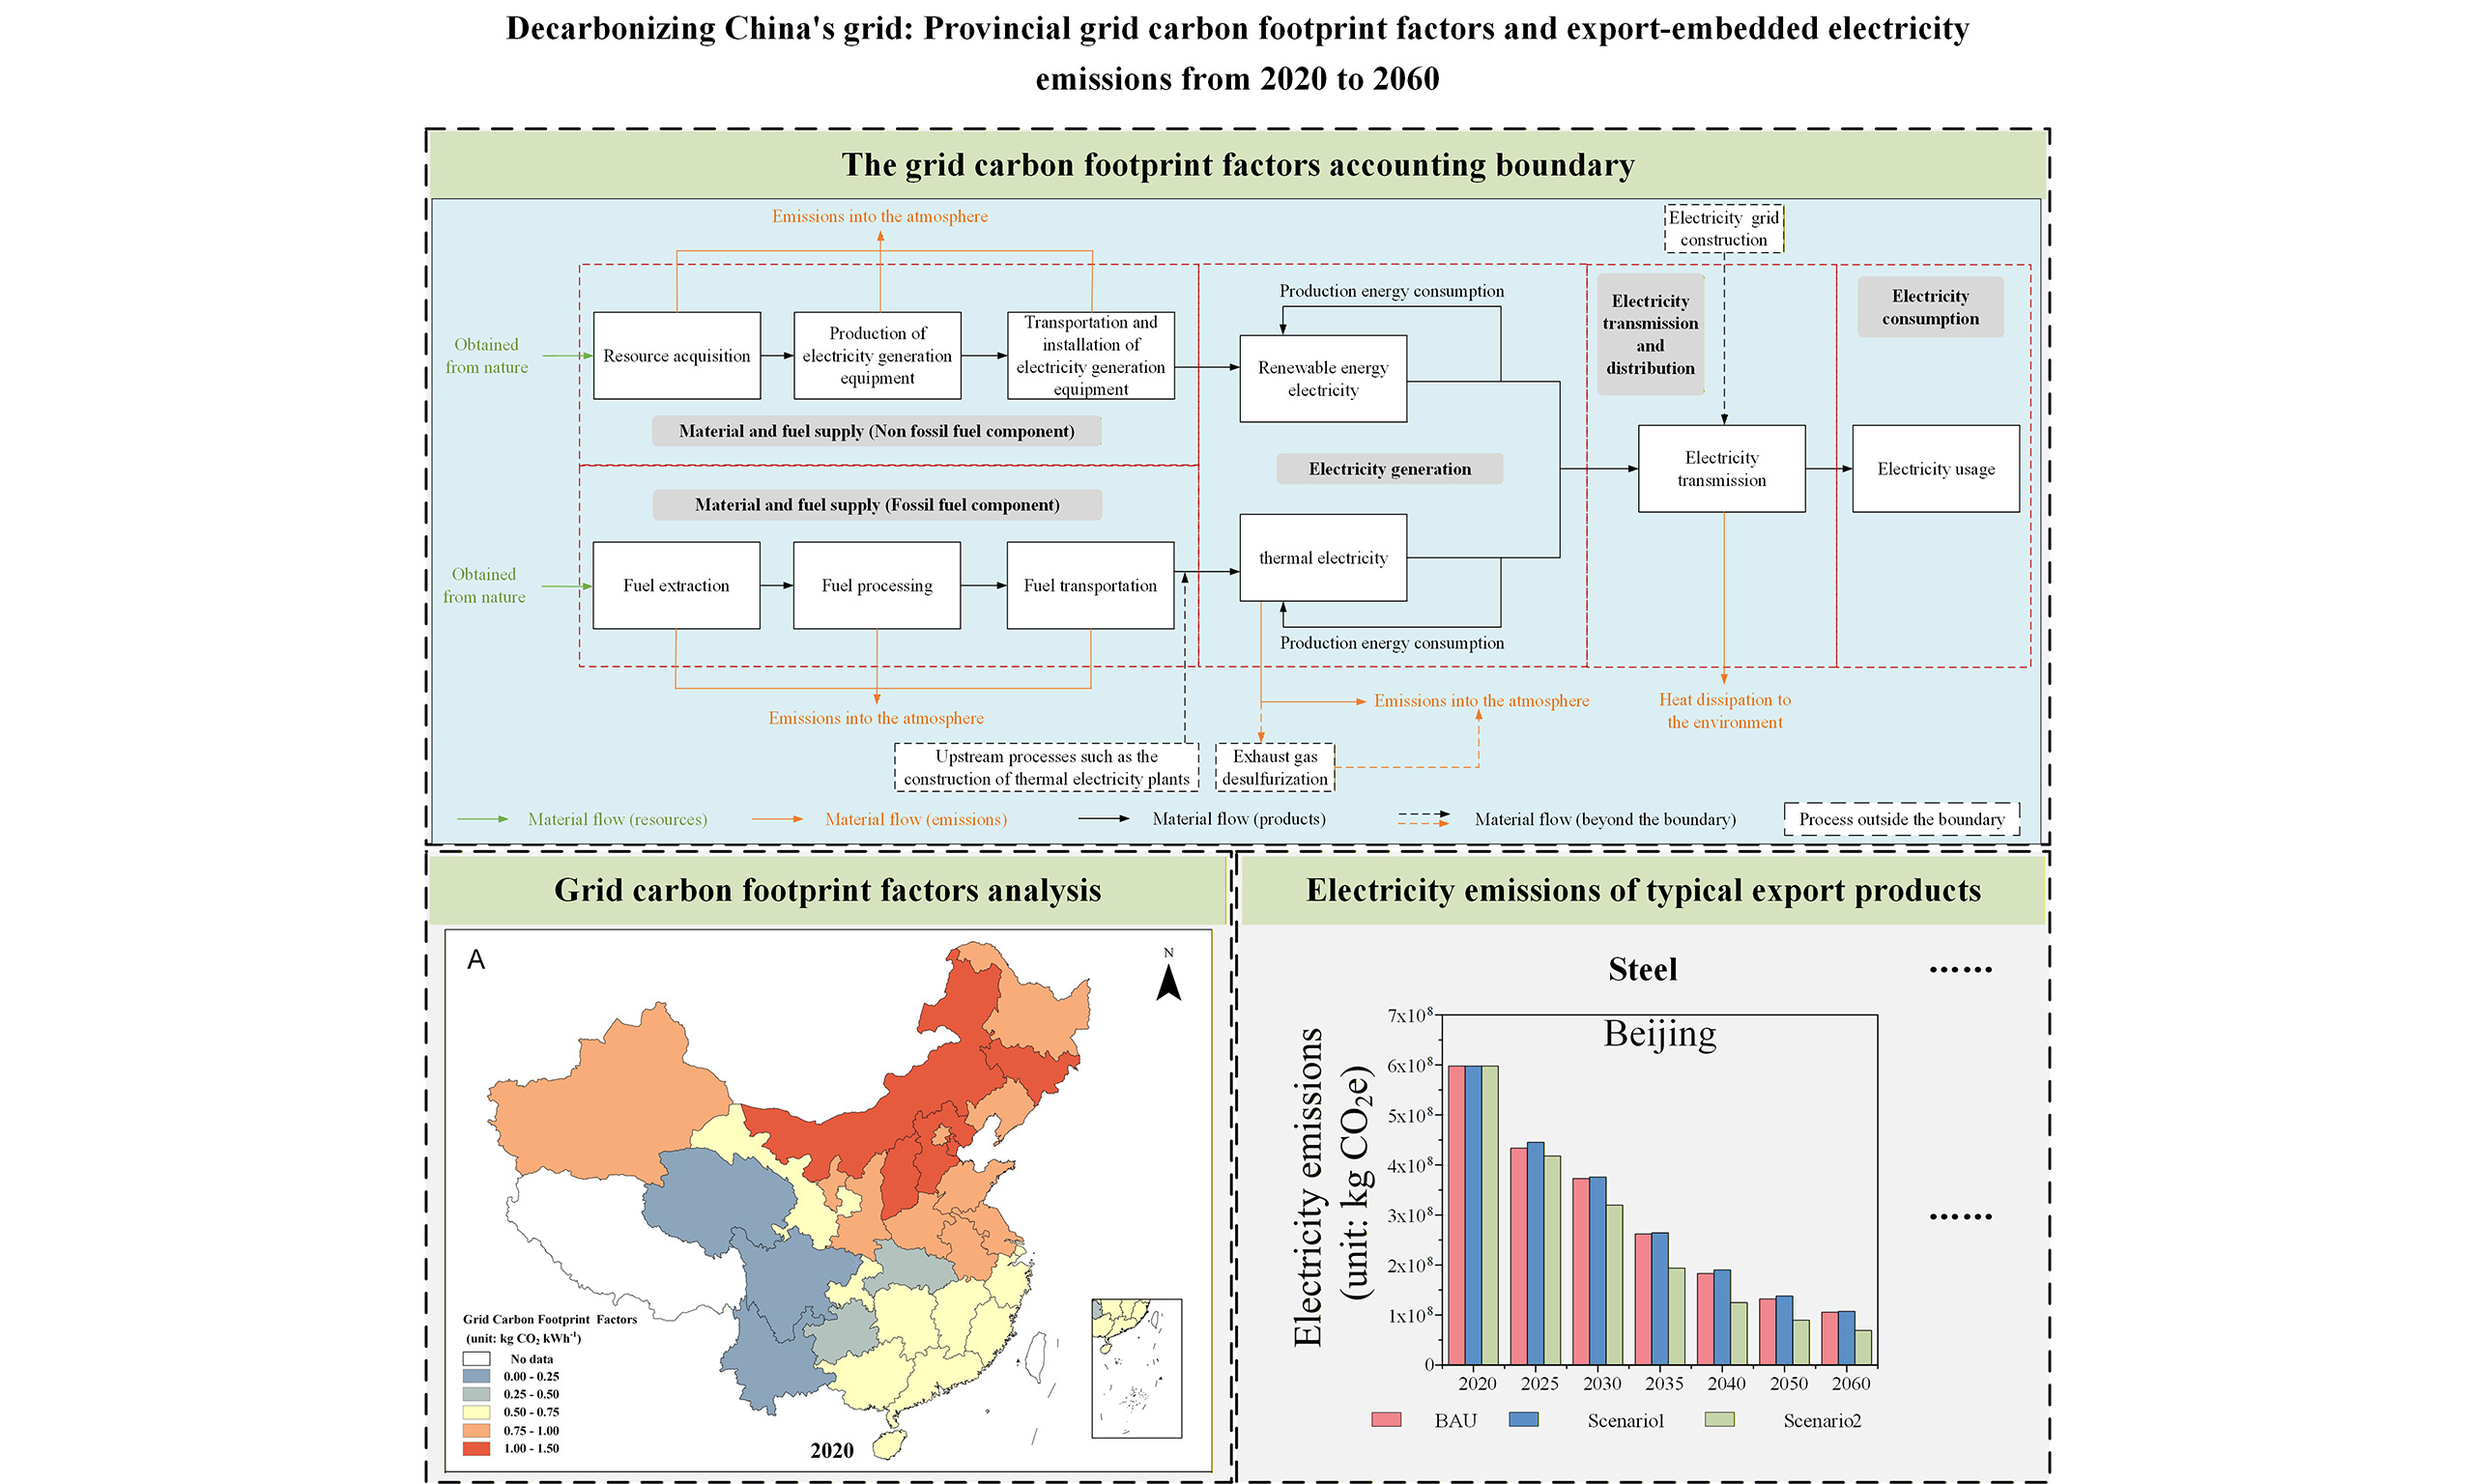
The general framework for analysis is illustrated in Figure 1, and the remainder of this paper is organized as follows: Section "METHODOLOGY AND DATA" presents the simulation framework for estimating GCFFs, including the underlying model structure, data sources, and scenario design. Section "RESULTS AND DISCUSSION" analyzes the spatiotemporal evolution of provincial GCFFs across different scenarios from 2020 to 2060 and further investigates the role of electricity emissions in shaping the carbon footprints of typical export products. Finally, Section "CONCLUSION AND OUTLOOK" concludes the study and outlines key avenues for future research and methodological refinement.
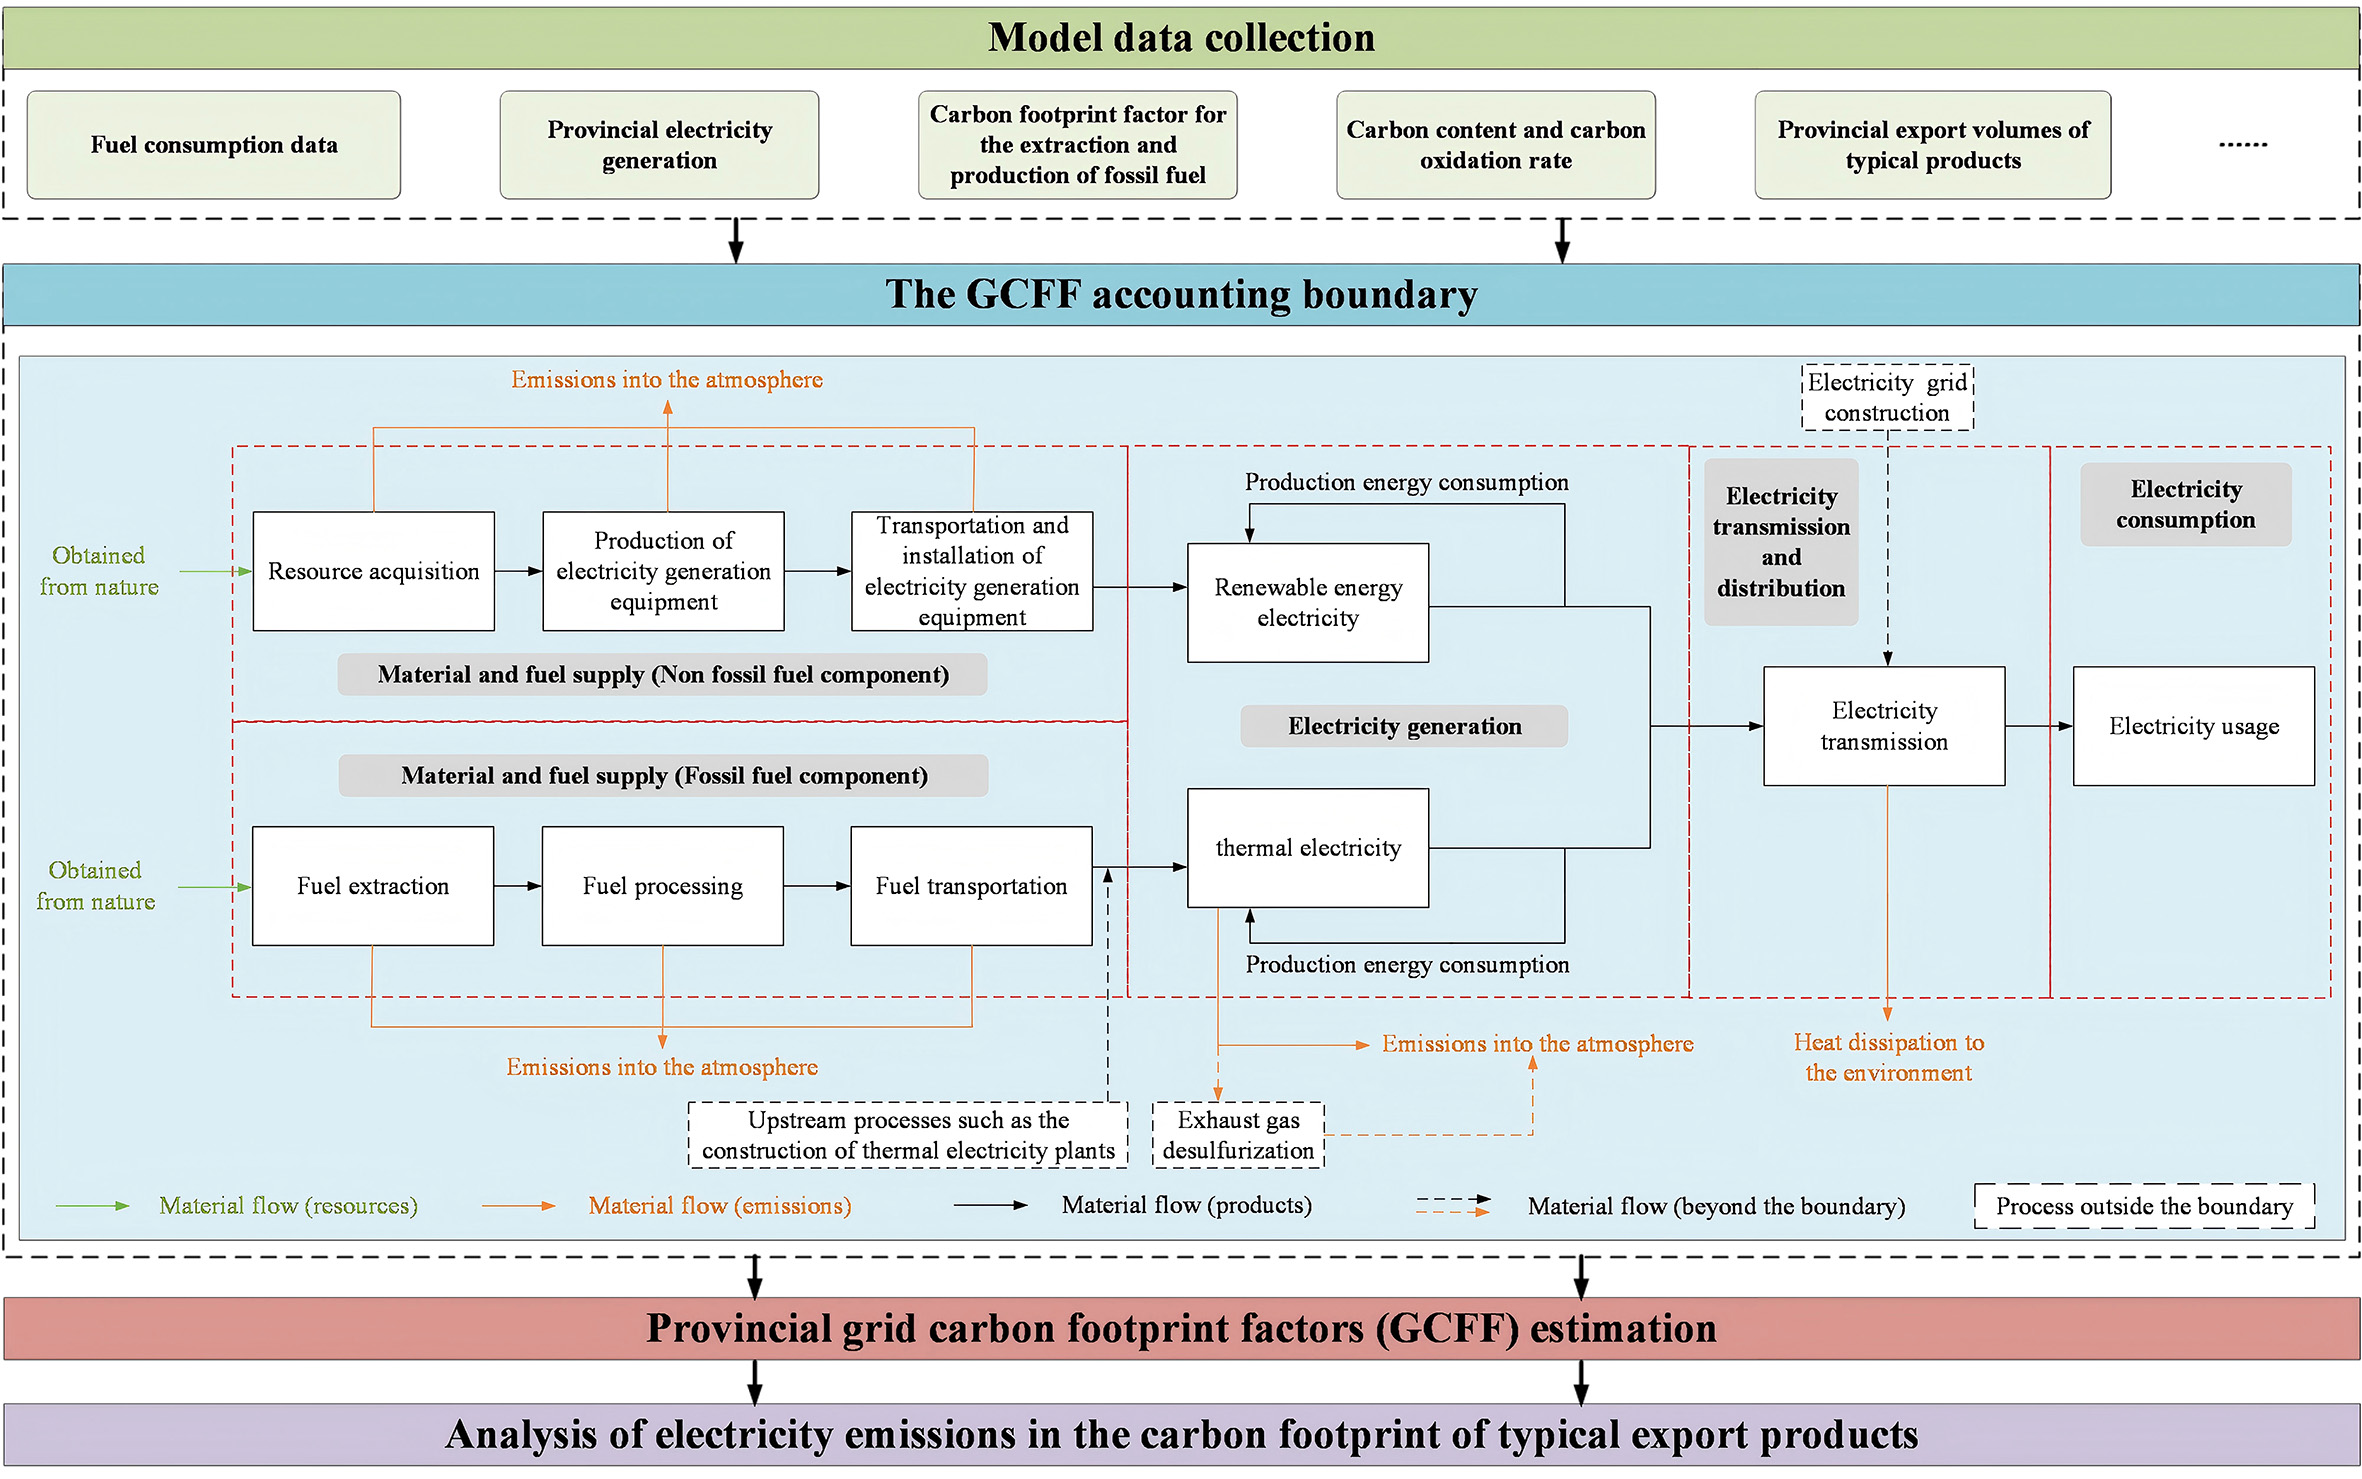
Figure 1. General framework for analysis.
METHODOLOGY AND DATA
To comprehensively evaluate the carbon footprint of the electricity system, the life cycle of electricity is delineated along the material flow pathway into four sequential stages[46,47] (as depicted in Figure 1): (1) material and fuel supply; (2) electricity generation; (3) electricity transmission and distribution; and (4) electricity consumption. However, in this study, the GCFF covers only stages (1) and (2)[4], and accounts for major greenhouse gases, including CO2, methane (CH4), and nitrous oxide (N2O), expressed in carbon dioxide equivalent per electricity generation (kg CO2e kWh-1). It is worth noting that this study uses the CO2 equivalent (CO2e) metric to measure carbon emission levels in accordance with the Intergovernmental Panel on Climate Change (IPCC) Guidelines[48,49] and the “Greenhouse gases - Carbon footprint of products - Requirements and guidelines for quantification” issued by the Chinese Ministry of Ecology and Environment[50]. This ensures methodological consistency and international comparability. Although CH4 and N2O contribute a smaller absolute share, their high global warming potentials make their inclusion essential to avoid systematic underestimation of electricity-related carbon footprints[51].
In the material and fuel supply stage, emissions are categorized into two components: fuel-cycle emissions associated with the extraction and processing of fuels, and non-fuel-cycle emissions related to infrastructure construction. Fuel-cycle emissions are only applicable to fossil-fuel-based electricity (e.g., coal, oil, natural gas), while emissions from fuel transport are excluded due to data unavailability. Non-fuel-cycle emissions for thermal electricity plants (e.g., from construction and decommissioning) are excluded, given their minimal contribution (approximately 0.14% of total emissions). For non-fossil electricity sources - wind, hydro, nuclear, and solar - only non-fuel-cycle emissions are included, covering the entire life cycle of equipment manufacturing, plant construction, operation and maintenance, and end-of-life treatment. In the electricity generation stage, this study refers to the Guidelines for Accounting and Reporting of Enterprise Greenhouse Gas Emissions for Power Generation Facilities issued by the Chinese Ministry of Ecology and Environment[52], and excludes emissions from flue gas desulfurization, which account for approximately 3.28% of total generation emissions. For the transmission and distribution stage, emissions from grid construction and operation are omitted due to the lack of consistent emission factors. No greenhouse gas emissions are associated with the end-use electricity consumption stage.
In particular, this study establishes a three-tier framework that integrates a top-down emissions accounting approach with a bottom-up spatial allocation strategy. (1) At the national level, the average GCFF is calculated by incorporating both domestic electricity generation and electricity imports, using a hybrid methodology that combines combustion-based emissions from fossil fuels with life cycle emissions from renewable sources. (2) At the regional level, the national GCFF is downscaled by capturing the spatial heterogeneity of electricity supply across China’s seven major regional grids, considering both local generation mixes and interregional electricity dispatch. (3) At the provincial level, further refinement is achieved by incorporating interprovincial electricity flows. In provinces facing electricity deficits, residual demand is allocated using the marginal emissions of their affiliated regional grids. The definitions of regions and provinces follow the official classification provided in the Announcement by the Ministry of Ecology and Environment and the National Bureau of Statistics on the Release of Carbon Dioxide Emission Factors for Electricity in 2021[53]. Ultimately, provincial GCFFs are linked with product-specific electricity intensities to enable precise spatial attribution of embodied emissions in export-oriented trade.
Grid carbon footprint factors
National grid carbon footprint factors
To quantify the national average GCFF, this study integrates emissions from both domestic electricity generation and imported electricity. The national GCFF is defined as the ratio of total carbon emissions associated with electricity generation and cross-border electricity imports to the sum of domestic electricity generation and imported electricity, as given in[53]
where EFn represents the national average GCFF (unit: kg CO2e kWh-1); Emn is the carbon emissions from national electricity generation (unit: kg CO2e), as calculated using Equation (2) (see below); En indicates the national total electricity generation (unit: kWh); EFk is the carbon footprint factor for electricity generation in country k (unit: kg CO2e kWh-1); Eimp,k means the net exports of electricity from country k to China (unit: kWh); in the subscripts, “imp” denotes imports, “k” denotes the country that exports electricity to China, and “n” denotes the nation.
The domestic electricity generation carbon emissions Emn are calculated by aggregating emissions from the five main sources of electricity generation: thermal, hydro, nuclear, wind, and solar. For thermal electricity, emissions are derived from both fuel upstream processes (extraction and processing) and combustion emissions[53]. For non-fossil electricity sources, emissions are calculated using life cycle emission factors specific to each technology and multiplied by actual generation volumes, as determined by[50]
where FCn,m is the consumption of fossil fuel m for thermal electricity (unit: kg or m3); NCVm represents the average low-level heat generation from fuel m (unit: GJ/kg or GJ/m3); EFep,m is the CO2 emission factor for the extraction and production of fossil fuel m (unit: kg CO2e kg-1 or kg CO2e m-3); EFc,m is the CO2 emission factor for the combustion of fossil fuel m (unit: kg CO2e/TJ), as calculated using Equation (3) (see below);
Specifically, the EFc,m can be defined as[53]:
where CCm represents the carbon content per unit calorific value of the fossil fuel m (unit: kg C/TJ); OFm represents the carbon oxidation rate of fossil fuel m (unit: %); 44/12 is the carbon to CO2 conversion factor.
Regional grid carbon footprint factors
To account for spatial heterogeneity in electricity supply and trade across China's extensive grid infrastructure, the national GCFF is further disaggregated into regional-level GCFF, as defined in[53]
where EFr,i represents the average GCFF for regional grid i (unit: kg CO2e kWh-1); Emr,i denotes the carbon emissions from electricity generation within the geographic area covered by regional grid i (unit: kg CO2e), as calculated using Equation (5) (presented below); EFr,g is the carbon footprint factor of regional grid g that sends net electricity to regional grid i (unit: kg CO2e kWh-1); Eimp,g,i indicates the net transfer of electricity from regional grid g to regional grid i (unit: kWh); EFk is the carbon footprint factor of country k that sends net electricity to regional grid i (unit: kg CO2e kWh-1); Eimp,k,i indicates the net transfer of electricity from country k to regional grid i (unit: kWh); Er,i,q signifies the annual amount of grid-connected electricity generated by electricity plants applying technology type q in the geographical area covered by regional grid i (unit: kWh); in the subscripts, “i" denotes the regional grid including Northeast, North China, East China, Central, Southwest, Northwest, and Southern, “g” denotes the regional grid that sends net electricity to regional grid i, “k” denotes the country that sends net electricity to regional grid i, and “r” denotes the region.
The regional generation emissions Emr,i are calculated following the same hybrid approach as in the national-level accounting, as given in[50]
where FCr,i,m is the consumption of fossil fuels m for thermal electricity generation within the geographical area covered by regional grid i (unit: kg or m3); Er,i,q represents the grid-connected electricity from hydro, wind, nuclear and solar electricity plants in regional grid i (unit: kWh); other variable definitions are consistent with those in Section "National grid carbon footprint factors".
Provincial grid carbon footprint factors
Utilizing the findings of the regional-level analysis, the GCFF is further downscaled to the provincial level, encompassing all 30 provincial administrative regions in mainland China, as expressed in[53]
where EFp represents the GCFF for province p (unit: kg CO2e kWh-1); Emp represents the carbon emissions from electricity generation within the geographic area covered by province p (unit: kg CO2e), as calculated using Equation (5); EFh is the carbon footprint factor of province h that sends net electricity to province p (unit: kg CO2e kWh-1); Eimp,h,p indicates the net transfer of electricity from province h to province p (unit: kWh); EFk is the carbon footprint factor of country k that sends net electricity to province p (unit:
Furthermore, in provinces experiencing electricity deficits, where total consumption exceeds the sum of local generation and known interprovincial or international imports, residual electricity is assumed to originate from the affiliated regional grid. This constraint is expressed as[53]
where Eu,p is the total annual electricity consumption of the whole society in province p (unit: kWh); in the subscripts, “u” denotes the use.
Electricity emissions in the carbon footprint of typical export products
Based on the high-spatiotemporal-resolution provincial GCFF, the electricity emissions in the carbon footprint of typical export products were further estimated. These emissions capture the contribution of electricity to the overall carbon footprint of export goods and are essential for accurately assessing the carbon intensity of regional product supply chains, as defined in[50]
where EEp represents the electricity emissions in the carbon footprint of typical export products for province p (unit: kg CO2e); EVp,t is the total export volume of product t from province p (unit: kg); ETt is the electricity intensity of product t, defined as electricity consumed per unit mass of product (unit:
Data sources, scenario settings and sensitivity analysis
The foundational datasets employed in this study were compiled from the following sources: (1) Fuel consumption data for electricity generation (FCn,m) were derived from the China Energy Statistical Yearbook 2023[54]; (2) Provincial electricity generation by source - including thermal, hydro, nuclear, wind, and solar electricity (Ep,q) - as well as interprovincial electricity exchanges (Eimp,h,p), electricity imports and exports
Moreover, three alternative scenarios are constructed to explore the implications of varying levels of renewable energy development on future electricity emissions. The “Business as usual” (BAU) scenario reflects a moderate pathway where renewable energy expands steadily under current policy trajectories, with national renewable electricity potential remaining within a realistically achievable range, based on prior assessments[57]. In contrast, the “Conservative renewable energy development” (S1) scenario assumes more constrained renewable deployment due to technical, financial, or institutional limitations, while the “Ambitious renewable energy development” (S2) scenario envisions accelerated expansion driven by stronger policy incentives and rapid technological advancements. The scenario design follows the framework of IPCC-aligned models[59] (as listed in Supplementary Table 1). To isolate the effect of electricity mix transformation, provincial electricity demand is held constant across all three scenarios.
To evaluate the robustness of scenario projections, a sensitivity analysis was conducted using the fossil energy decline rate (n) as a key parameter. This rate governs the pace at which non-fossil sources replace fossil fuels in the electricity mix, directly affecting electricity emissions in export products. Under the BAU scenario for 2030, four simulations (0.25n, 0.5n, 1.5n, and 2n) were performed. Results show that provinces with high electricity emissions - such as Shandong, Jiangsu, and Guangdong - are particularly sensitive to changes in n, highlighting the critical role of decarbonization speed in shaping regional carbon footprints.
RESULTS AND DISCUSSION
Historical grid carbon footprint factors analysis
Between 2020 and 2022, China's provincial GCFF exhibited a general downward trajectory, though significant interprovincial heterogeneity persisted [Figure 2]. In 2020, provinces such as Jilin (1.0185), Tianjin (1.0149), Shanxi (1.0078), Inner Mongolia (1.1621), and Hebei (1.2067) reported GCFF values exceeding 1.0 kg CO2e kWh-1. By 2022, these figures had declined to 0.8005, 0.8272, 0.8727, 0.9968, and 0.9096 kg CO2e kWh-1, respectively. Hebei recorded the most substantial reduction (24.62%) yet remained among the highest nationally. Notable reductions were also observed in Liaoning (a decrease of 20.25%, from 0.9869 to 0.7871 kg CO2e kWh-1), Heilongjiang (down 16.64%, from 0.9842 to 0.8204 kg CO2e kWh-1), and Beijing (down 16.70%, from 0.8073 to 0.6725 kg CO2e kWh-1). Among the coastal provinces of Central and East China, Shandong, Jiangxi, and Fujian also exhibited marked declines, with GCFFs falling from 0.8852, 0.6962, and 0.5714 kg CO2e kWh-1 to 0.7441, 0.5996, and 0.4921 kg CO2e kWh-1, respectively. In contrast, several provinces in Northwest and Southwest China - including Qinghai, Sichuan, and Yunnan - maintained consistently low GCFF values, reporting the lowest levels nationwide in 2020 (0.1312, 0.1533, and 0.1764 kg CO2e kWh-1, respectively). Though these values slightly increased in 2022 (to 0.2038, 0.1765, and 0.1784 kg CO2e kWh-1, respectively), they remained substantially below the national average. Notably, Hubei, Guizhou, and Chongqing were among the few provinces where GCFFs increased, rising from 0.3800, 0.4940, and 0.5010 kg CO2e kWh-1 to 0.4772, 0.5868, and 0.5619 kg CO2e kWh-1, respectively.
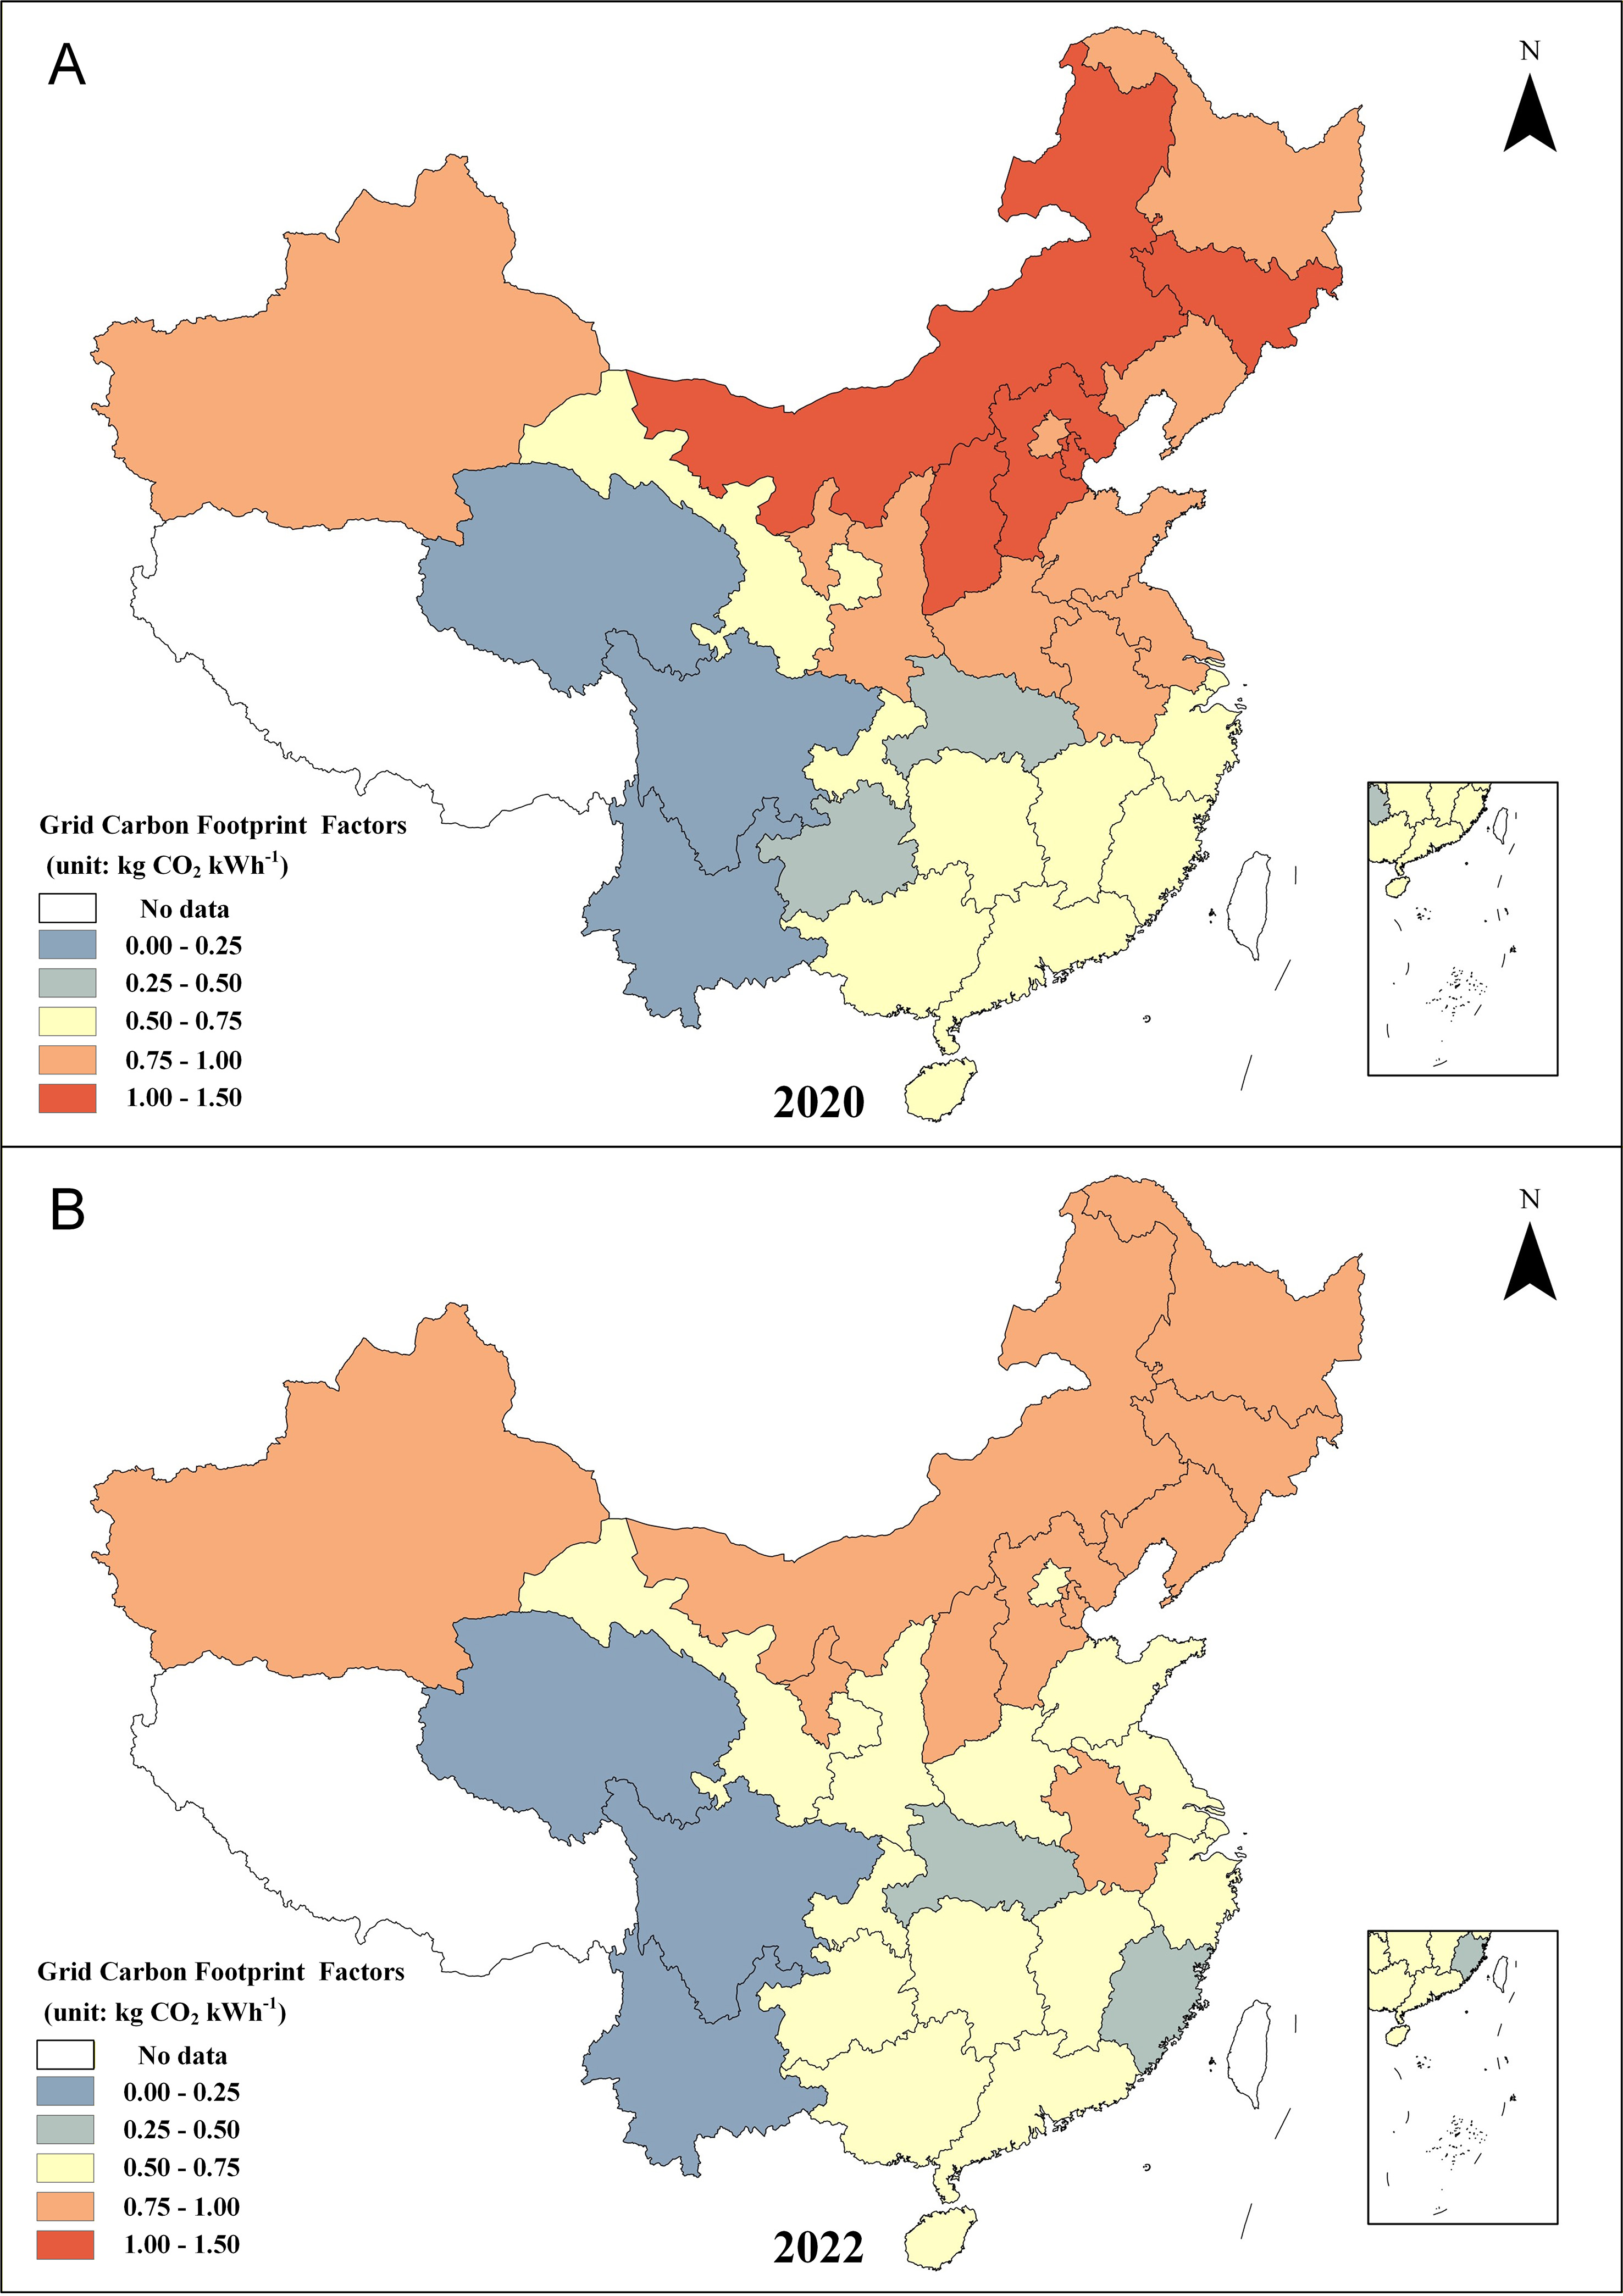
Figure 2. Provincial Grid Carbon Footprint Factors (GCFFs) in (A) 2020 and (B) 2022 (unit: kg CO2e kWh-1). The color map illustrates the geographical distribution of the GCFFs of each province in China. The map is derived from the National Catalogue Service For Geographic Information (www.webmap.cn).
Building upon previous studies, this research conducts a comparative analysis of provincial GCFFs for the years 2020 and 2022 against the most recently disclosed national average for 2023
Overall, the spatial heterogeneity of GCFFs underscores the pivotal function of localized energy portfolios, interregional electricity dispatch patterns, and varying degrees of reliance on fossil fuels[4]. A clear spatial gradient is observed, with northern and eastern provinces exhibiting significantly higher GCFFs due to a heavy reliance on fossil fuel-based electricity generation[61] (e.g., Inner Mongolia and Shanxi are more than 40% higher than the national average), whereas southern and southwestern regions show markedly lower values as a result of abundant renewable energy resources[62,63]. In particular, provinces such as Sichuan and Yunnan have consistently maintained the lowest GCFF nationwide (more than 70% below the national average), primarily due to the substantial penetration of hydropower in their electricity mix. The evidence presented here indicates that these persistently low emission factors underscore the decarbonization advantages of renewable-rich regions and point to the structural importance of accelerating clean energy deployment in high-GCFF areas to achieve national carbon neutrality goals.
Provincial GCFF scenario optimization analysis
Based on the dynamic and provincial electricity generation, China’s provincial, time-varying, optimized GCFFs from 2020 to 2060 are estimated, as illustrated in Figure 3. From a temporal perspective, provincial GCFFs across China demonstrate a persistent downward trend between 2020 and 2060 under the BAU scenario (as shown by the red solid curves in Figure 3). Provinces such as Qinghai, Jilin, and Hainan exhibit the most significant declines in GCFFs, with values decreasing from 0.1312, 1.0185, and
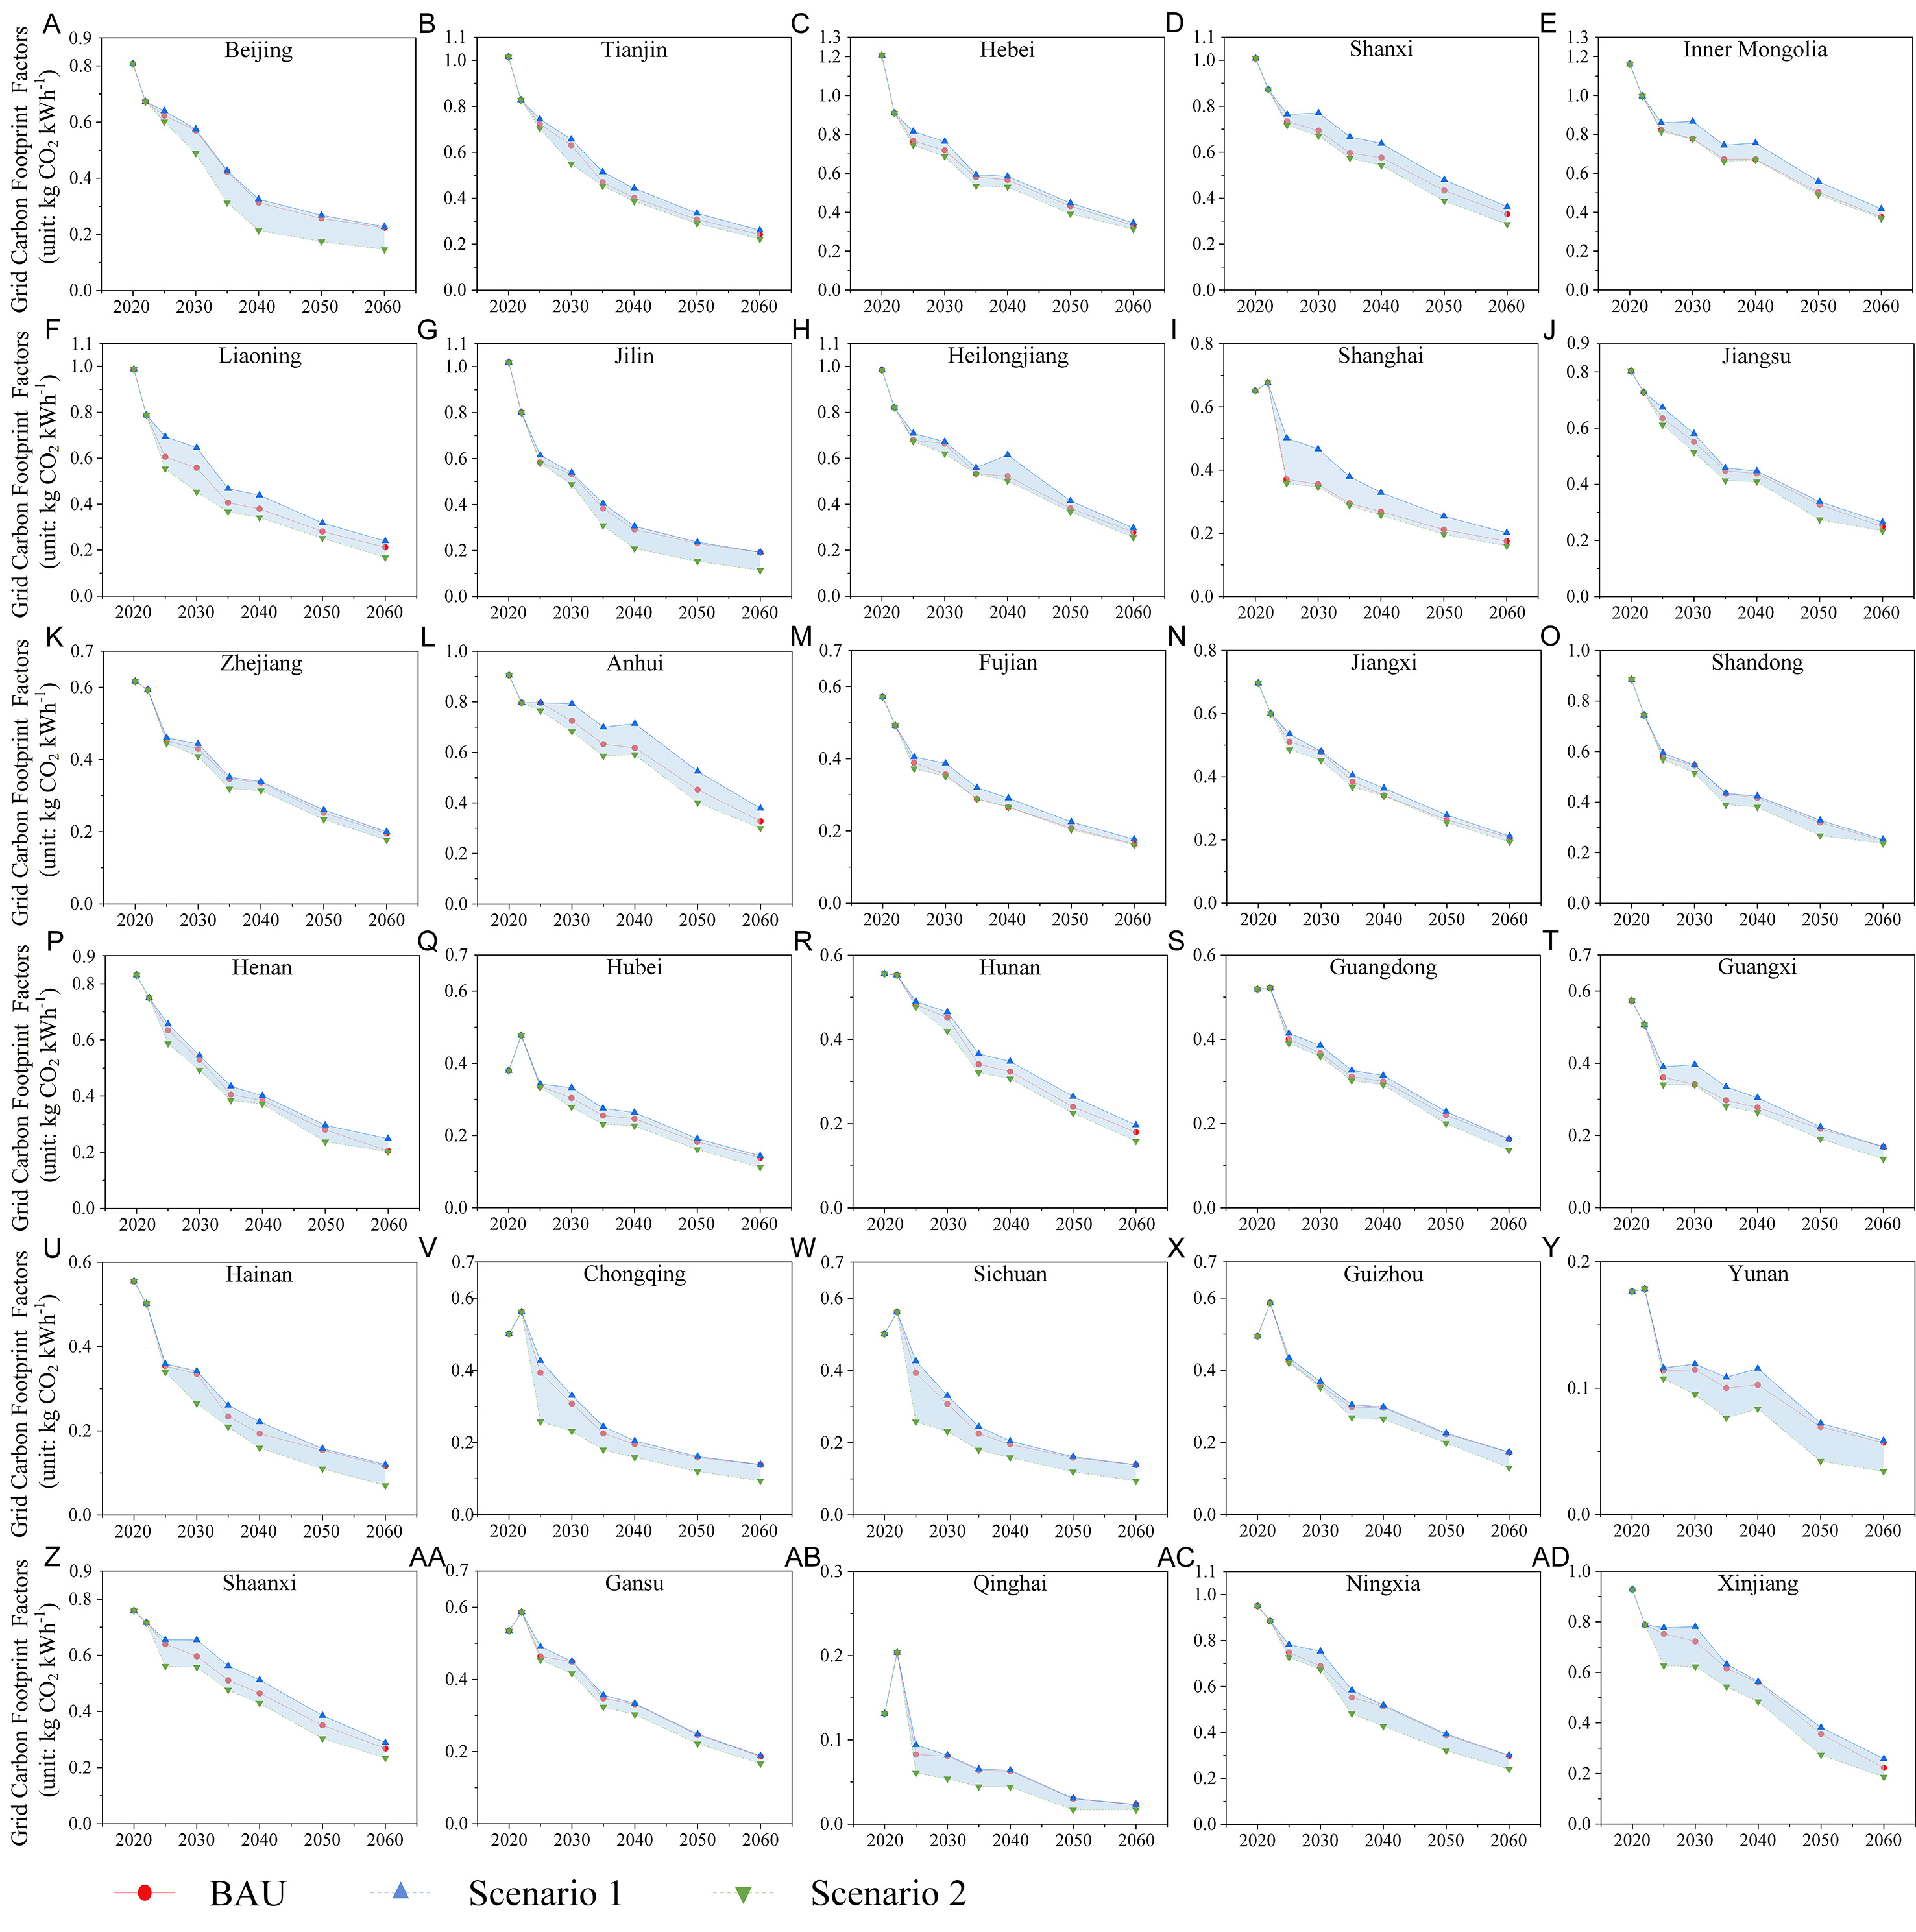
Figure 3. Provincial Grid Carbon Footprint Factors (GCFFs) from 2020 to 2060 under the three scenarios: Business as usual (BAU), Scenario 1 (S1), and Scenario 2 (S2) (A-AD) (unit: kg CO2e kWh-1). The red solid curves represent the GCFFs under the BAU scenario across provinces, while the blue and green dashed lines correspond to S1 and S2, respectively. The light-blue shaded area between the two dashed curves highlights the magnitude of divergence between the S1 and S2 pathways.
The evolution of GCFFs under different scenarios reveals distinct trajectories, underscoring the structural influence of renewable energy deployment on regional electricity system carbon intensity. By 2060, under the S2 scenario (as shown by the green dashed lines in Figure 3), the GCFF levels across most Chinese provinces are markedly lower than those under the S1 (as shown by the blue dashed lines in Figure 3) and BAU scenarios. For instance, provinces such as Guangdong and Hainan see their GCFFs reduced to 0.1369 and 0.0704 kg CO2e kWh-1 under the S2 scenario - representing reductions of 4.97% and 8.30%, respectively, compared to the BAU pathway. This highlights the substantial carbon mitigation potential that can be achieved through enhanced utilization of wind and solar resources[64]. Similarly, in East China industrial powerhouses such as Jiangsu and Zhejiang, GCFFs decline to 0.2339 and 0.1772 kg CO2e kWh-1 under the S2 scenario, reflecting reductions of 1.85% and 2.98% relative to BAU. These figures indicate that accelerated renewable energy integration plays a pivotal role in decarbonizing provinces with high electricity demand. In contrast, although provinces in southwestern China, such as Sichuan, Qinghai, and Yunnan, consistently maintain relatively low GCFF levels across all scenarios, notable differences still emerge among the scenarios. This indicates that even in regions endowed with abundant renewable energy resources, further scaling up the deployment of wind, solar, and hydro remains instrumental in driving continued reductions in the GCFF. Nationally, the S2 scenario enables a further 4.53% reduction in average GCFF by 2060 compared to BAU (representing a 6.22% decrease relative to S1, as shown by the light-blue shaded area in Figure 3), substantially expediting the decarbonization of China’s electricity sector and reinforcing the urgency and necessity of renewable energy expansion[65].
In summary, China’s GCFF is projected to decline substantially over the next four decades. At the regional level, southwestern and northwestern provinces - endowed with abundant hydro, solar, and wind resources - are expected to experience the fastest and most profound reductions in GCFF, laying a critical foundation for the development of a near-zero-carbon electricity system. In contrast, central and eastern provinces, which remain heavily reliant on fossil fuels, will need to pursue a dual strategy that combines importing clean electricity with restructuring their local energy mix to achieve deep decarbonization. From a scenario perspective, the “Active renewable energy development” (S2) demonstrates the greatest mitigation potential, enabling the majority of provinces to achieve GCFF levels as low as 0.15-0.25 kg CO2e kWh-1 by 2060. These findings highlight that accelerating the penetration of non-fossil energy sources within the electricity sector is a pivotal strategy for reducing GCFF and advancing toward China’s carbon neutrality targets[66,67].
Analysis of electricity emissions in the carbon footprint of typical export products
By integrating GCFFs with the provincial trade profiles of typical export products (e.g., steel, cement, and aluminum), electricity-induced indirect carbon emissions embedded in typical provincial exports across China from 2020 to 2060 are estimated. The results reveal pronounced spatiotemporal disparities in electricity emissions from steel exports under different scenarios (Figures 4-6, where the red curves denote BAU, and the blue and green represent S1 and S2, respectively). Nationally, the S2 scenario yields the most substantial emission reductions across the majority of provinces, highlighting its enhanced decarbonization potential. For example, Jiangsu and Shandong - two of China's largest steel-exporting provinces - had electricity-related emissions as high as 3.04 × 10⁹ and 3.36 × 10⁹ kg CO2e in 2020, respectively. Under the S2 scenario, these figures drop sharply to 5.66 × 10⁸ and 5.74 × 10⁸ kg CO2e, respectively, by 2060, corresponding to reductions of 81.38% and 82.93%. Similarly, heavy industrial provinces in the north, such as Hebei, Liaoning, and Tianjin, also show marked improvements, each reducing their emissions by over 80% under the S2 scenario. In contrast, electricity emission reductions in Inner Mongolia and Anhui remain below 80% under the S2 scenario, constrained by a coal-heavy energy mix and limited structural flexibility in the former, and high industrial demand with slow non-fossil electricity penetration in the latter. It is worth noting that before 2025, inter-scenario differences remain relatively small; however, by 2060, the advantages of the S2 scenario become increasingly pronounced, underscoring its critical role in supporting China's long-term low-carbon transition in the export sector.
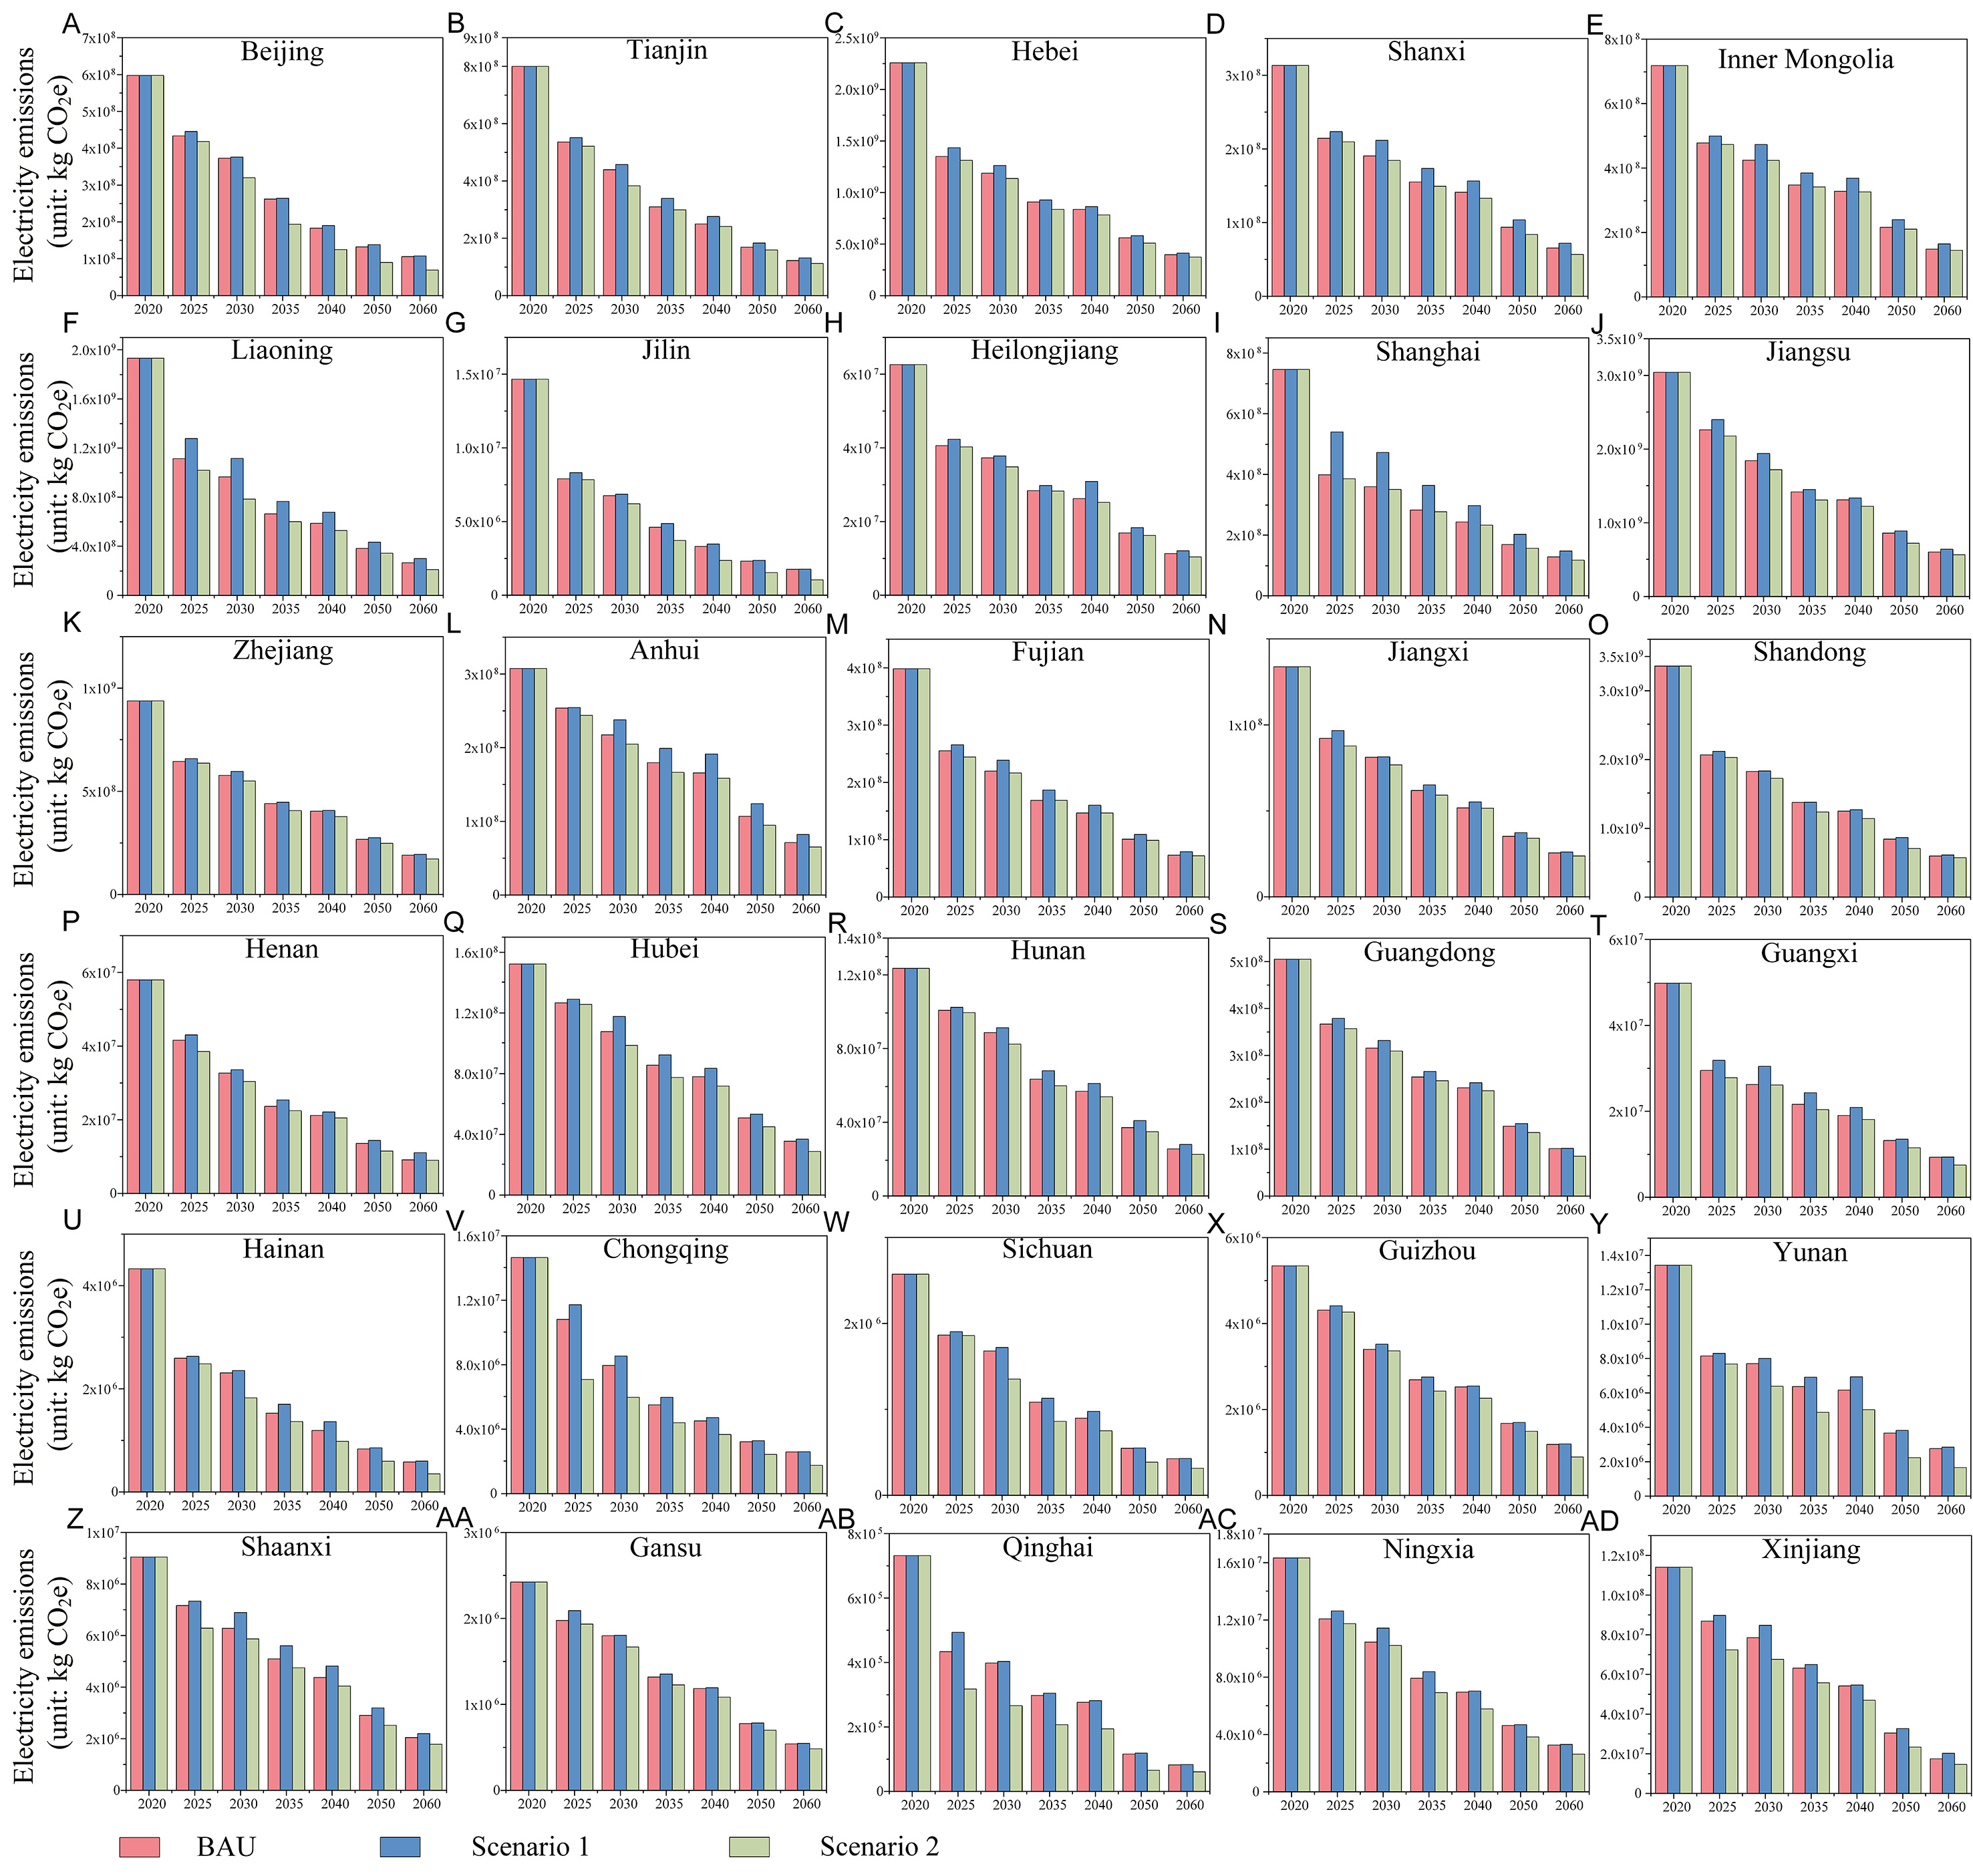
Figure 4. Provincial electricity emissions in the carbon footprint of exported steel products from 2020 to 2060 under the three scenarios: Business as usual (BAU), Scenario 1 (S1), and Scenario 2 (S2) (A-AD) (unit: kg CO2e). The red curves represent the electricity emissions under the BAU scenario across provinces, while the blue and green correspond to S1 and S2, respectively.
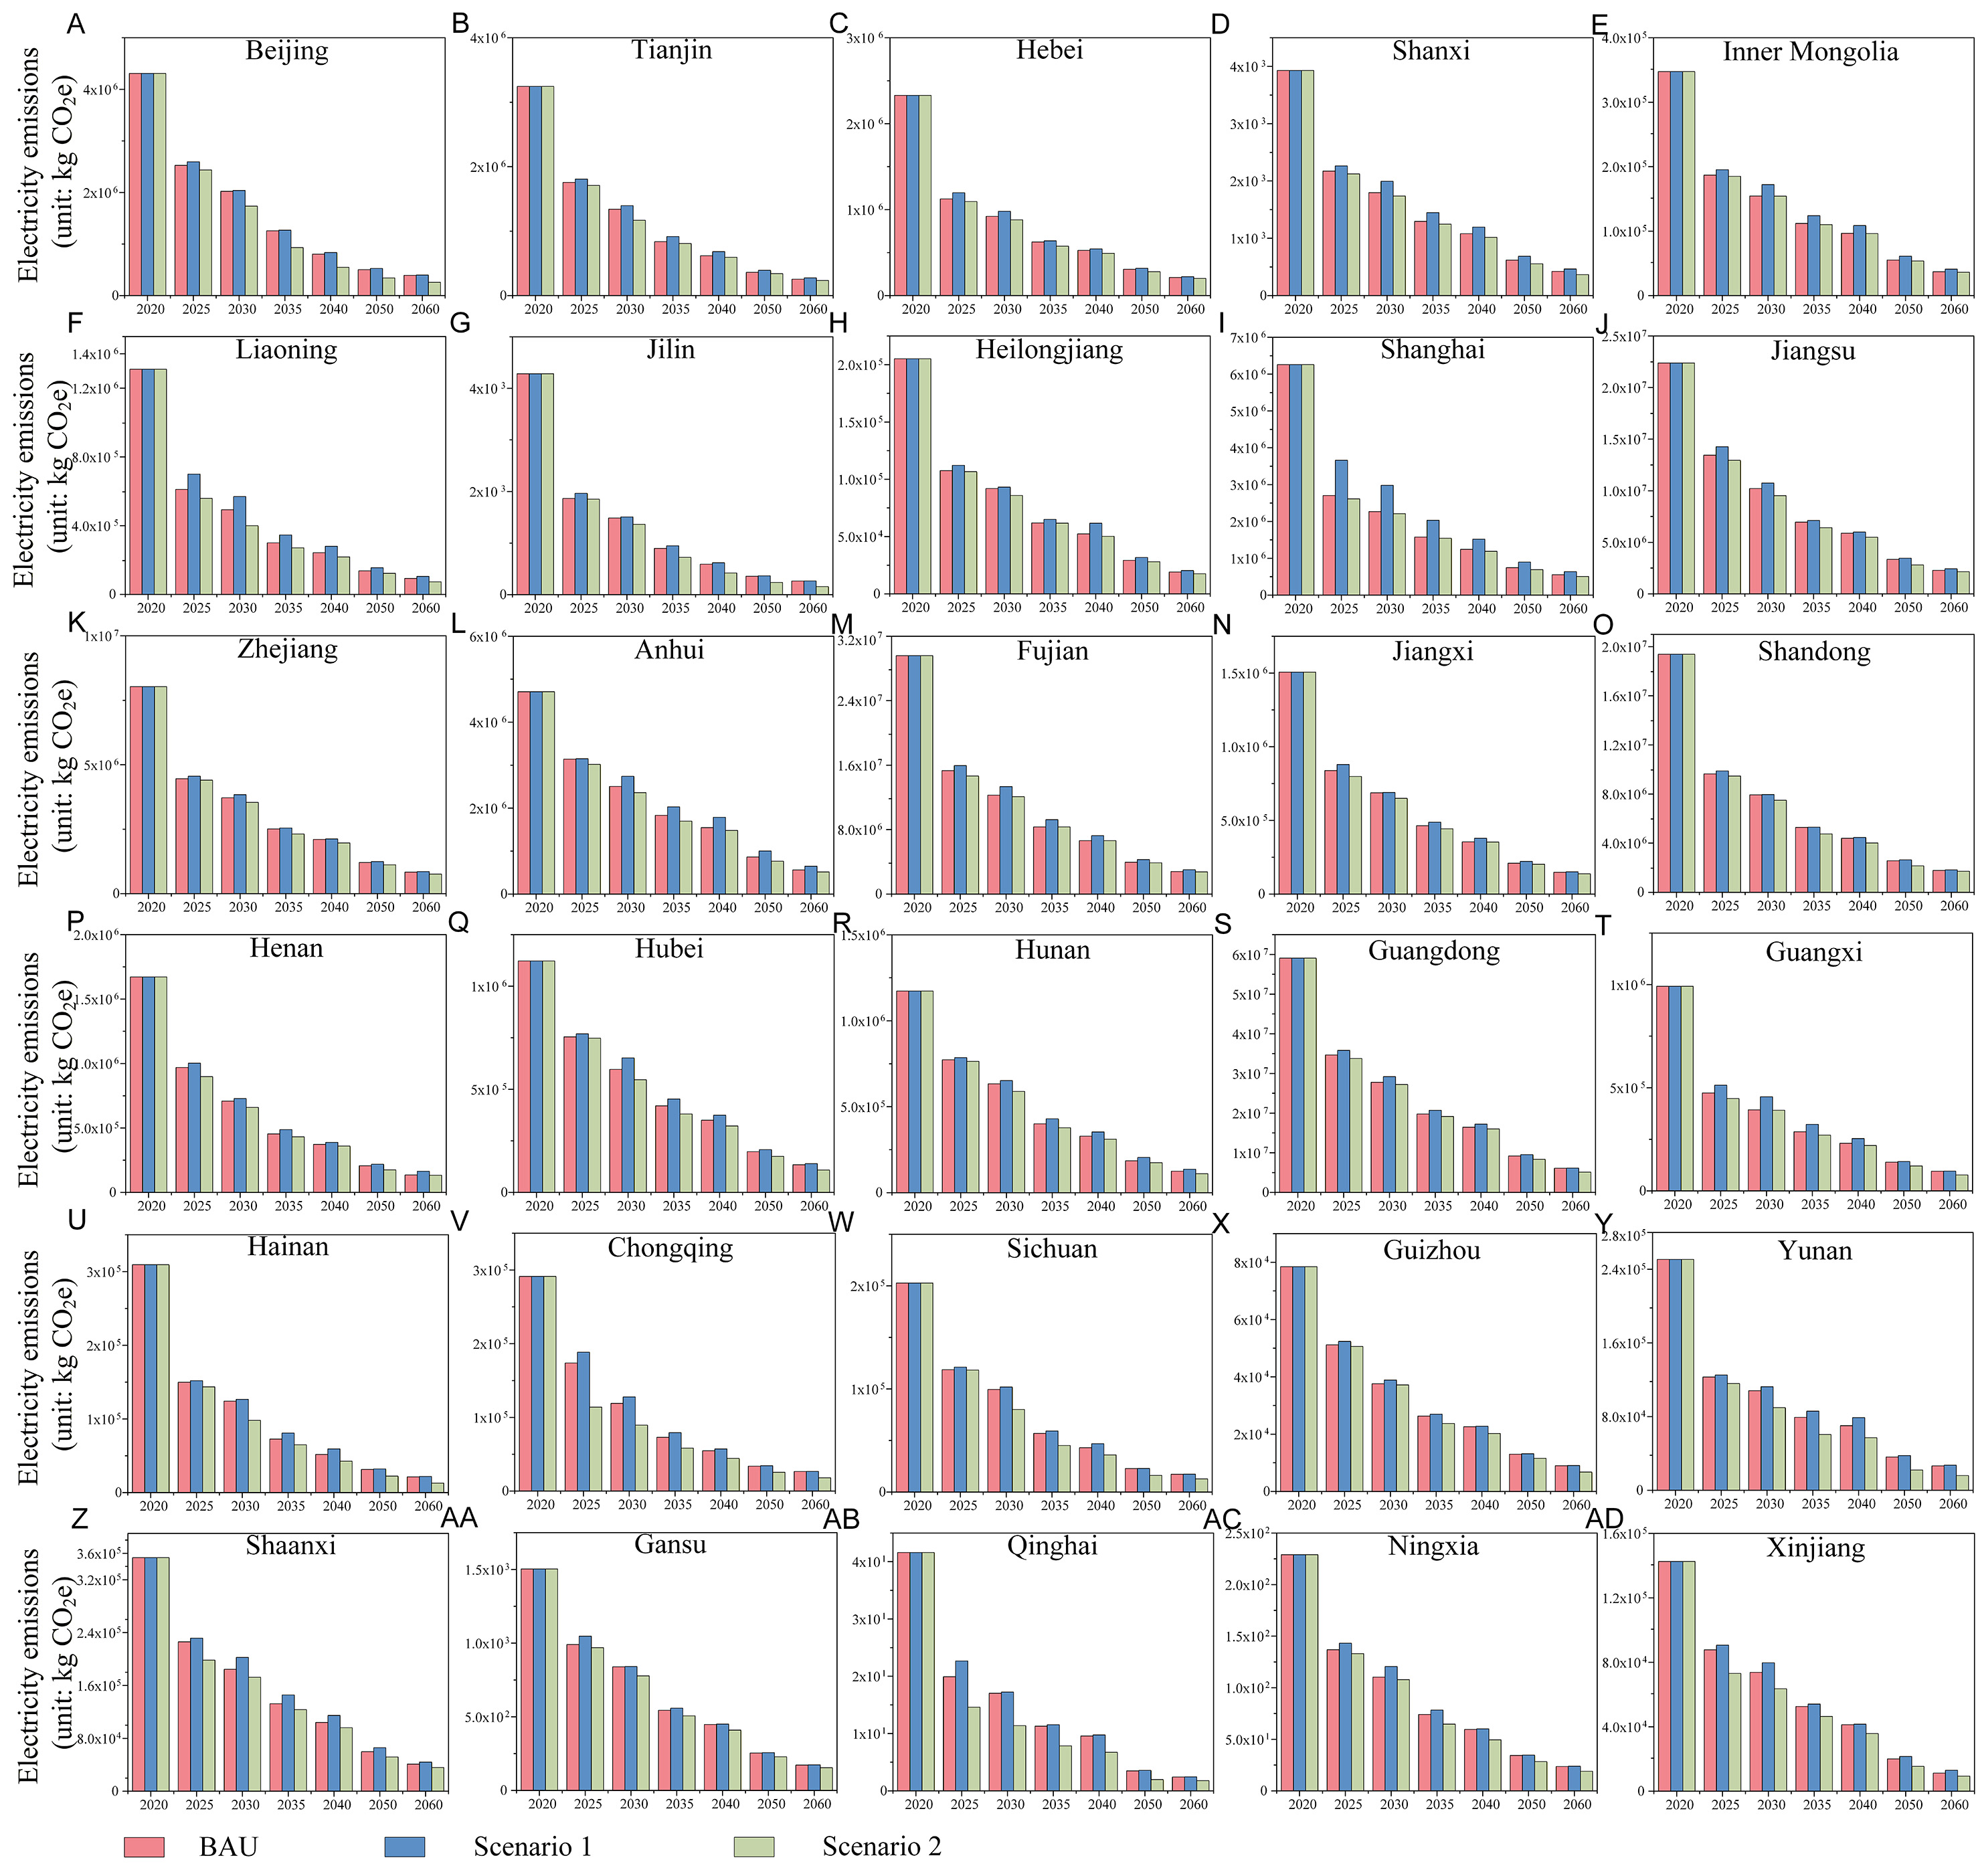
Figure 5. Provincial electricity emissions in the carbon footprint of exported cement products from 2020 to 2060 under the three scenarios: Business as usual (BAU), Scenario 1 (S1), and Scenario 2 (S2) (A-AD) (unit: kg CO2e). The red curves represent the electricity emissions under the BAU scenario across provinces, while the blue and green curves correspond to S1 and S2, respectively.
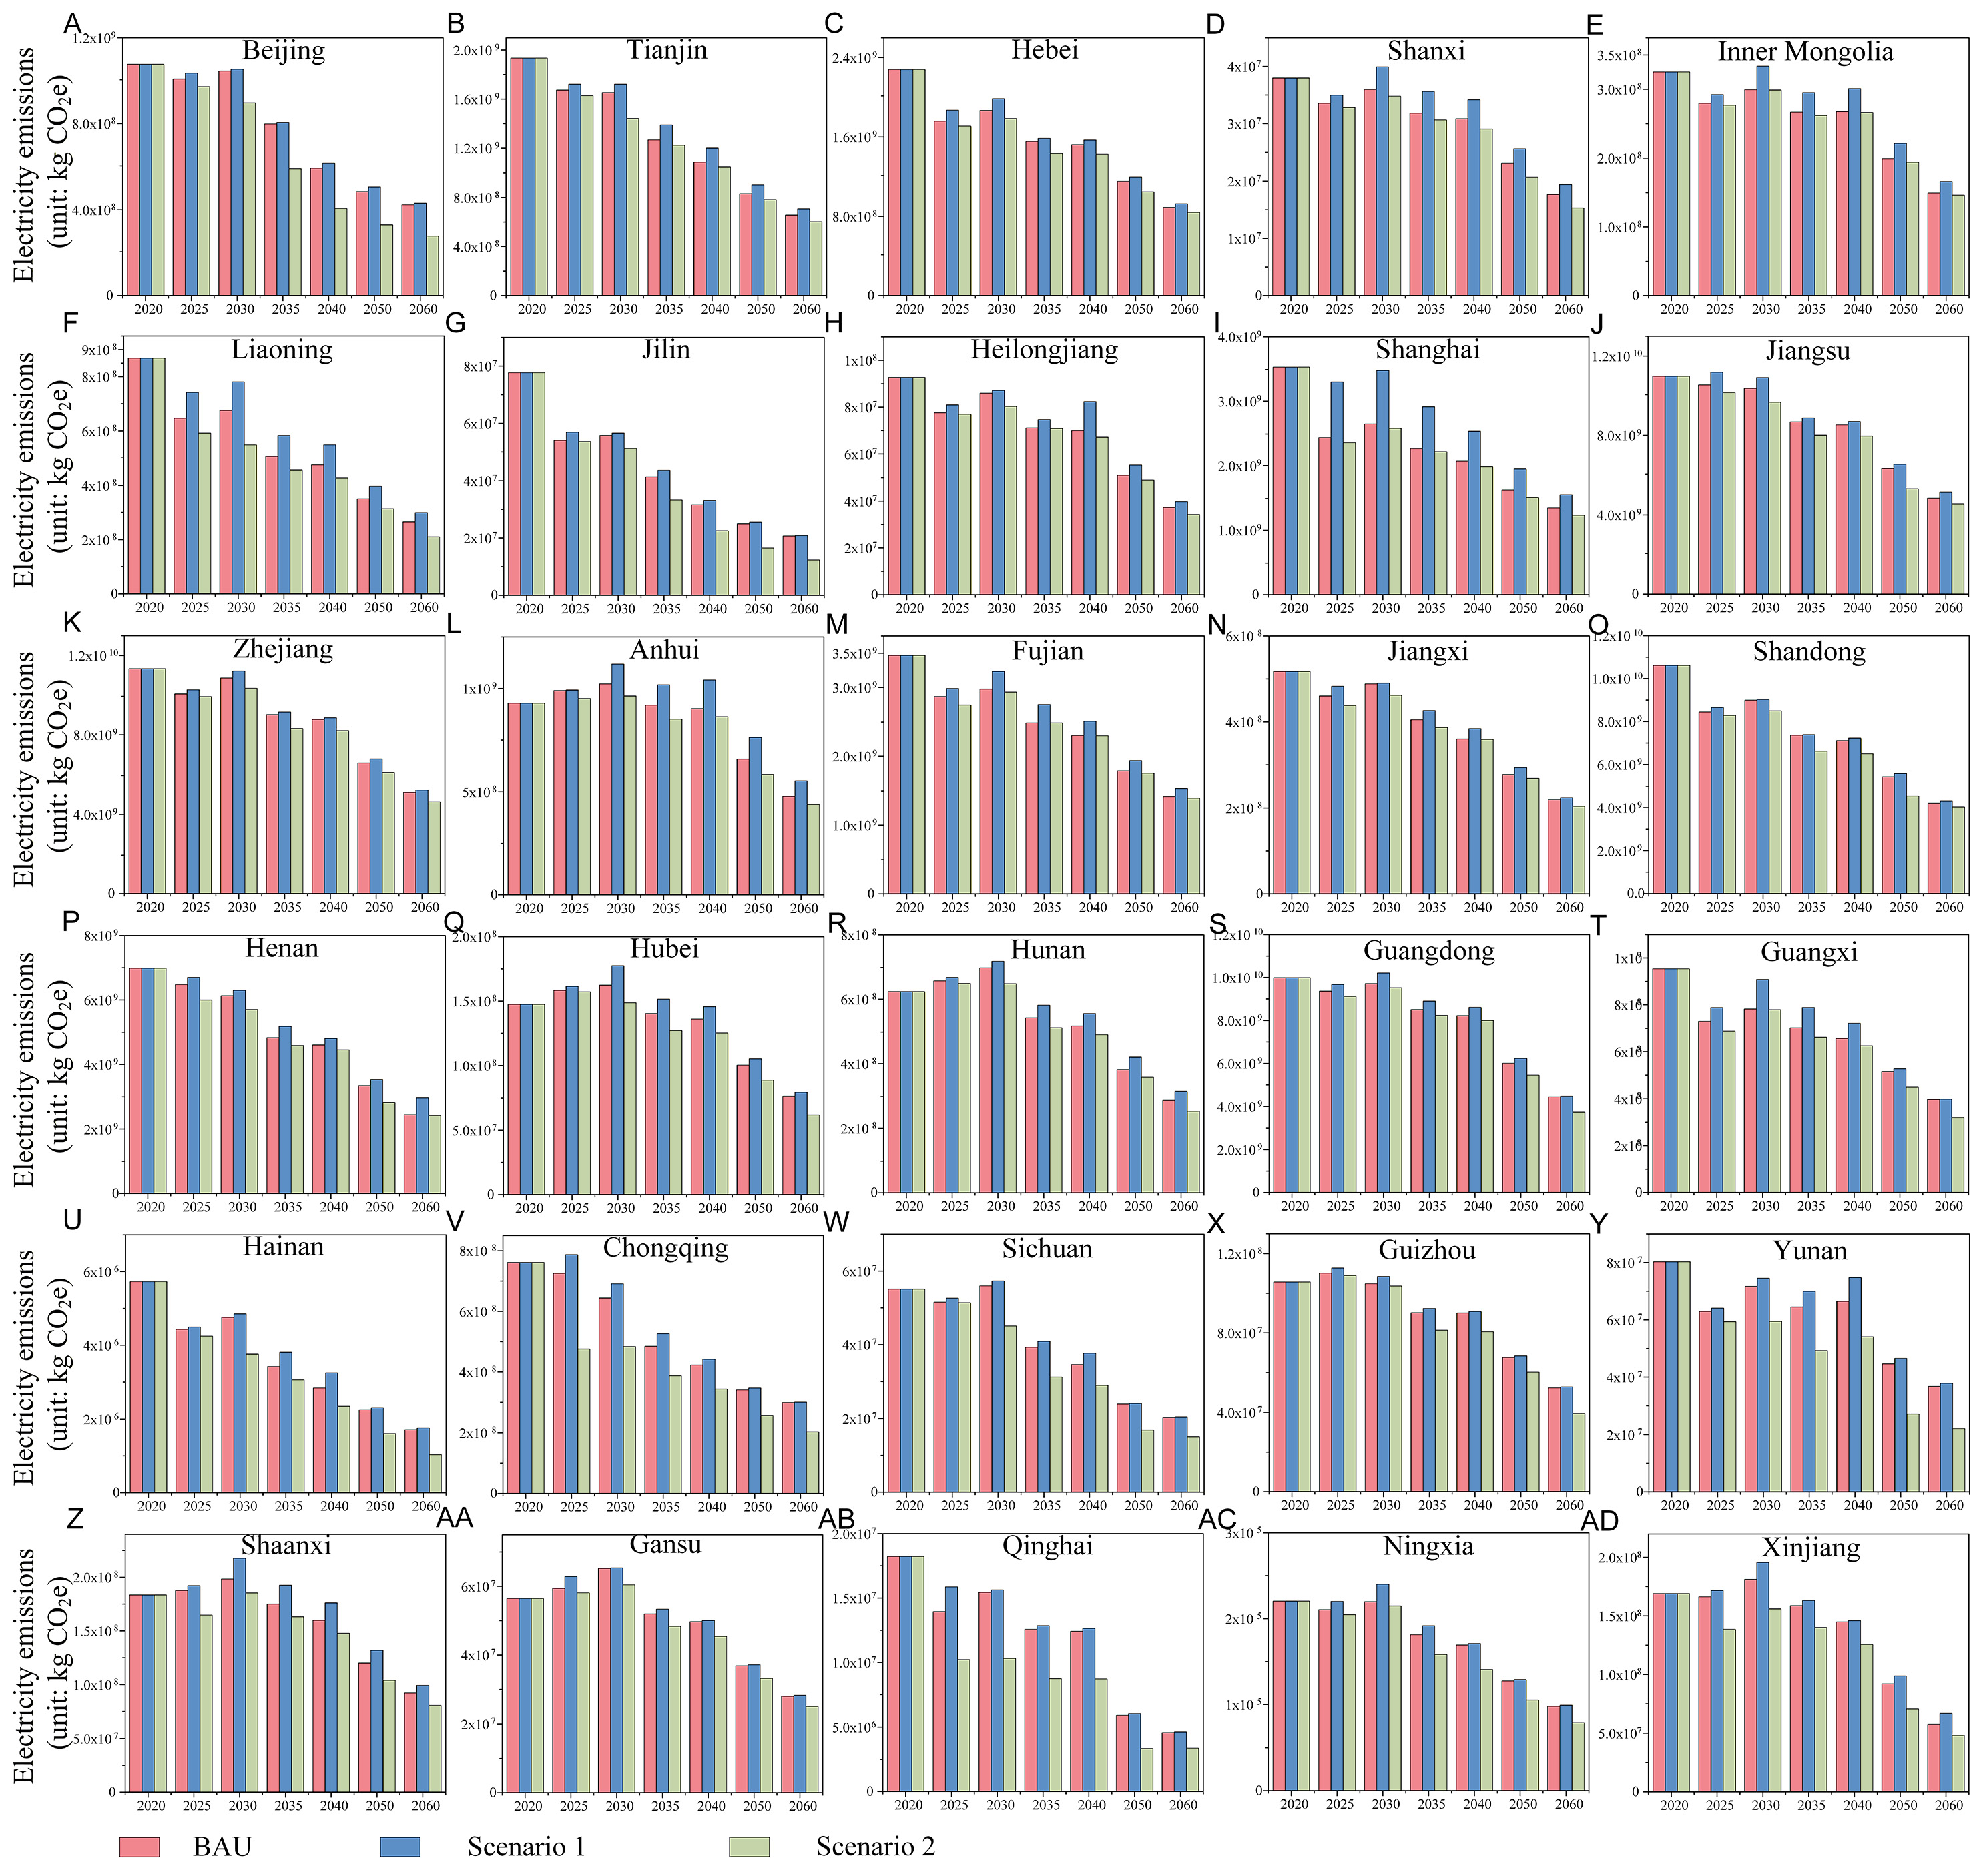
Figure 6. Provincial electricity emissions in the carbon footprint of exported aluminum products from 2020 to 2060 under the three scenarios: Business as usual (BAU), Scenario 1 (S1), and Scenario 2 (S2) (A-AD) (unit: kg CO2e). The red curves represent the electricity emissions under the BAU scenario across provinces, while the blue and green correspond to S1 and S2, respectively.
Electricity emissions embedded in cement exports also exhibit distinct spatial and temporal dynamics under the three scenarios [Figure 5]. Overall, provinces with large cement export volumes - such as Guangdong, Fujian, and Jiangsu - dominate in absolute electricity emissions. In 2020, Guangdong’s electricity emissions from cement exports reached 5.91 × 10⁷ kg CO2e, far surpassing other regions. Under the S2 scenario, this figure drops to 5.13 × 10⁶ kg CO2e by 2060, representing a significant 91.32% reduction. Similar emission declines are observed in Jiangsu and Fujian, each achieving over 90% reductions by 2060 under the S2 scenario. In contrast, provinces with smaller cement export volumes - such as Gansu, Qinghai, and Ningxia - exhibit lower absolute emissions throughout but also relatively modest declines, with reductions of only 89.74%, 95.73%, and 91.69% under the S2 scenario, respectively. Moreover, in provinces such as Henan, Jiangxi, and Tianjin, the differences in electricity emissions across the three scenarios remain relatively small. For instance, by 2060, electricity emissions from cement exports in Henan are projected to be
In addition, electricity emissions from aluminum exports exhibit notable spatial-temporal heterogeneity across the three scenarios, with emission trajectories proving particularly sensitive to decarbonization pathways - more so than for steel or cement [Figure 6]. Overall, coastal provinces continue to dominate in absolute emissions. In 2020, Zhejiang, Jiangsu, Shandong, and Guangdong reported 1.13 × 10¹⁰, 1.10 × 10¹⁰, 1.06 × 10¹⁰, and 9.99 × 10⁹ kg CO2e in electricity emissions from aluminum exports, respectively. Under the S2 scenario, these figures drop to 4.63 × 10⁹, 4.55 × 10⁹, 4.03 × 10⁹, and 3.75 × 10⁹ kg CO2e by 2060, reflecting reductions of 59.14%, 58.58%, 62.02%, and 62.50%, respectively. In contrast, certain western and northern provinces, although contributing smaller aluminum export volumes, exhibit sharper relative reductions. For instance, Beijing, Jilin, Yunnan, and Hainan achieve reductions of 74.20%, 84.12%, 72.49%, and 81.96% under the S2 scenario, respectively. Notably, Jilin’s electricity emissions decline to just 1.23 × 10⁷ kg CO2e by 2060, highlighting the substantial mitigation potential even in less industrialized regions when low-carbon electricity systems are fully deployed. These findings further underscore that in provinces where electricity consumption constitutes a major share of embedded emissions in export products - such as Beijing, Shandong, and Jiangsu - the application of high-resolution, spatiotemporally explicit GCFFs substantially enhances the accuracy and reliability of CO2 trajectory estimates. This highlights the critical importance of employing region-specific and temporally dynamic GCFFs as a foundational prerequisite for robust subnational emission pathway assessments.
CONCLUSION AND OUTLOOK
Against the backdrop of China's dual-carbon goals, this study provides a high-resolution and dynamic assessment of GCFFs across 30 Chinese provinces from 2020 to 2060, offering a detailed picture of spatial heterogeneity and long-term trajectories. Results show that while the national GCFF exhibits an overall downward trend, the extent of reduction varies substantially across provinces. Renewable-rich regions such as Sichuan, Yunnan, and Qinghai consistently maintain the lowest GCFF - over 70% below the national average - owing to their dominant hydropower share. In contrast, coal-dependent provinces such as Shanxi and Inner Mongolia, though experiencing measurable improvements, continue to exhibit values far above the national mean. Some provinces, including Hubei, Guizhou, and Chongqing, even recorded slight increases in GCFFs during 2020-2022, highlighting the combined effects of rigid electricity demand, limited renewable substitution, and entrenched reliance on coal. These divergent trends underscore the structural imbalance in China’s electricity system and suggest that the speed and magnitude of GCFF decline are shaped not only by resource endowment but also by policy orientation, grid integration, and interprovincial electricity flows.
When linking provincial GCFF trajectories with the electricity intensity of major export products, pronounced differences emerge in the indirect emissions embedded in steel, cement, and aluminum exports. Steel and aluminum exports from provinces such as Jiangsu and Shandong exhibit high sensitivity to GCFF evolution, with emission reductions exceeding 80% under the S2 scenario by 2060. In contrast, cement-related electricity emissions are less responsive to GCFF changes, as their trajectories are more strongly influenced by demand-side and industrial production dynamics. Furthermore, aluminum exports demonstrate the highest sectoral responsiveness to electricity decarbonization, with relative reductions surpassing 60% in provinces such as Shandong and over 80% in less industrialized regions such as Jilin. These findings emphasize that the indirect emissions embodied in products are co-determined by both the carbon intensity of electricity and the structural characteristics of provincial industries, revealing a complex interaction between supply-side decarbonization and demand-side constraints. Collectively, this study establishes a refined framework for capturing regional disparities and sectoral sensitivities, offering a scientific foundation for future efforts in carbon accounting and export-oriented emission management.
Despite providing a comprehensive assessment of the spatiotemporal dynamics of provincial GCFFs, this study has several limitations that warrant further refinement to enhance model accuracy and policy relevance. First, provincial electricity demand is assumed to remain constant across scenarios to isolate the influence of supply-side structural transformation on GCFFs. While this approach clarifies the attribution of mitigation potential to generation mix changes, it neglects the interplay between electrification, industrial upgrading, and regional demand heterogeneity. Future research should incorporate computable general equilibrium (CGE) or multi-regional input-output (MRIO) models to dynamically integrate demand-side evolution. Second, due to data limitations, the analysis is confined to fuel supply and generation stages, deliberately excluding emissions from fuel transport and flue gas desulfurization. The omission of transmission-, distribution-, and consumption-related emissions may result in a slight underestimation of provincial GCFFs. Expanding the boundary by integrating spatially explicit grid infrastructure data and life cycle inventories of desulfurization processes will improve the completeness and robustness of GCFF assessments. Third, this study relies on emission factors for imported electricity and renewable generation from international databases such as IRENA and Ecoinvent, as well as literature-based values. These static parameters do not fully capture temporal variability, regional heterogeneity, or the carbon intensity reductions arising from technological progress. Incorporating dynamic and grid-specific emission factors, supported by empirical data and technology learning curves, will enhance the precision of long-term projections. Lastly, the scenario design only considers renewable energy development pathways without explicitly incorporating emerging technologies such as energy storage, ultra-high-voltage transmission, carbon capture and storage, and green hydrogen. Although this ensures comparability across scenarios, it may underestimate the transformative role of these technologies in reshaping provincial GCFF trajectories. Future work should extend the current dynamic model by coupling it with techno-economic modules for storage, transmission, and carbon capture to provide a more holistic evaluation of China’s low-carbon electricity transition. Addressing these limitations will support the development of an integrated techno-economic-environmental policy framework to guide China’s future energy transition.
DECLARATIONS
Authors' contributions
Investigation, software, visualization, methodology, writing-original draft, writing-review & editing:
Data curation, methodology, writing-review & editing: Zhang, Z.
Data curation, visualization, writing-review & editing: Zhu, S.
Data curation, writing-review & editing: Song, X.
Writing-review & editing: Ning, L.; Chen, P.; Zang, H.; Ren, W.; Niu, M.
Methodology, writing-review & editing: Cai, B.
Investigation, conceptualization, methodology, data curation, writing-review & editing: Zhang, L.
Availability of data and materials
The data that support the findings of this study are available from the corresponding author upon reasonable request.
Financial support and sponsorship
This work was supported by the National Natural Science Foundation of China (Grant Nos. 72140003 and 72504111) and the National Key Research and Development Program of China (Grant No. 2023YFC3807700).
Conflicts of interest
Ning, L. is affiliated with Beijing Geely Digital Technology Co., and Zang, H. is affiliated with Beijing Enterprises Water Group Limited, while the other authors have declared that they have no conflicts of interest.
Ethical approval and consent to participate
Not applicable.
Consent for publication
Not applicable.
Copyright
© The Author(s) 2025.
Supplementary Materials
REFERENCES
1. Wu, J.; Xu, Y.; Liu, Z. A comprehensive review on agricultural greenhouse gas emission reductions in China: opportunities and challenges. Carbon. Footprints. 2024, 3, 17.
2. Lee, H. Climate change 2023: synthesis report, summary for policymakers. In: Contribution of working groups I, II and III to the sixth assessment report of the intergovernmental panel on climate change. Geneva, Switzerland: IPCC, 2023; pp. 1-34.
3. Zhao, X.; Wang, Z.; Vasa, L.; Dincer, H. Unveiling the mechanisms and implications: how artificial intelligence drives green growth in China’s Huaihe River Ecological Economic Belt under the carbon neutrality agenda. Carbon. Footprints. 2025, 4, 16.
4. Jia, M.; Zhang, Z.; Zhang, L.; et al. Optimization of electricity generation and assessment of provincial grid emission factors from 2020 to 2060 in China. Appl. Energy. 2024, 373, 123838.
5. Wang, S.; Gong, C.; He, K.; et al. The potential impacts of Carbon Border Adjustment Mechanism (CBAM) on China's high-carbon industries. Energy 2025, 333, 137315.
6. Chen, G. Impact of carbon border adjustment mechanism on China's manufacturing sector: a dynamic recursive CGE model based on an evolutionary game. J. Environ. Manag. 2023, 347, 119029.
7. Topcheva, T. Direct and indirect carbon emissions in a production facility. Knowl. Int. J. 2023, 60, 427-30. Available from: https://ojs.ikm.mk/index.php/kij/article/view/6283 [Last accessed on 29 Oct 2025].
8. Mörsdorf, G. A simple fix for carbon leakage? Assessing the environmental effectiveness of the EU carbon border adjustment. Energy. Policy. 2022, 161, 112596.
9. Peng, X.; Tao, X.; Zhang, H.; Chen, J.; Feng, K. CO2 emissions from the electricity sector during China's economic transition: from the production to the consumption perspective. Sustain. Prod. Consum. 2021, 27, 1010-20.
10. Yuan, P.; Pu, Y.; Liu, C. Improving electricity supply reliability in China: cost and incentive regulation. Energy 2021, 237, 121558.
11. Zhao, Z.; Yang, H. Regional security assessment of integrated energy systems with renewables in China: a grid-connected perspective. Sustainability 2020, 12, 10299.
12. National Development and Reform Commission & National Energy Administration. 14th five-year plan for modern energy system. Available from: https://www.gov.cn/zhengce/zhengceku/2022-03/23/content_5680759.htm [Last accessed on 29 Oct 2025].
13. National Development and Reform Commission. 14th five-year plan for renewable energy development. Available from: https://www.ndrc.gov.cn/xwdt/tzgg/202206/t20220601_1326720.html?code=%26state=123 [Last accessed on 29 Oct 2025].
14. National Development and Reform Commission & National Energy Administration. Guiding Opinions on accelerating the construction of a unified national electricity market system. Available from: https://www.gov.cn/zhengce/zhengceku/2022-01/30/content_5671296.htm [Last accessed on 29 Oct 2025].
15. National Development and Reform Commission & National Energy Administration. Opinions on Improving the institutional mechanisms and policy measures for green and low-carbon energy transition. Available from: https://www.gov.cn/zhengce/zhengceku/2022-02/11/content_5673015.htm [Last accessed on 29 Oct 2025].
16. General Office of the people's Government of Inner Mongolia Autonomous Region. Energy development planning of Inner Mongolia Autonomous Region during the 14th five year plan period. Available from: https://www.nmg.gov.cn/zwgk/zfxxgk/zfxxgkml/ghxx/zxgh/202203/t20220304_2012787.html [Last accessed on 29 Oct 2025].
17. General Office of Gansu Provincial People's Government. Energy development plan of Gansu Province during the 14th five year plan period. Available from: https://www.gansu.gov.cn/gsszf/c100055/202201/1947911.shtml [Last accessed on 29 Oct 2025].
18. The CPC Central Committee and the State Council. Outline of regional integration development plan in the Yangtze River Delta. Available from: https://www.gov.cn/zhengce/2019-12/01/content_5457442.htm [Last accessed on 29 Oct 2025].
19. General Office of Guangdong Provincial People's Government. The 14th five year plan for energy development in Guangdong Province. Available from: https://www.gd.gov.cn/zwgk/wjk/qbwj/yfb/content/post_3909371.html [Last accessed on 29 Oct 2025].
20. Gong, C. C.; Ueckerdt, F.; Bertram, C.; et al. Multilevel emission impacts of electrification and coal pathways in China’s net-zero transition. Joule 2025, 9, 101945.
21. Knittel, T.; Lowry, C.; Mcpherson, M.; Wild, P.; Rowe, A. Electrifying end-use demands: a rise in capacity and flexibility requirements. Energy 2025, 320, 135373.
22. Knorr, L.; Buchenau, N.; Schlosser, F.; Divkovic, D.; Prina, M.; Meschede, H. Electrification and flexibility of process heat in energy system modelling: a review. Renew. Sustain. Energy. Rev. 2025, 216, 115698.
23. Li, Z.; Li, X.; Lu, C.; Ma, K.; Bao, W. Carbon emission responsibility accounting in renewable energy-integrated DC traction power systems. Appl. Energy. 2024, 355, 122191.
24. Bertolini, M.; Duttilo, P.; Lisi, F. Accounting carbon emissions from electricity generation: a review and comparison of emission factor-based methods. Appl. Energy. 2025, 392, 125992.
25. Lou, Y.; Ye, Y.; Yang, Y.; Zuo, W. Long-term carbon emission reduction potential of building retrofits with dynamically changing electricity emission factors. Build. Environ. 2022, 210, 108683.
26. Hung, C. R.; Völler, S.; Agez, M.; Majeau-bettez, G.; Strømman, A. H. Regionalized climate footprints of battery electric vehicles in Europe. J. Clean. Prod. 2021, 322, 129052.
27. V, A. K.; Verma, A.; Talwar, R. Optimal techno-economic sizing of a multi-generation microgrid system with reduced dependency on grid for critical health-care, educational and industrial facilities. Energy 2020, 208, 118248.
28. EPA. Electronic reporting of air emissions. Available from: https://www.epa.gov/electronic-reporting-air-emissions/webfire [Last accessed on 29 Oct 2025].
29. IEA. Emissions factors 2024. Available from: https://www.iea.org/data-and-statistics/data-product/emissions-factors-2024 [Last accessed on 29 Oct 2025].
30. EEA. EMEP/EEA air pollutant emission inventory guidebook 2023. Available from: https://www.eea.europa.eu/en/analysis/publications/emep-eea-guidebook-2023 [Last accessed on 29 Oct 2025].
31. Wei, X. K.; Tan, X. S.; Ruan, J. T.; et al. Research on carbon emission factors of regional and provincial power grids from 2005 to 2021. Clim. Chang. Res. 2024, 20, 337-50. Available from: https://www.climatechange.cn/EN/Y2024/V20/I3/337 [Last accessed on 29 Oct 2025].
32. Li, J.; Zhang, Y.; Tian, Y.; et al. Reduction of carbon emissions from China's coal-fired power industry: insights from the province-level data. J. Clean. Prod. 2020, 242, 118518.
33. Tang, J.; Shan, R.; Wang, P.; et al. Deciphering decarbonization trajectories in China by spatiotemporal-accumulation modeling of electricity carbon footprint. iScience 2025, 28, 111963.
34. Zhang, L.; Du, Q.; Zhou, D.; Zhou, P. How does the photovoltaic industry contribute to China's carbon neutrality goal? Analysis of a system dynamics simulation. Sci. Total. Environ. 2022, 808, 151868.
35. Chen, S.; Liu, P.; Li, Z. Low carbon transition pathway of power sector with high penetration of renewable energy. Renew. Sustain. Energy. Rev. 2020, 130, 109985.
36. Lin, B.; Zhu, J. Chinese electricity demand and electricity consumption efficiency: do the structural changes matter? Appl. Energy. 2020, 262, 114505.
37. Ruan, Z.; Lu, X.; Yin, Z.; et al. Spatiotemporal carbon footprint and associated costs of wind power toward China's carbon neutrality. Resour. Conserv. Recy. 2024, 205, 107593.
38. An, M.; Sun, X. Carbon footprints of solar panels in China provinces based on different production and waste treatment scenarios. J. Clean. Prod. 2024, 435, 140453.
39. Liu, P.; Liu, L.; Xu, X.; Zhao, Y.; Niu, J.; Zhang, Q. Carbon footprint and carbon emission intensity of grassland wind farms in Inner Mongolia. J. Clean. Prod. 2021, 313, 127878.
40. Barbera, E.; Mio, A.; Massi, Pavan. A.; Bertucco, A.; Fermeglia, M. Fuelling power plants by natural gas: an analysis of energy efficiency, economical aspects and environmental footprint based on detailed process simulation of the whole carbon capture and storage system. Energy. Convers. Manag. 2022, 252, 115072.
41. Wang, J.; Huang, W.; Ding, Y.; Dang, Y.; Ye, L. Forecasting the electric power load based on a novel prediction model coupled with accumulative time-delay effects and periodic fluctuation characteristics. Energy 2025, 317, 134518.
42. Jin, H.; Guo, J.; Tang, L.; Du, P. Long-term electricity demand forecasting under low-carbon energy transition: based on the bidirectional feedback between power demand and generation mix. Energy 2024, 286, 129435.
43. Wang, Y.; Yang, R.; Sun, L. A novel structure adaptive discrete grey Bernoulli model and its application in renewable energy power generation prediction. Expert. Syst. Appl. 2024, 255, 124481.
44. Shen, X.; Li, J.; Yin, Y.; Tang, J.; Lin, W.; Zhou, M. Carbon emission factors prediction of power grid by using graph attention network. Energy 2024, 121, 1945-61.
45. Leerbeck, K.; Bacher, P.; Junker, R. G.; et al. Short-term forecasting of CO2 emission intensity in power grids by machine learning. Appl. Energy. 2020, 277, 115527.
46. Barros, M. V.; Salvador, R.; Piekarski, C. M.; de, Francisco. A. C.; Freire, F. M. C. S. Life cycle assessment of electricity generation: a review of the characteristics of existing literature. Int. J. Life. Cycle. Assess. 2020, 25, 36-54.
47. Turconi, R.; Boldrin, A.; Astrup, T. Life cycle assessment (LCA) of electricity generation technologies: Overview, comparability and limitations. Renew. Sustain. Energy. Rev. 2013, 28, 555-65.
48. Cellura, M.; Cusenza, M. A.; Longo, S. Energy-related GHG emissions balances: IPCC versus LCA. Sci. Total. Environ. 2018, 628-9, 1328-39.
49. Rogelj, J.; Meinshausen, M.; Knutti, R. Global warming under old and new scenarios using IPCC climate sensitivity range estimates. Nat. Clim. Chang. 2012, 2, 248-53.
50. Chinese Ministry of Ecology and Environment. Greenhouse gases - carbon footprint of products - requirements and guidelines for quantification. Available from: https://std.samr.gov.cn/gb/search/gbDetailed?id=208E903AB60379F3E06397BE0A0AB2B9 [Last accessed on 29 Oct 2025].
51. Filonchyk, M.; Peterson, M. P.; Zhang, L.; Hurynovich, V.; He, Y. Greenhouse gases emissions and global climate change: examining the influence of CO2, CH4, and N2O. Sci. Total. Environ. 2024, 935, 173359.
52. Chinese Ministry of Ecology and Environment. Guidelines for accounting and reporting of enterprise greenhouse gas emissions for power generation facilities. Available from: https://www.mee.gov.cn/xxgk2018/xxgk/xxgk06/202212/t20221221_1008430.html [Last accessed on 29 Oct 2025].
53. Chinese Ministry of Ecology and Environment. Announcement by the ministry of ecology and environment and the national bureau of statistics on the release of carbon dioxide emission factors for electricity in 2021. Available from: https://www.mee.gov.cn/xxgk2018/xxgk/xxgk01/202404/t20240412_1070565.html [Last accessed on 29 Oct 2025].
54. China Energy Statistical Yearbook. National Bureau of statistics. Beijing: China Statistics Press; 2023. Available from: https://data.cnki.net/yearBook/single?id=N2024050932&pinyinCode=YCXME [Last accessed on 30 Oct 2025].
55. The compilation of statistics on electric power industry 2022. China Electricity Council. Beijing: China Statistics Press; 2025. Available from: https://data.cnki.net/yearBook/single?id=N2024092334&pinyinCode=YDLGT [Last accessed on 30 Oct 2025].
56. IPCC. 2006 IPCC guidelines for national greenhouse gas inventories. Available from: https://www.ipcc.ch/report/2006-ipcc-guidelines-for-national-greenhouse-gas-inventories/ [Last accessed on 29 Oct 2025].
57. Chinese Academy of Engineering. Research on China’s carbon peak and carbon neutrality strategy and path. Available from: https://news.cctv.com/2022/03/31/ARTI4omye-8GCT6AyYdEVUf0v220331.shtml [Last accessed on 29 Oct 2025].
58. Chinese Ministry of Ecology and Environment. Announcement on the release of carbon dioxide emission factor of electric power in 2022. Available from: https://www.mee.gov.cn/xxgk2018/xxgk/xxgk01/202412/t20241226_1099413.html [Last accessed on 29 Oct 2025].
59. Byers, E.; Krey, V.; Kriegler, E.; et al. AR6 Scenarios database. Available from: https://zenodo.org/records/7197970 [Last accessed on 29 Oct 2025].
60. Chinese Ministry of Ecology and Environment. Announcement on the release of power carbon footprint factor data in 2023. Available from: https://www.mee.gov.cn/xxgk2018/xxgk/xxgk01/202501/t20250123_1101226.html [Last accessed on 29 Oct 2025].
61. Wang, M.; Yao, M.; Wang, S.; et al. Study of the emissions and spatial distributions of various power-generation technologies in China. J. Environ. Manag. 2021, 278, 111401.
62. Xia, H.; Dai, L.; Sun, L.; et al. Analysis of the spatiotemporal distribution pattern and driving factors of renewable energy power generation in China. Econ. Anal. Policy. 2023, 80, 414-28.
63. Wang, X.; Lu, Z.; Li, T.; Zhang, P. Carbon-neutral power system transition pathways for coal-dominant and renewable Resource-abundant regions: inner Mongolia as a case study. Energy. Convers. Manag. 2023, 285, 117013.
64. Tian, J.; Zhou, S.; Wang, Y. Assessing the technical and economic potential of wind and solar energy in China - A provincial-scale analysis. Environ. Impact. Assess. Rev. 2023, 102, 107161.
65. He, G.; Lin, J.; Sifuentes, F.; Liu, X.; Abhyankar, N.; Phadke, A. Rapid cost decrease of renewables and storage accelerates the decarbonization of China's power system. Nat. Commun. 2020, 11, 2486.
66. Li, M.; Li, F.; Qiu, J.; et al. Multi-objective optimization of non-fossil energy structure in China towards the carbon peaking and carbon neutrality goals. Energy 2024, 312, 133643.
Cite This Article
How to Cite
Download Citation
Export Citation File:
Type of Import
Tips on Downloading Citation
Citation Manager File Format
Type of Import
Direct Import: When the Direct Import option is selected (the default state), a dialogue box will give you the option to Save or Open the downloaded citation data. Choosing Open will either launch your citation manager or give you a choice of applications with which to use the metadata. The Save option saves the file locally for later use.
Indirect Import: When the Indirect Import option is selected, the metadata is displayed and may be copied and pasted as needed.
About This Article
Copyright

Data & Comments
Data
0


Comments
Comments must be written in English. Spam, offensive content, impersonation, and private information will not be permitted. If any comment is reported and identified as inappropriate content by OAE staff, the comment will be removed without notice. If you have any queries or need any help, please contact us at [email protected].