


fig5
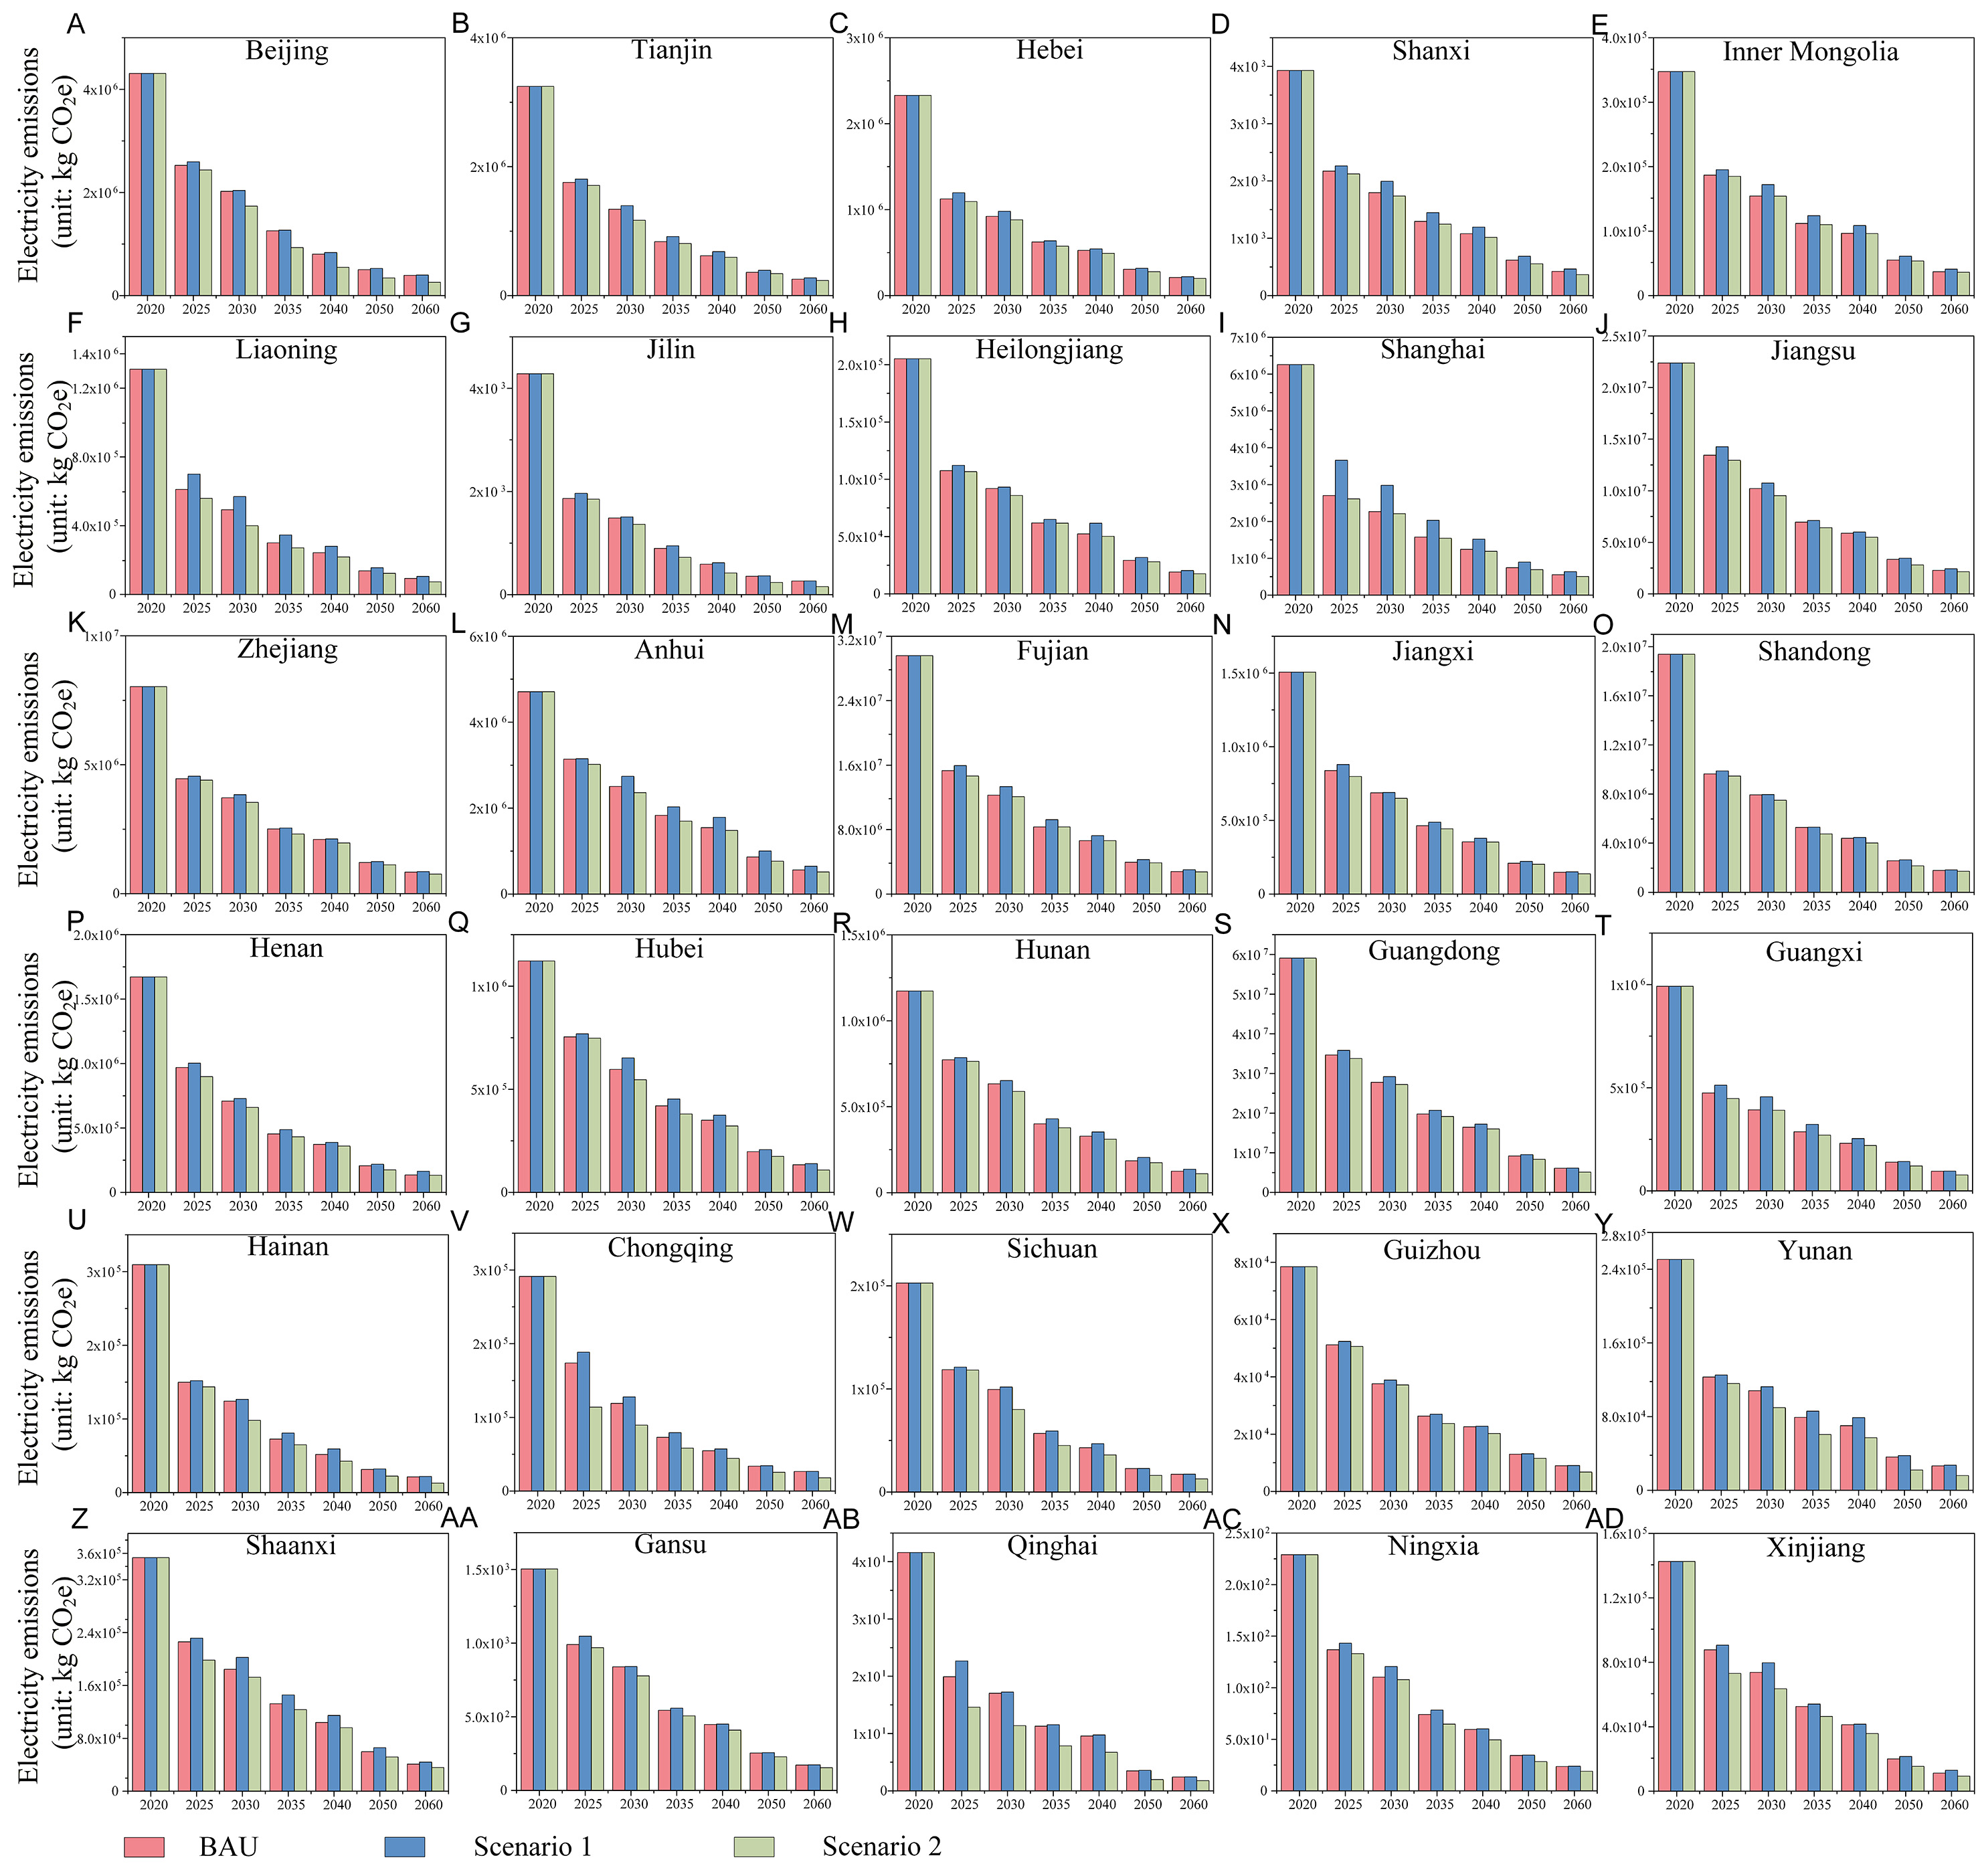
Figure 5. Provincial electricity emissions in the carbon footprint of exported cement products from 2020 to 2060 under the three scenarios: Business as usual (BAU), Scenario 1 (S1), and Scenario 2 (S2) (A-AD) (unit: kg CO2e). The red curves represent the electricity emissions under the BAU scenario across provinces, while the blue and green curves correspond to S1 and S2, respectively.


