


fig3
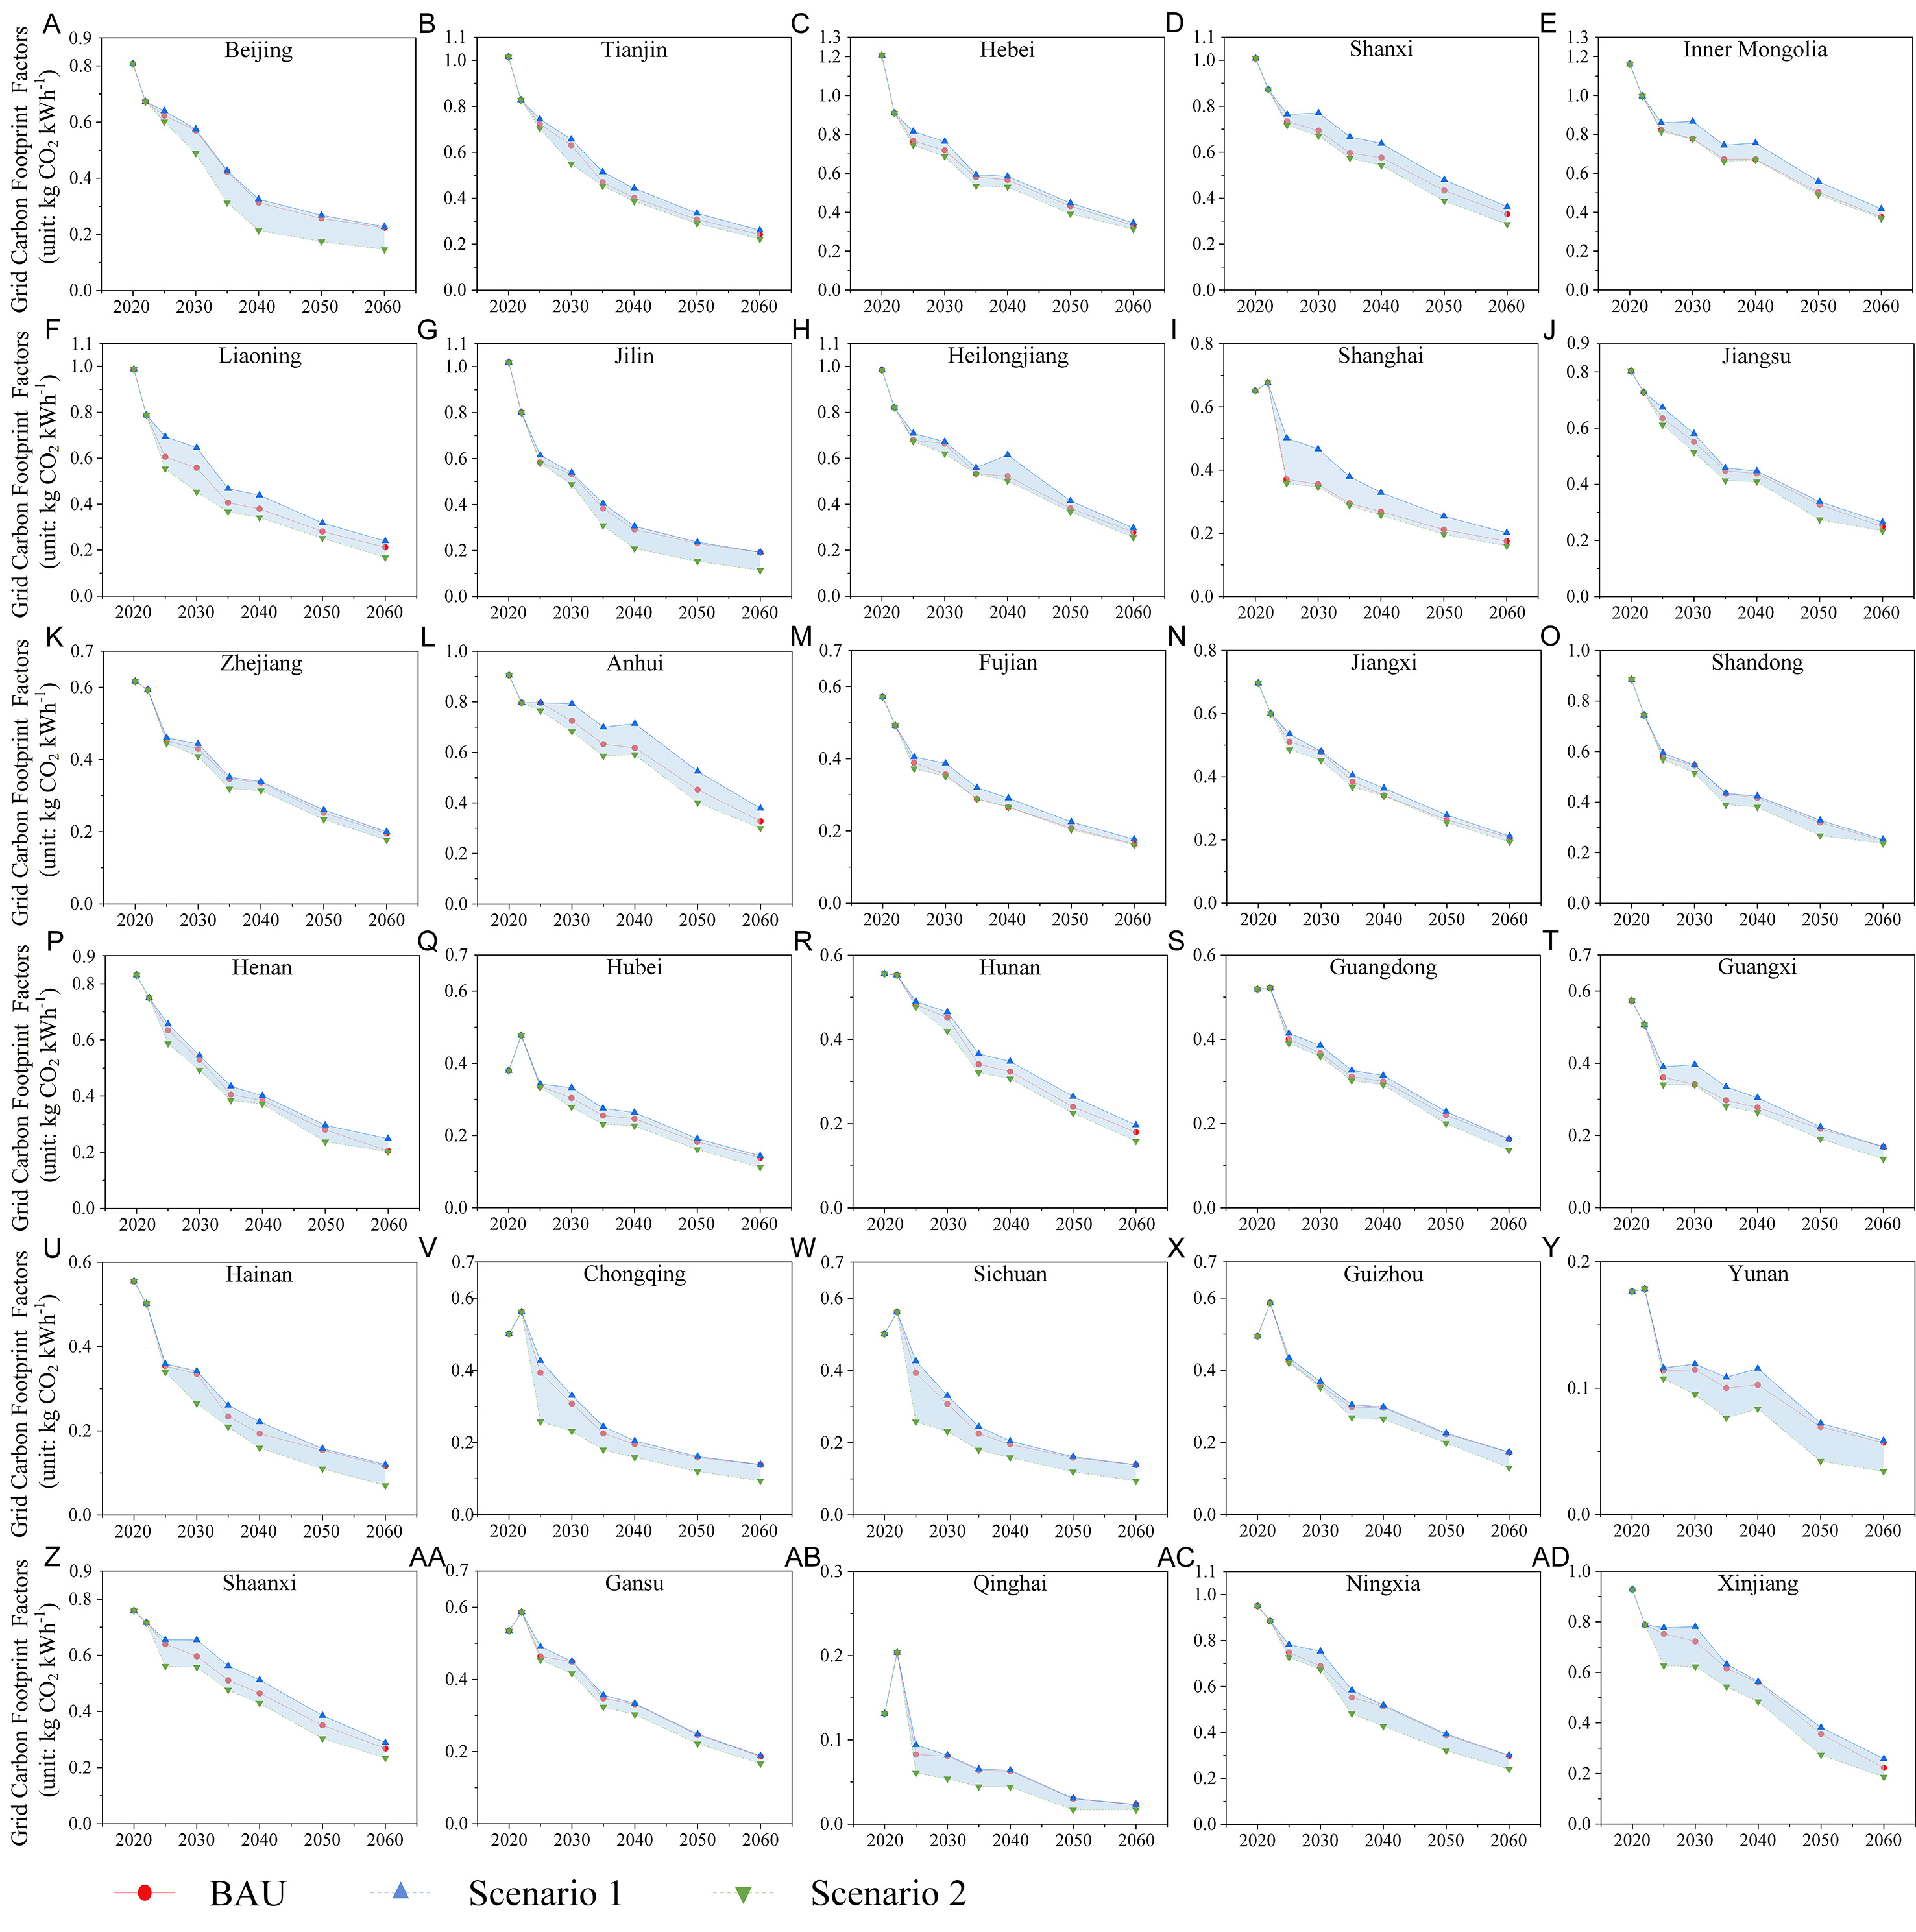
Figure 3. Provincial Grid Carbon Footprint Factors (GCFFs) from 2020 to 2060 under the three scenarios: Business as usual (BAU), Scenario 1 (S1), and Scenario 2 (S2) (A-AD) (unit: kg CO2e kWh-1). The red solid curves represent the GCFFs under the BAU scenario across provinces, while the blue and green dashed lines correspond to S1 and S2, respectively. The light-blue shaded area between the two dashed curves highlights the magnitude of divergence between the S1 and S2 pathways.


