

Carbon balance of yak ranch in alpine meadow
 0
0 Abstract
Livestock husbandry is a primary anthropogenic source of global greenhouse gas (GHG) emissions. The Qinghai-Tibetan Plateau (QTP), an important geography for animal husbandry in China, and is therefore a significant contributor to the global GHG budget. Therefore, this study employs the life cycle assessment method to comprehensively assess the effect of yak grazing on GHG balance and enhance our understanding and monitoring of GHG budgeting in the alpine ecosystem. The results show that yak grazing alters the GHG balance of alpine meadow ecosystems from sink to source (Critical value = 1.3 yak/ha). Sequestration of CO2 in soil organic matter is the most significant contributor to the GHG balance in both grazed and ungrazed grassland. In grazed grassland, enteric fermentation and livestock manure and its management (dung and urine patches, manure heaps, night pens, and dry stored manure combustion) are important contributors to the total GHG balance, where implementing mitigation practices that target reductions of enteric fermentation and improve manure management can help to alleviate these emissions. Due to the unique geographical and biophysical environment of the QTP, solar and wind energy are viable emission-free alternatives to dry manure consumption, and livestock enclosure has the potential to restore soil organic carbon stocks by increasing sequestration of atmospheric CO2. In conclusion, our findings suggest that successful implementation of targeted emission reduction measures is conducive to the sustainable development of animal husbandry, while also maintaining a balance with ecosystem functions under the multifaceted ecological landscape of QTP.
Keywords
INTRODUCTION
Global livestock husbandry - both extensive and intensive - is a major source of greenhouse gas (GHG) emissions, including carbon dioxide (CO2), methane (CH4), and nitrous oxide (N2O). It is contributing an estimated 18% of global anthropogenic GHG emissions[1]. Meanwhile, the increasing demand for meat, milk, and wool products has driven the rapid expansion of livestock husbandry, especially in developing countries, further increasing global GHG concentrations[2,3]. Consequently, GHG emissions from livestock husbandry have received worldwide attention[4]. Similarly, many field-level studies on GHG budgets of European agroecosystems, particularly those focusing on intensive and semi-intensive grasslands, report similar trends[5-7]. This approach has also been applied to diverse landscapes worldwide, including agricultural fields and undisturbed sites in the Middle East and Northeast United States, and temperate steppe pastures under medium and heavy grazing in both the United States and Inner Mongolia, China[3,8]. The extent to which livestock farming contributes to GHG emissions in high-altitude grassland ecosystems is still largely unexplored.
The Qinghai-Tibetan Plateau (QTP) is the highest (more than 4,000 m above sea level) and largest grassland area of both the Eurasian continent and China[9]. It plays a crucial role in the livestock industry[10]. Yaks (Bos grunniens) and Tibetan sheep (Ovis aries) are the two major ruminant species that play an important role in the Tibetan range, and due to their strong adaptability and productive performance[11]. There are approximately 13 million domestic yaks and 50 million Tibetan sheep grazing on the QTP[12]. Furthermore, recent trends indicate a consistent increase in livestock numbers on the QTP, driven by growing market demands and government support for pastoralist livelihoods. This escalating grazing intensity poses a significant threat to these fragile alpine ecosystems, underscoring the urgent need to quantify its climatic impacts[6]. Additionally, QTP is an ecological functional zone and provides ecological security for China and Asia due to its unique geographical location and climate characteristics[13]. Grasslands are distributed widely across the high plains and mountains of the QTP, and they cover the source areas of many major Asian rivers (i.e., the Yangtze River, the Yellow River and the Lan Cang River). Approximately 40% of the world’s population depends on or is influenced by these rivers[14]. Therefore, QTP plays a critical role in both China’s animal production and Asia’s broader environmental stability[15]. It has been an extensive reservoir of soil carbon for the past several thousand years due to its slow soil decomposition rates and relatively favorable photosynthetic conditions compared with cold, high-latitude ecosystems[15].
In addition to being a fundamental forage supply for livestock, the alpine grasslands of QTP are also of paramount importance in regulating the global GHG budget[12]. The escalating demand for animal products has resulted in higher stocking rates on the native alpine grasslands[16]. A primary consequence of overgrazing is the widespread degradation of the grassland ecosystem, which severely influences livestock management and alters the dynamics of GHG fluxes, including CO2, CH4, and N2O[17]. Although grazing-induced grassland degradation and associated carbon loss are global concerns in high-altitude regions, the mechanisms and magnitudes underlying them can vary significantly across diverse ecological conditions. For instance, in the European Alps, long-term historical grazing has led to more stabilized, albeit often species-poor ecosystems, where management focuses on maintaining biodiversity alongside carbon storage[18]. In contrast, the Andes, with its complex topography and diverse traditional pastoral systems, exhibits highly variable carbon dynamics that depend on specific practices and local climate[19]. QTP, however, is characterized by its extreme elevation, low temperatures, and relatively short growing season, which may expose its soil carbon pools to be particularly vulnerable to recent climates and rapid increase in grazing pressure. The typical alpine grassland soil is a natural carbon sink that can sequester atmospheric CO2 and oxidize CH4, but the soil has a strong potential to emit GHG if excessively grazed. The key GHG emission sources from alpine grassland animal husbandry on the QTP have been widely investigated in previous studies, i.e., enteric CH4 emission from ruminant livestock[20], CH4 and N2O emissions from livestock dung and urine patches deposited on pasture[12,21], and farm manure management and feedlot[22].
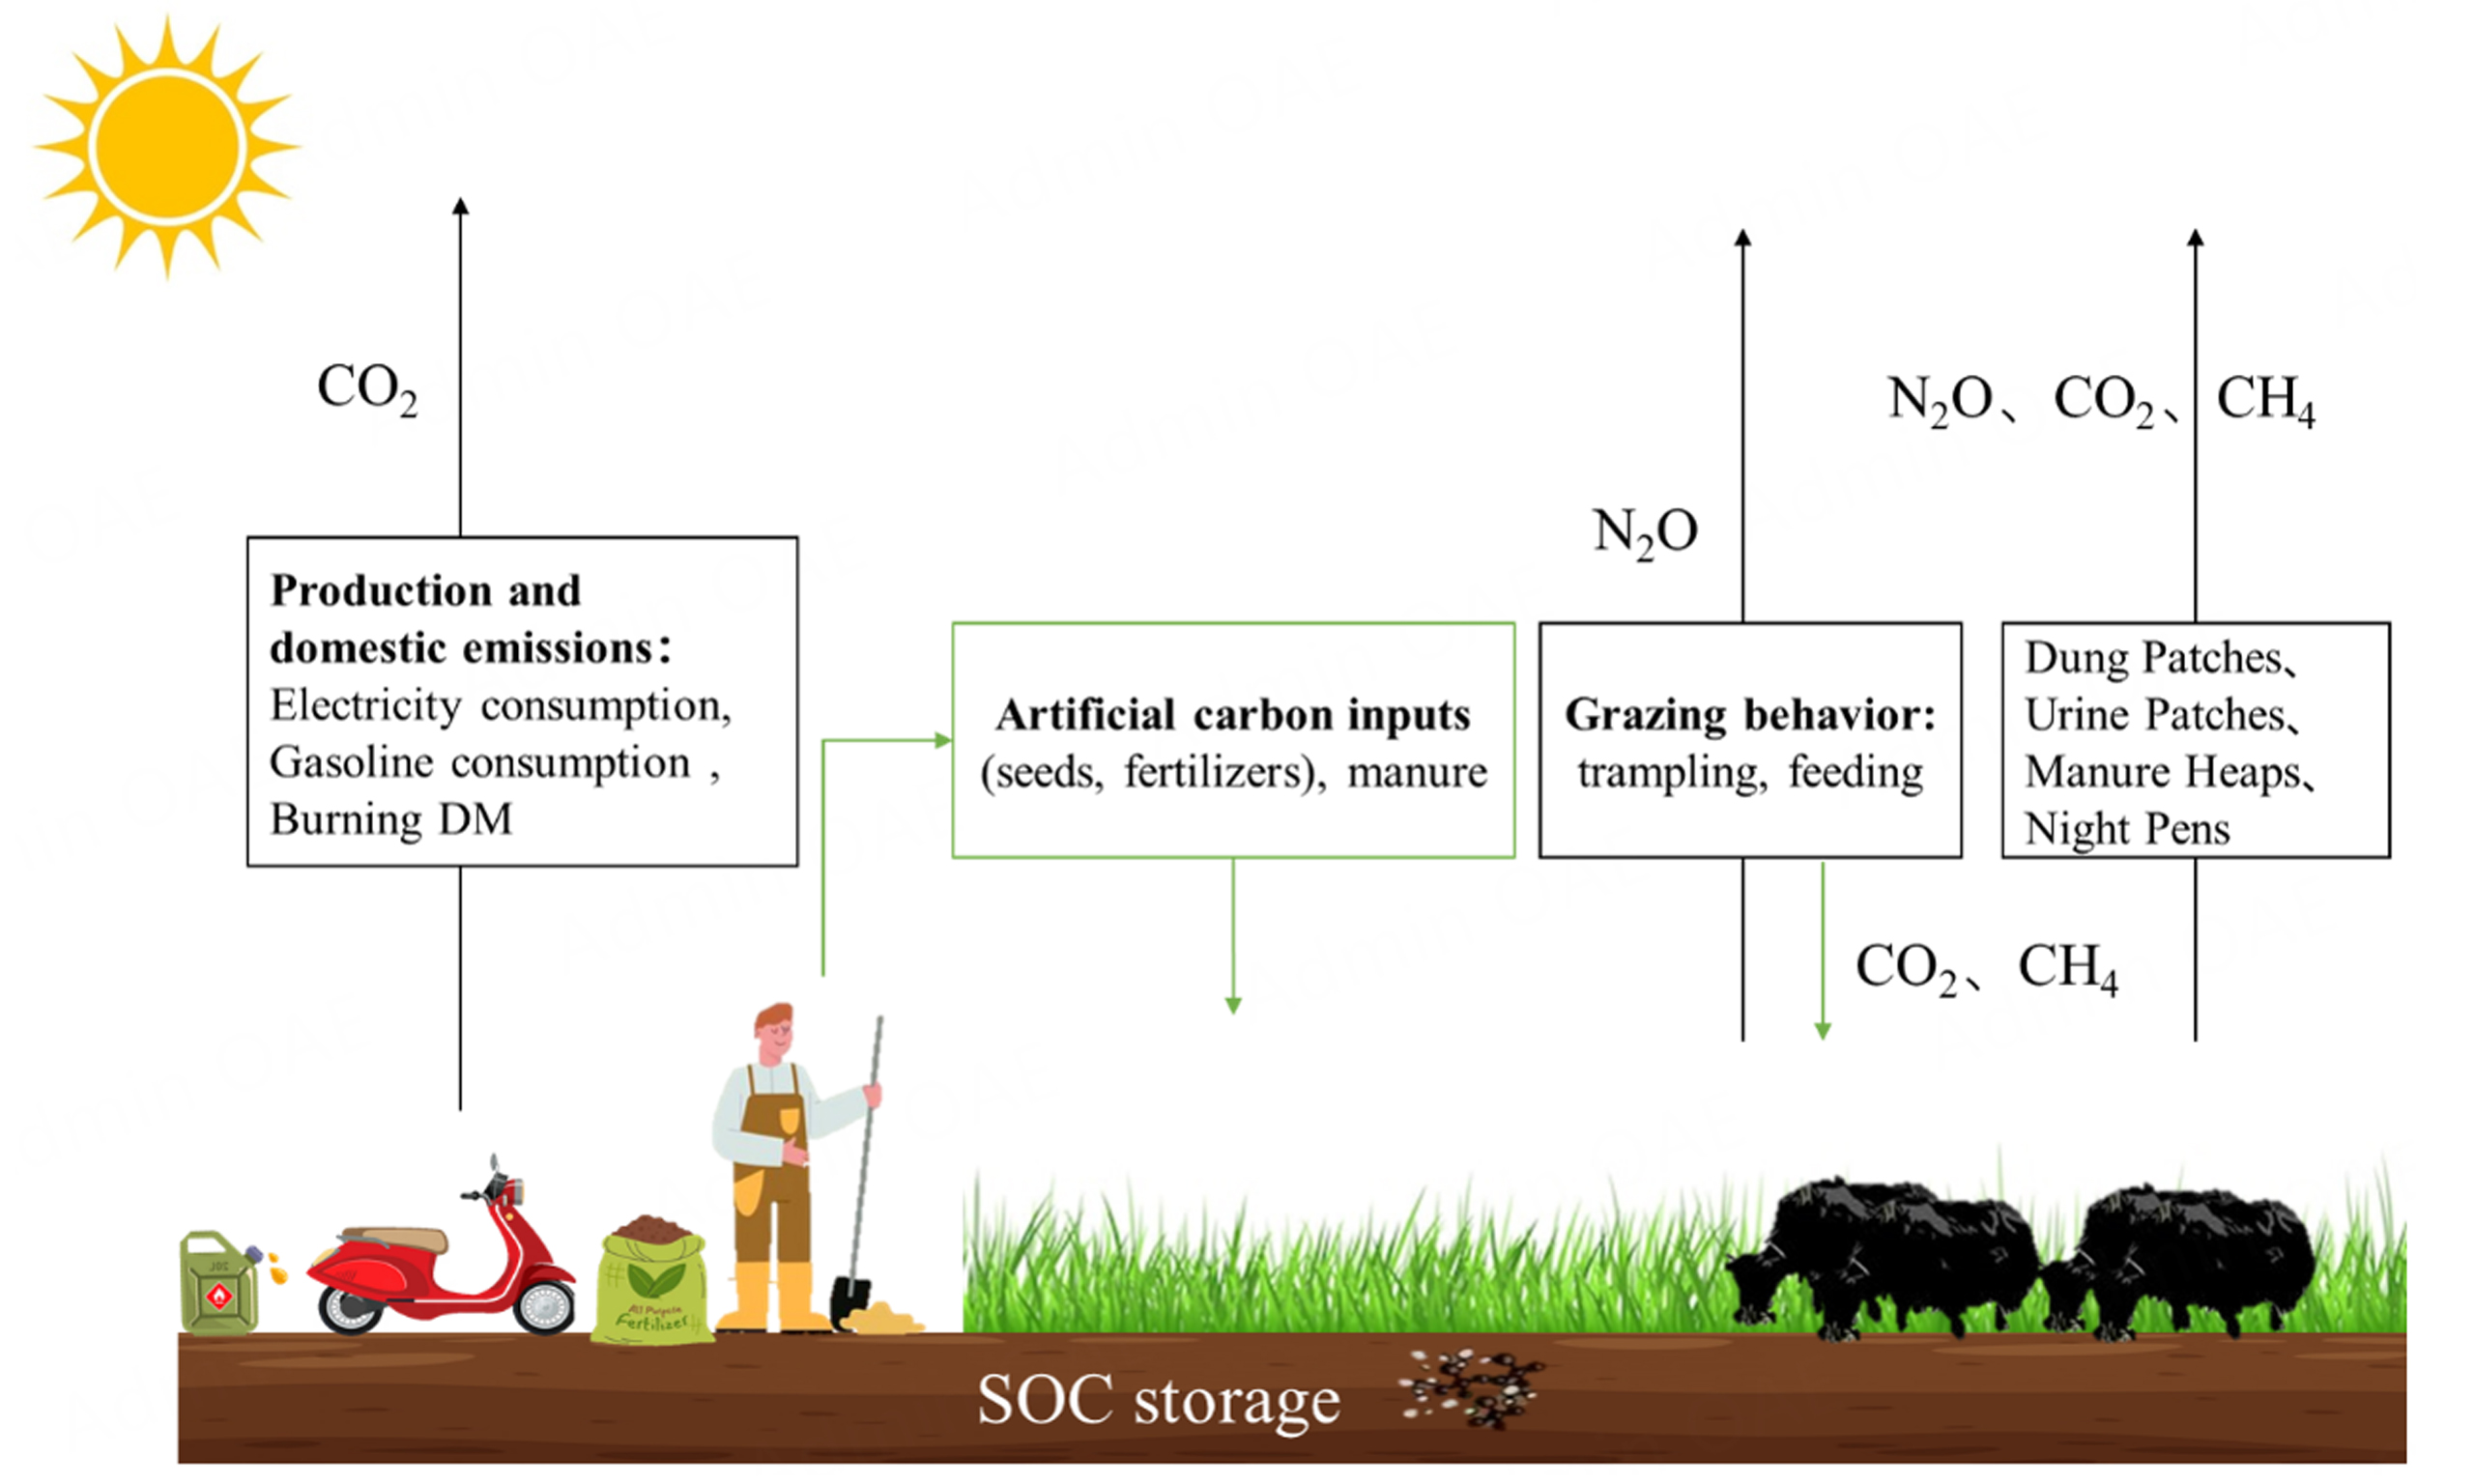
However, these studies represent only one sector of grazing farm systems, and a few studies have examined the entire process from a whole farm system modelling approach to examine the entire production process. Consequently, the net GHG budget associated with animal husbandry in alpine grassland ecosystems is still poorly understood, and we do not yet know what proportion of these key sources (i.e., enteric fermentation, manure management, feedlot and the indirect emission from farm input) contribute to the GHG emissions of the farm system, or by inference, where emission reductions might be most feasible. Based on the theory of ecology of interference, we propose that there is an optimal stocking rate; that is, during the adaptation period, GHG emissions increase with stocking rate up to a threshold, after which excessive interference leads to a decrease in emissions. Therefore, this study based on the pasture GHG cycling process and grassland energy input and output igure by using life cycle assessment method to adequately assess GHG emissions[Figure 1]. The specific objectives were to (1) estimate the GHG balance of an entire yak grazing farm under different grazing intensities in the alpine ecosystems of the QTP in China; (2) determine the relative contributions of the key sources to the GHG balance of yak grazing farm systems; and (3) determine optimal GHG mitigation strategies.
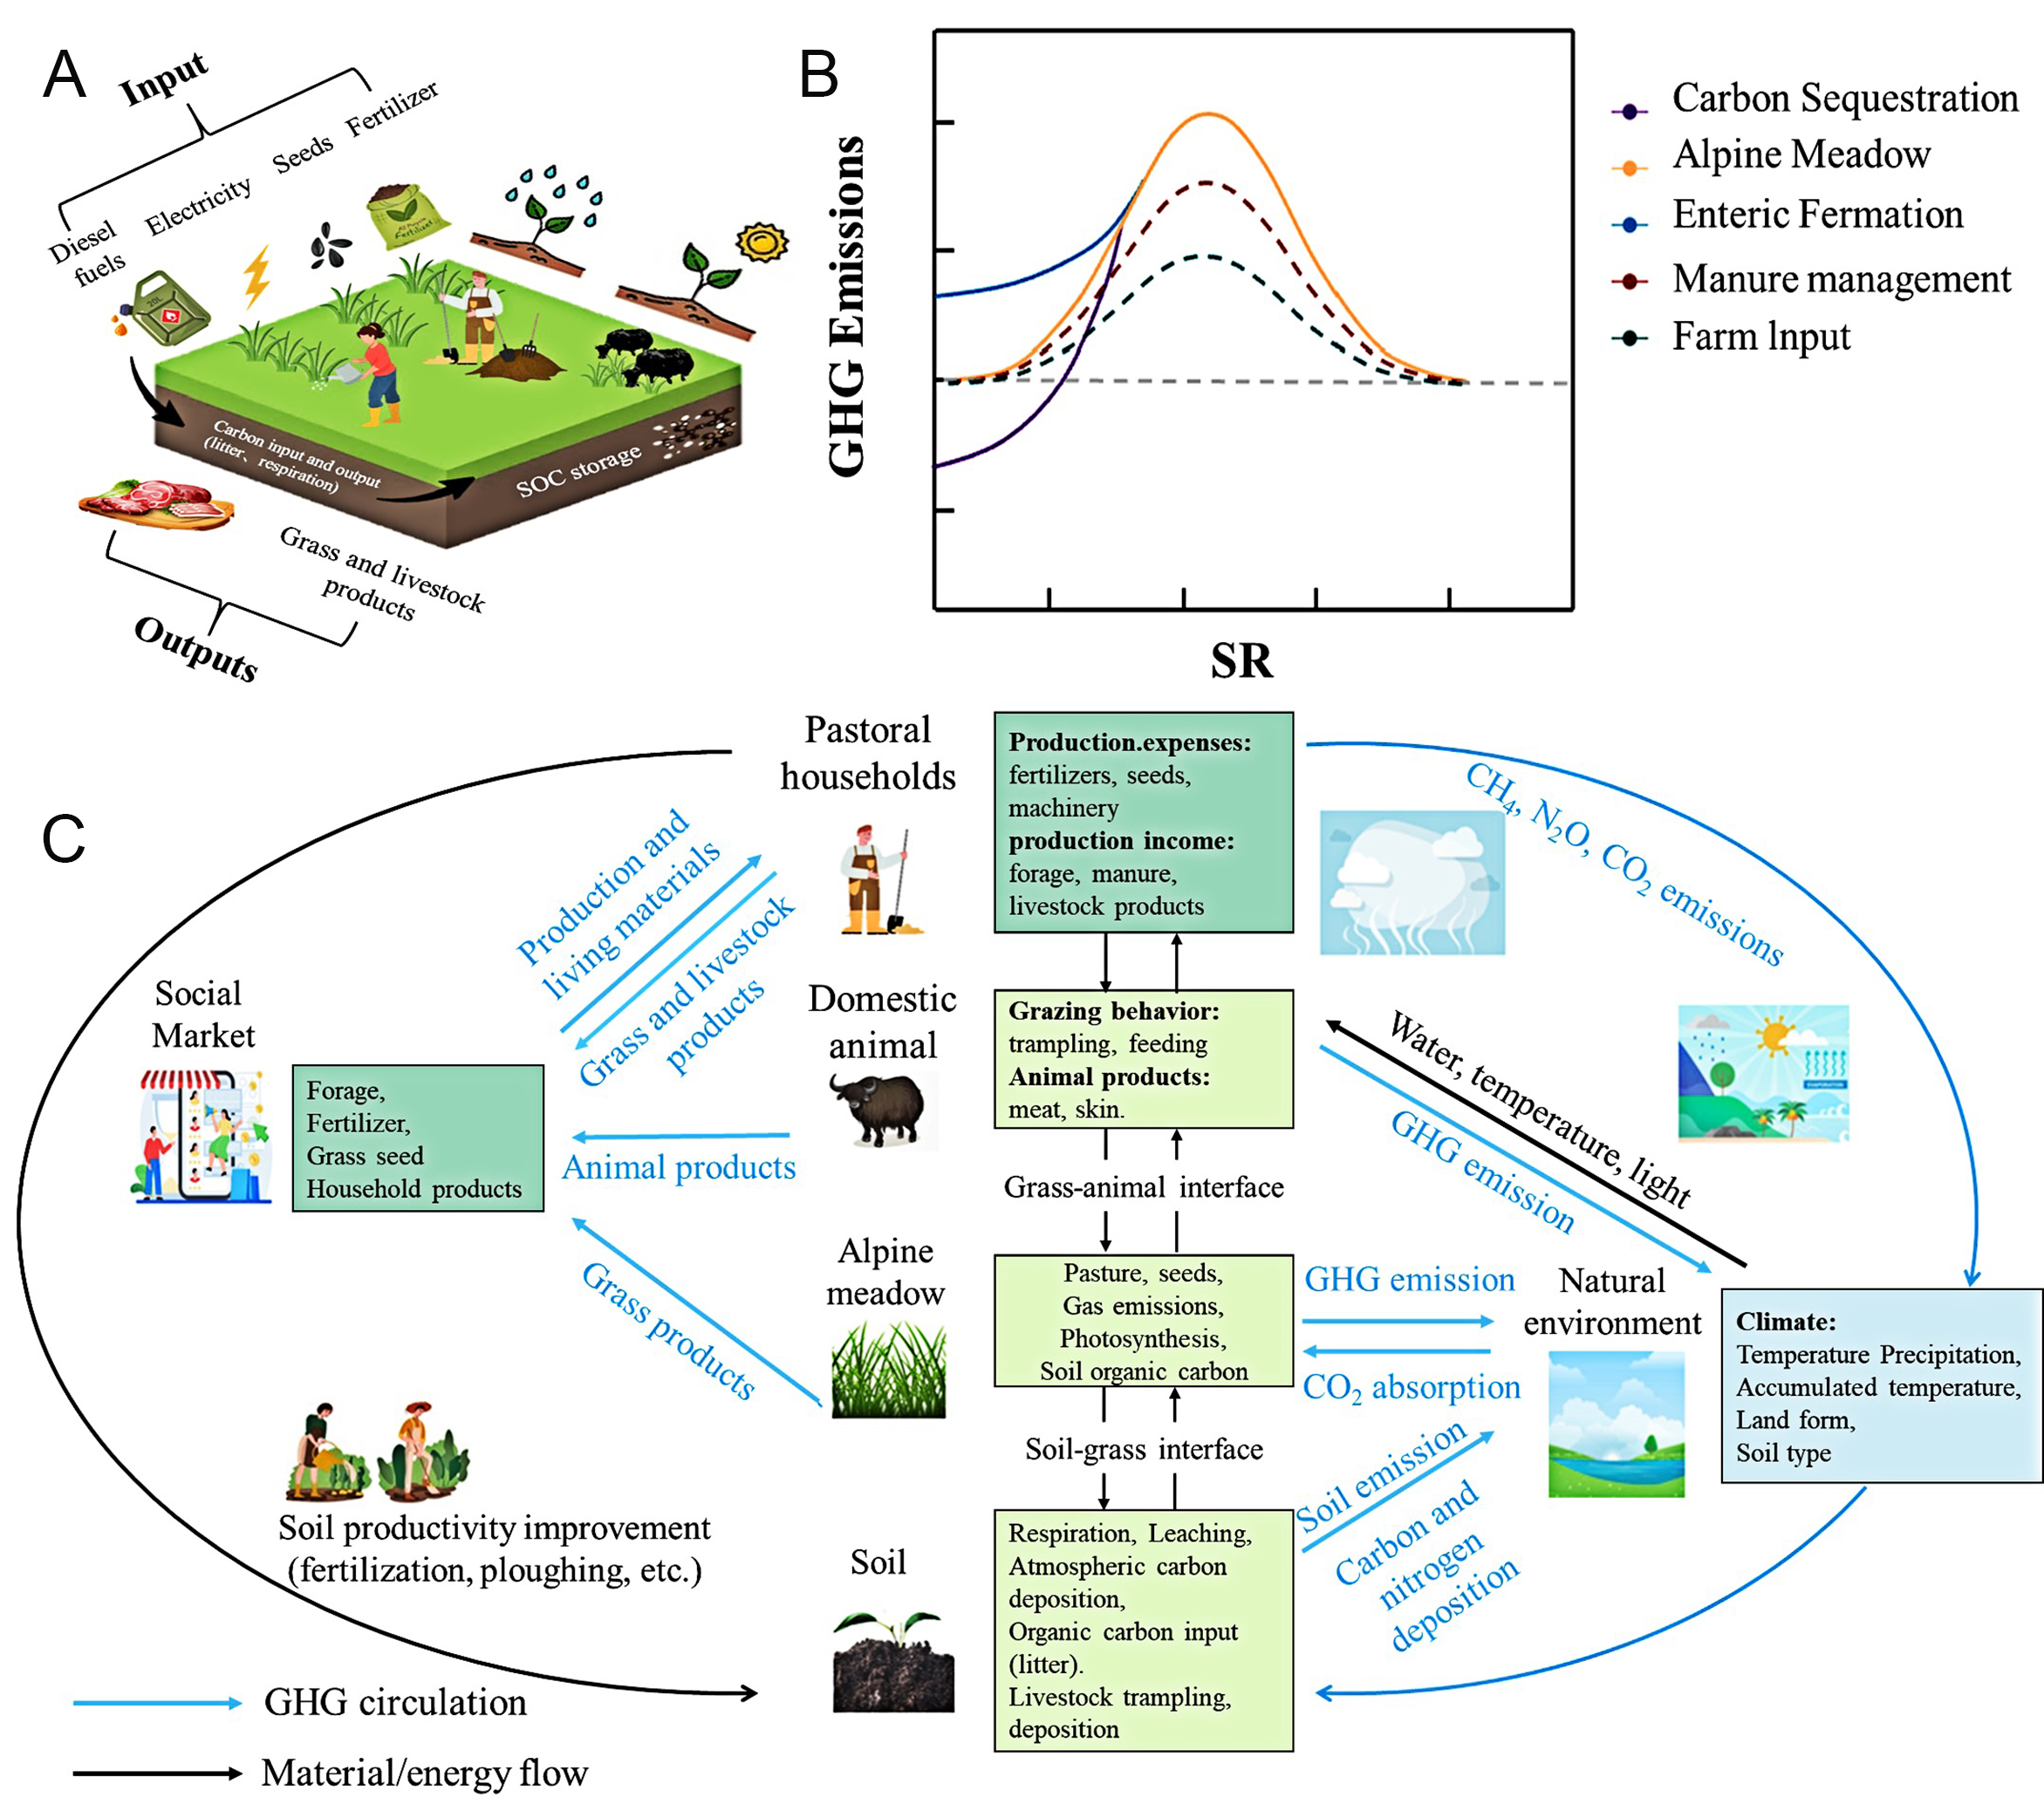
Figure 1. Carbon circulation in grassland production system (A), the effect of grazing rate on greenhouse gas flows (B) and a conceptual model of pasture greenhouse gas cycling (C).
METHODS AND MATERIALS
Research areas
The experimental research site is situated at the Azi Research Station in Maqu County, Gansu Province, China. This research station is located in the eastern part of the QTP at a longitude of 101°53' E and a latitude of 33°58' N, with an average elevation of 3,700 m. The climate is cold and humid, typical of the QTP[23]. The annual average temperature is approximately 1.2 °C, with the lowest monthly average around
To assess the effects of local yak grazing systems on the net GHG balance, we analyzed data from farms operating under different management practices from 2012 to 2013 [Table 1]. The specific management treatments investigated were a high stocking rate (HSR), a moderate stocking rate (MSR), a low stocking rate (LSR), and a fenced enclosure with no grazing. The setting of grazing intensity is based on
Farm structure at the household level, and input data at three stocking rates in Maqu County on the QTP
| Treatment | No of yaks (head) | Pasture area (ha) | Stocking rate (yak ha-1) | DM (kg day-1) | Electricity consumption (kWh year-1) | Gasoline consumption (t year-1) |
| HSR | 103 ± 25 | 56.00 ± 10.90 | 1.83 ± 0.11 | 18.20 ± 6.78 | 200.0 ± 18.3 | 0.21 ± 0.18 |
| MSR | 90 ± 17 | 88.83 ± 19.17 | 1.02 ± 0.03 | 28.77 ± 10.03 | 209.0 ± 33.4 | 0.22 ± 0.06 |
| LSR | 74 ± 27 | 104.47 ± 32.88 | 0.65 ± 0.01 | 22.97 ± 9.12 | 191.0 ± 31.4 | 0.22 ± 0.09 |
Description of yak grazing farm systems climatic data collection and processing
The yak-based agricultural systems of the QTP function as integrated production units where animal husbandry is intrinsically linked to nutrient cycling. The primary economic yield is yak meat, supplemented by valuable secondary products such as hides and processed manure. Animal performance is tightly coupled to the plateau’s phenology: substantial live-weight gains (LWGs) are confined to the grassland growing season (May-October). Conversely, the forage scarcity in the non-growing season imposes a nutritional deficit, often resulting in anabolic stasis or catabolic loss in the herd. A diurnal management cycle is central to this system’s operation. Yaks forage on alpine pastures during the day, thereby dispersing excreta across the grazing lands, and are corralled at night. This practice fulfills a critical protective function against predators and harsh weather, while simultaneously concentrating fecal matter within the enclosure. This concentrated dung is then harvested by herders and stockpiled into manure heaps. Following a period of air-drying, this resource is repurposed as a sustainable biofuel, providing essential energy for domestic cooking and heating, thereby closing a key nutrient and energy loop within the farm system. Thus, this manure is not returned to the grassland. At the same time, the farmers ride motorcycles instead of riding horses to manage the herd and consume power for living and lighting. Therefore, the energy consumption that is directly or indirectly generated can contribute to the GHG emissions, which act as farm input and influence the GHG balance of the yak grazing farm systems on the QTP.
GHG emission inventory data and calculation methods
The partial life-cycle-assessment method that was evaluated followed the whole-system GHG balance in compliance with International Organization for Standardization (ISO, 2006)[25] protocols, with the findings contextualized by both land area and annual LWG. The data underpinning this analysis were synthesized from multiple sources. Primary data included field-level quantifications of carbon sequestration and
Emission factor (EF) used for the calculation of GHG emissions from yak grazing farm systems
| Item | SR | EF kg CH4 ha-1 year-1 | Kg CH4 yak-1 year-1 | EF kg N2O ha-1 year-1 | kg N2O yak-1 year-1 | EF kg CO2-eq | References |
| Pasture (field level) | HSR | -0.30 ± 0.72 | - | 0.16 ± 0.04 | - | - | [22] |
| MSR | -2.03 ± 0.31 | - | 0.26 ± 0.15 | - | - | [22] | |
| LSR | -0.18 ± 0.44 | - | 0.13 ± 0.03 | - | - | [22] | |
| CK | -1.85 ± 0.38 | - | 0.12 ± 0.04 | - | - | [22] | |
| Dung patchesa | HSR | 40.37 ± 2.02 | 0.20 ± 0.01 | 7.93 ± 1.04 | 0.04 ± 0.01 | - | [22] |
| MSR | 15.93 ± 0.87 | 0.08 ± 0.00 | 15.40 ± 14.96 | 0.08 ± 0.07 | - | [22] | |
| LSR | 33.34 ± 11.73 | 0.17 ± 0.06 | 12.45 ± 4.00 | 0.06 ± 0.02 | - | [20,26] | |
| Urine patchesb | HSR | -3.54 ± 0.17 | -0.18 ± 0.01 | 5.96 ± 1.24 | 0.30 ± 0.06 | - | [20,26] |
| MSR | -3.42 ± 0.09 | -0.17 ± 0.00 | 11.87 ± 3.11 | 0.59 ± 0.15 | - | [20,26] | |
| LSR | -2.75 ± 0.27 | -0.14 ± 0.01 | 14.67 ± 3.35 | 0.73 ± 0.17 | - | [22] | |
| Manure heapsc | HSR | 600.35 ± 91.81 | 0.16 ± 0.03 | 14.12 ± 5.17 | 0.004 ± 0.003 | - | [22] |
| MSR | 1,578.11 ± 240.16 | 0.27 ± 0.12 | 19.56 ± 4.02 | 0.003 ± 0.002 | - | [22] | |
| LSR | 1,983.07 ± 590.00 | 0.30 ± 0.14 | 7.50 ± 1.73 | 0.001 ± 0.000 | - | [22] | |
| Night pensd | HSR | 530.45 ± 26.08 | 3.56 ± 1.02 | 85.56 ± 64.76 | 0.62 ± 0.63 | - | [22] |
| MSR | 1,484.10 ± 331.91 | 4.17 ± 0.68 | 19.56 ± 11.77 | 0.06 ± 0.03 | - | [22] | |
| LSR | 484.39 ± 24.02 | 1.43 ± 0.98 | 70.68 ± 1.43 | 0.20 ± 0.13 | - | [22] | |
| DM | - | - | - | - | 0.85 (oxidation rate)f | [23] | |
| Yak | |||||||
| Enteric fermentatione | - | 29.71 | - | - | - | [26] | |
| Farm input | |||||||
| Electricity | - | - | - | - | 0.9578 kWh-1 | [27] | |
| Gasoline for motorcycle | - | - | - | - | 74,100 TJ-1 | [27] |
Carbon sequestration
Carbon sequestration was quantified by following the methodology of Sun et al. (2012)[23]. This approach involved tracking changes in the organic carbon stock of the topsoil (0-5 cm). To this end, undisturbed soil core samples were obtained from the Ah-horizon annually from 2011 through 2013 for analysis. Soil samples were collected from the different grazing farm sites and the fenced site with a stainless steel cylinder. Soil organic carbon (SOC) was determined using the wet combustion method with K2Cr2O7 and concentrated H2SO4 at 170-180 °C. Bulk density (BD) was measured by dividing the mass of the samples that were oven-dried at 105 °C to constant weight by the core volume. SOC sequestration (SOCS)[23] was calculated using
To determine the net CO2 fluxes to the atmosphere, we analyzed changes in carbon sequestration over the 2012-2013 period. This net flux represents the overall balance of carbon, accounting for inputs via autotrophic fixation and outputs through autotrophic respiration (from plant metabolism) and heterotrophic oxidation (from organic matter decomposition). The calculation of carbon sequestration was based on several key variables: SOC storage (SOCS, kg m-2), which was computed using the SOC concentration (SOC, mg g-1), BD (g cm-3), the volumetric fraction of rock fragments > 2 mm (RF), and the sampling depth (cm). The annual rate of SOCS [ASOCS, kilograms per hectare per year (kg ha-1 year-1)] was then determined by dividing the change in SOCS from 2011 to 2013 by the number of years. It should be noted that potential losses of carbon and nitrogen through leaching were not considered within the scope of this study.
Pasture CH4 and N2O fluxes
The data on the fluxes of CH4 and N2O from grazing alpine meadows were adopted from our previous work[22]. We measured the seasonal dynamics of net CH4 and N2O fluxes in 2012 and 2013 using the static chamber method with three replicates on each sampling date and in each farm. During one sampling process, four gas bags were collected, with an interval of ten minutes each time. Sampling was conducted at 0, 10, 20, and 30 min after the box was closed, and the temperature inside the box and the surface temperature of the 0-5 cm layer before and after the box was closed were simultaneously recorded. Each sample was collected between 9:00 and 11:00 local time, representing the average emission flux for each day[26]. The calculation of these fluxes was based on the linear concentration changes of CH4 and N2O in the chamber headspace, followed by corrections for ambient air temperature, atmospheric pressure, and the physical dimensions of the chamber. To derive annual cumulative fluxes, daily mean values - calculated as the average of spatial replicates - were extrapolated across the entire year. In addition, CH4 and N2O fluxes were also measured simultaneously from a fenced alpine meadow using the static opaque chamber method in this study. Further details on CH4 and N2O fluxes measurements and calculation are provided in previous work by Liu et al. (2017)[22].
Enteric fermentation
The CH4 emission factor from yak enteric fermentation was calculated per yak using the results from
Manure management
Emissions of CH4 and N2O, along with their CO2 equivalent, are attributed to the manure management system, which covers yak night pens, manure heaps, and dung and urine patches from the dry stored manure combustion. The quantification of CH4 and N2O fluxes employed a hybrid methodology. Direct field-based quantification of emissions from night pens, manure heaps, and dung patches was undertaken over three seasonal periods (early, peak, and non-growing season) by means of the static chamber technique[20]. In parallel, the flux estimates for urine patches were extrapolated from the established values reported by Yang et al. (2019)[24]. Several assumptions are necessary to complete the inventory of GHG balance of yak grazing farm systems for unity and computing the GHG sources. The night pen areas per yak equals the total night pen area divided by the number of yak in each farm. The average yak dung and urine rates were 3.6 and 8.5 times, respectively, during the daytime. The average size of a dung patch was 22 cm in diameter, and each 1.0 L urine sample formed a urine patch approximately 0.16 m2 in size[28]. Furthermore, we assumed that 60% of the excrement (dung and urine) was released during daytime grazing on the pasture, whereas the other 40% was released in the pens at night[29,30]. Dry stored yak manure is the major bio-energy source used by herders for cooking and heating; the methodology for determining CO2 emissions from the dry manure consumption each day (DM) involved
where ED is the total yearly CO2 emission from dry stored manure combustion, Ccont is the carbon content (340.2 g total C kg-1 dry manure, which was measured in the laboratory) of yak dung, and Orate is the oxidation rate (assumed to be 85% in this present study)[31].
Farming inputs
The assessment of indirect GHG emissions was confined to those originating from the fossil fuel energy inputs required for key farming operations, specifically herd management and electricity provision. Field observations indicated that herd management was predominantly conducted using a conventional motorbike, and electricity consumption was solely for lighting purposes. The emission factors for the full lifecycle of these fuels - including production, transportation, and combustion - were derived from the IPCC (2006) guidelines[27]. These factors were then applied to activity data obtained from the operational balances of local yak grazing farms [Table 1] to determine the total indirect GHG emissions. The CO2 emissions from gasoline consumption caused by traffic demand were calculated using
where ET is the total CO2 emission from gasoline consumption each year, Ct is the gasoline consumption each year, NCVt is the net calorific value, and EFco2-t is the CO2 emission factor that was cited in the 2006 IPCC guidelines for national GHG inventories (IPCC, 2006)[27].
The indirect CO2 emissions from electricity consumption were calculated using
where Ep is the total CO2 emission from electricity consumption each year, Cp is the electricity consumption each year, and EFCO2-P is the CO2 emission factor from the power sector that was cited in the “2014 Baseline Emission Factors for Regional Power Grids in China” (NDRC, China).
Functional unit selection and data compilation
The assessment of GHG emissions was standardized using a functional unit, which acts as the common reference point for all system outputs. The primary analysis employed an area-based functional unit to determine the net GHG balance. Subsequently, to evaluate the production efficiency, a performance-based metric was introduced: the GHG intensity. This metric was calculated by dividing the area-based net GHG balance by the corresponding LWG per unit area. As a result, the final GHG outcomes were dual-dimensional: the annual net GHG flux was reported both on an areal basis [in kg CO2-equivalents
Statistics analysis
The statistical analysis focused on differences in carbon sequestration, CH4 and N2O fluxes from each source, and the net GHG balance among four grazing management types: HSR, MSR, LSR, and a fenced control. For this analysis, a One-Way Analysis of Variance was implemented using Statistical Product and Service Solutions (version 20.0). Following a significant ANOVA result, Tukey’s post-hoc test was utilized to conduct pairwise comparisons of the treatment means, with differences considered statistically significant at P < 0.05.
RESULTS
Net GHG fluxes of alpine meadow
From 2012 to 2013, LSR did not reduce SOC compared with other treatments. Topsoil organic carbon stocks increased in the enclosed (no grazing) site. The topsoil organic carbon stock at the LSR, MSR, and HSR sites demonstrated a trend of being either largely stable or marginally depleted [Figure 2]. Therefore, the topsoil organic carbon stocks were depleted in moderate and heavy grazed alpine meadows. In contrast, grazing exclusion significantly increased the topsoil organic carbon stocks. A decline in the topsoil organic carbon stocks at the MSR and HSR sites indicates that these areas function as net sources of CO2. Conversely, an increase in carbon stock in ungrazed grasslands demonstrates their role as effective CO2 sinks [Figure 2B]. While the alpine meadow served as a significant CH4 sink, this crucial ecosystem function was substantially constrained by grazing activities. NO2 gas emissions in the alpine meadow showed a hump distribution, and the maximum emissions reached 60.87 NO2 eq/year (Nitrogen dioxide equivalent/year) when the stocking rate was 1.19 yak/ha, and the CO2 gas level gradually increased as the stocking rate increased. The GHG flow of the alpine meadow is mainly methane absorption and nitrous oxide emission. With the increase of stocking rate, the absorption capacity of methane decreases and the emission capacity of nitrous oxide increases [Figure 2C].
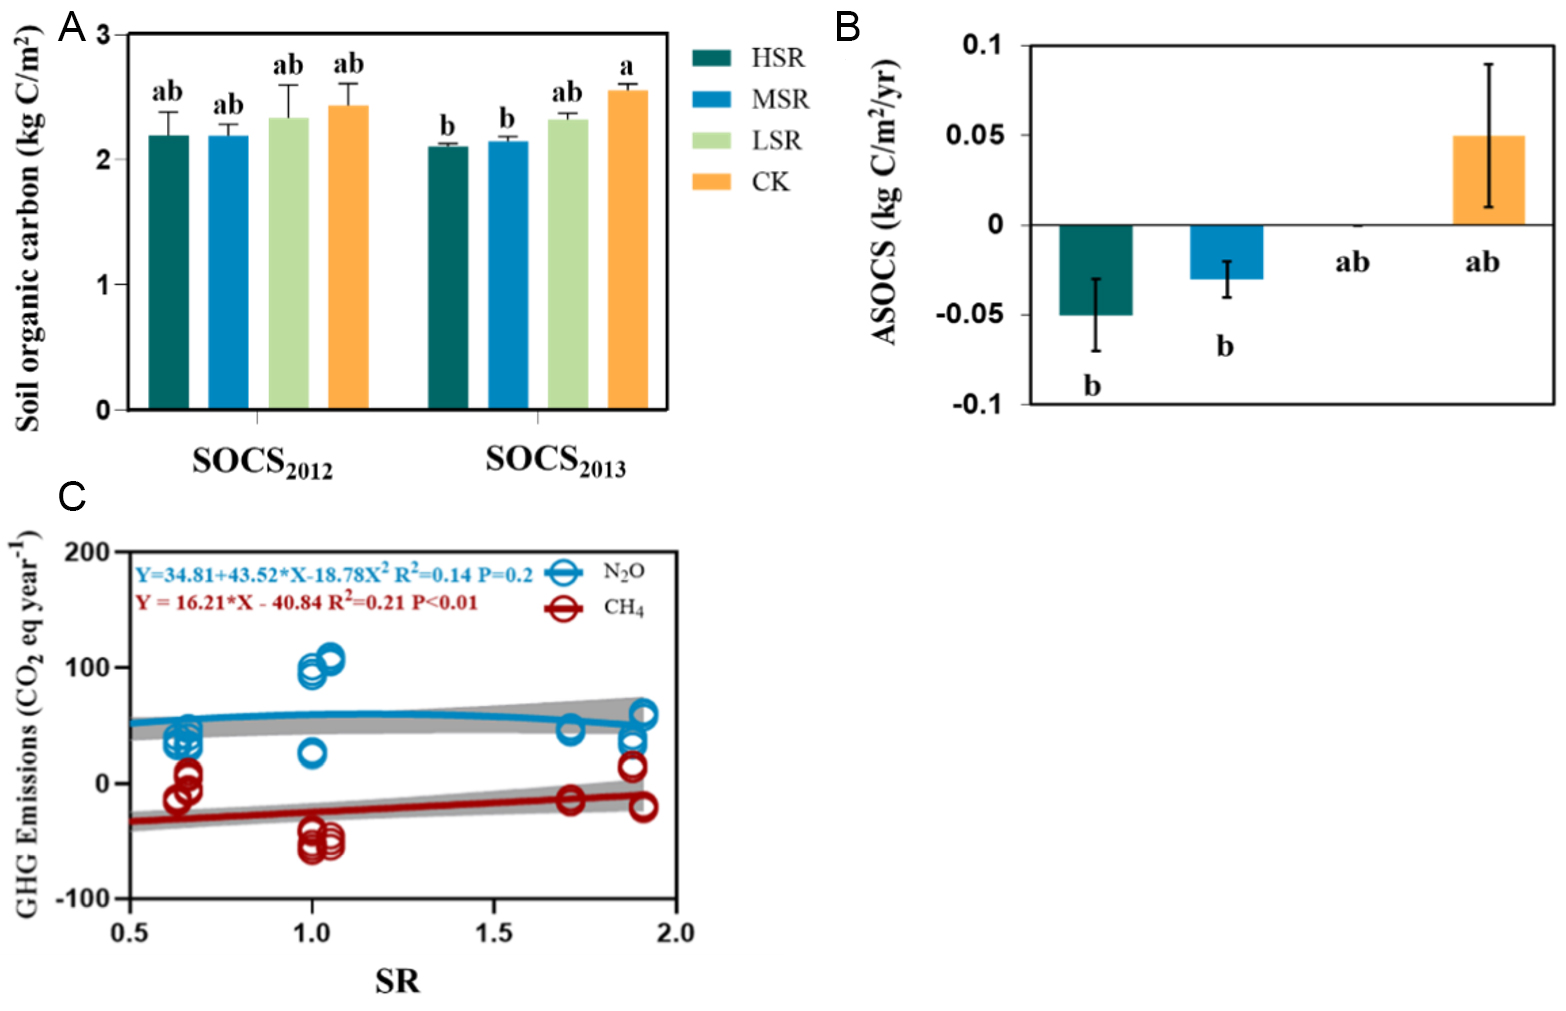
Figure 2. An investigation of surface soil (0-5 cm) organic carbon stocks, annual carbon sequestration rates, and the correlation between greenhouse gas emissions and livestock stocking rates. Mean ± SD (n = 3); (A) Soil organic carbon stocks (SOCS) content; (B) ASOCS, annual sequestration of soil organic carbon stocks; HSR: High stocking rate; MSR: moderate stocking rate; LSR: low stocking rate; Fenced: no grazing. Positive values indicate carbon sequestration and negative values indicate carbon release; (C) greenhouse gases (GHG) change with the stocking rate increase. In analyses of significant differences, different letters (such as a, b) are used to denote the level of significance for differences between groups. Identical letters indicate no significant difference (P > 0.05), while different letters indicate a significant difference (P < 0.05).
Enteric fermentation and manure management
The enteric CH4 emissions were not measured directly, but we adopted the emission factor from Ding et al. (2010)[26], who reported a value of 81.4 g CH4 day-1 yak-1 at an estimated daily grass DM intake of 3.78 kg for 3-year-old growing yak steers (175 ± 10.7 kg)[25] [Table 2]. The GHG emissions from manure management comprised night pens, manure heaps, dung patches, urine patches and DM combustion, and the totals were 319.16 ± 141.15, 453.33 ± 54.77, and 833.94 ± 460.70 kg CO2-eq ha-1 year-1 for LSR, MSR, and HSR, respectively [Table 2]. Urine patches emit N2O gas, with the highest emission at a stocking rate of 1.33, reaching 188.7 carbon dioxide equivalent per year. Manure Heaps CH4 emissions manure heaps CH4 emissions were maximum when the grazing rate was 1.5, reaching 8.15 kg CO2-eq ha-1 year-1. Methane emissions reached their highest point at night pens when the stocking rate was 1.6, and emissions decreased when the stocking rate was further increased or decreased [Figure 3].

Figure 3. Relationship between greenhouse gas emissions and enteric fermentation and dung DM.
Farming inputs
Average electricity consumption and motorcycle gasoline were the farming inputs in the system and amounted to approximately 200 kWh and 210 kg of gasoline each year, respectively [Table 1]. The consumption of electricity and gasoline resulted in GHG emissions of 8.30 ± 3.37, 10.66 ± 2.36 and
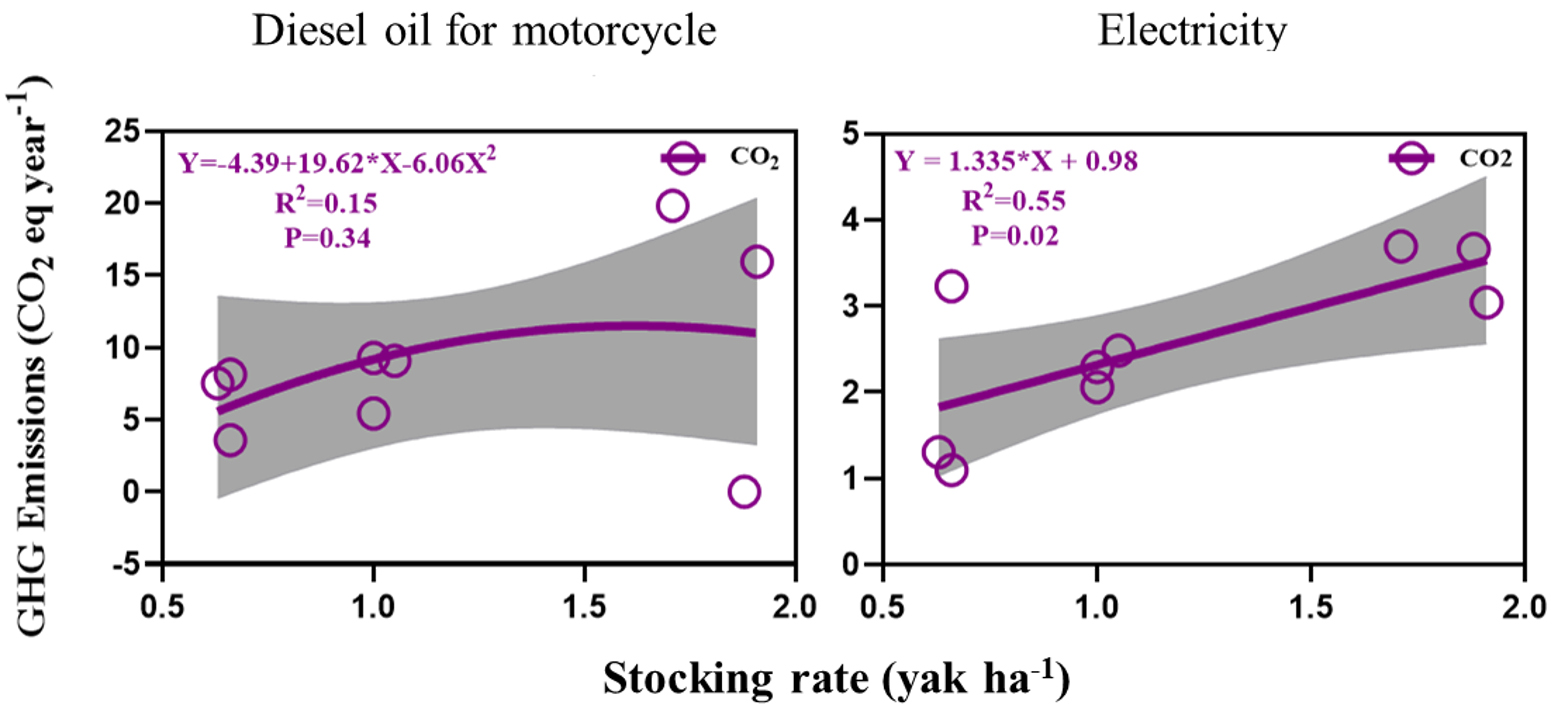
Figure 4. Relationship between greenhouse gas emissions and Farming inputs.
GHG balance and intensity
The GHG balances were expressed per unit area and per unit of animal LWG to calculate the GHG intensity. At a grazing rate of 4 yak/ha, the carbon use efficiency was 11.3%. The carbon sequestration amount was 23.2 t/ha/a, with a carbon sequestration efficiency of 2.0%. At this grazing rate, the carbon cycling and sequestration were relatively low. When the grazing rate increases to 8 yak/ha, the carbon input and carbon use efficiency rise to 12.7%. The carbon sequestration amount declines slightly to 21.5 t/ha/a, while the carbon sequestration efficiency significantly increases to 2.4%. This indicates that at this grazing rate, the carbon cycling and sequestration capacity of the pastoral ecosystem are optimized to some degree. At a grazing rate of 16 yak/ha, the carbon input and carbon use efficiency continue to decline to 12.4%. The carbon sequestration amount further decreases to 21.1 t/ha/a, and simultaneously, the carbon sequestration efficiency also drops to 2.3%. As grazing rate increases, carbon input and carbon sequestration efficiency exhibit an initial increase followed by a decrease. At an appropriate grazing rate (such as 8 yak/ha), the carbon cycling and sequestration capacity of the pastoral ecosystem can be optimized. However, excessively high grazing rates (such as 16 yak/ha) put pressure on the pastoral ecosystem, leading to decreases in carbon input and carbon sequestration efficiency [Figure 4].
The results indicated that the enclosed alpine meadow ecosystems act as the GHG sinks, and grazing, compared to ungrazing, significantly increased the GHG emissions (P = 0.023, 0.003 and 0.0002 for LSR, MSR, and HSR, respectively) [Figure 5]. The net GHG balance of the fenced treatment was
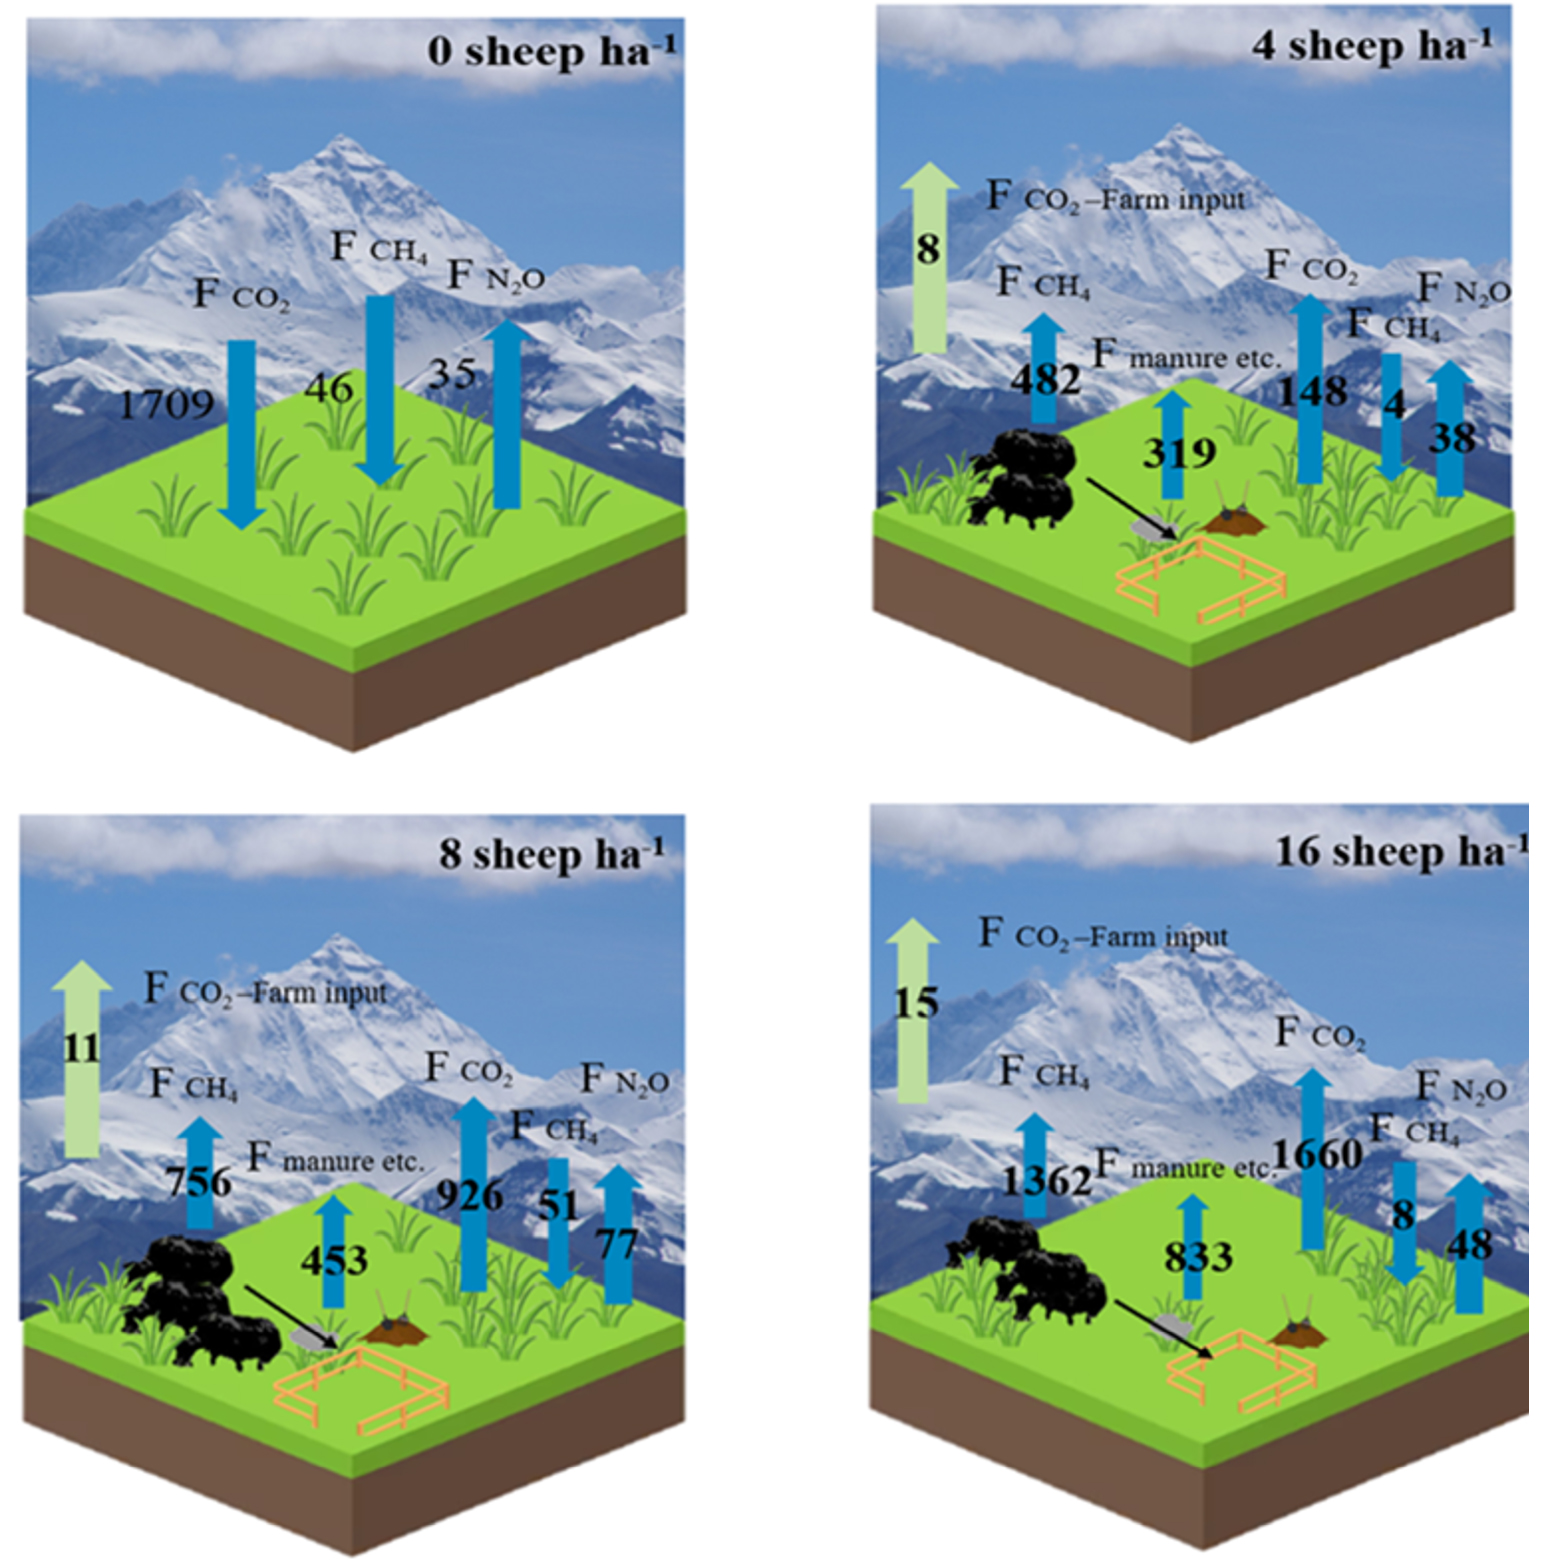
Figure 5. Net GHG balance (kg CO2-eq ha-1 year-1) of yak grazing farm system under different grazing management. NGHG: Net GHG emission balance; HSR: high stocking rate; MSR: moderate stocking rate; LSR: low stocking rate; Fenced: no grazing. Negative values indicate uptake, and positive values indicate emission. FCO2-Farm input refers to the indirect emissions of GHG originating from the combustion of fossil fuels to support agricultural operations, including herd management and electricity supply. Fmanure indicates the total GHG emission from manure management, including CH4 and N2O emissions from yak night pens, manure heaps, dung and urine patches and CO2 equivalents from the combustion of dry stored manure.
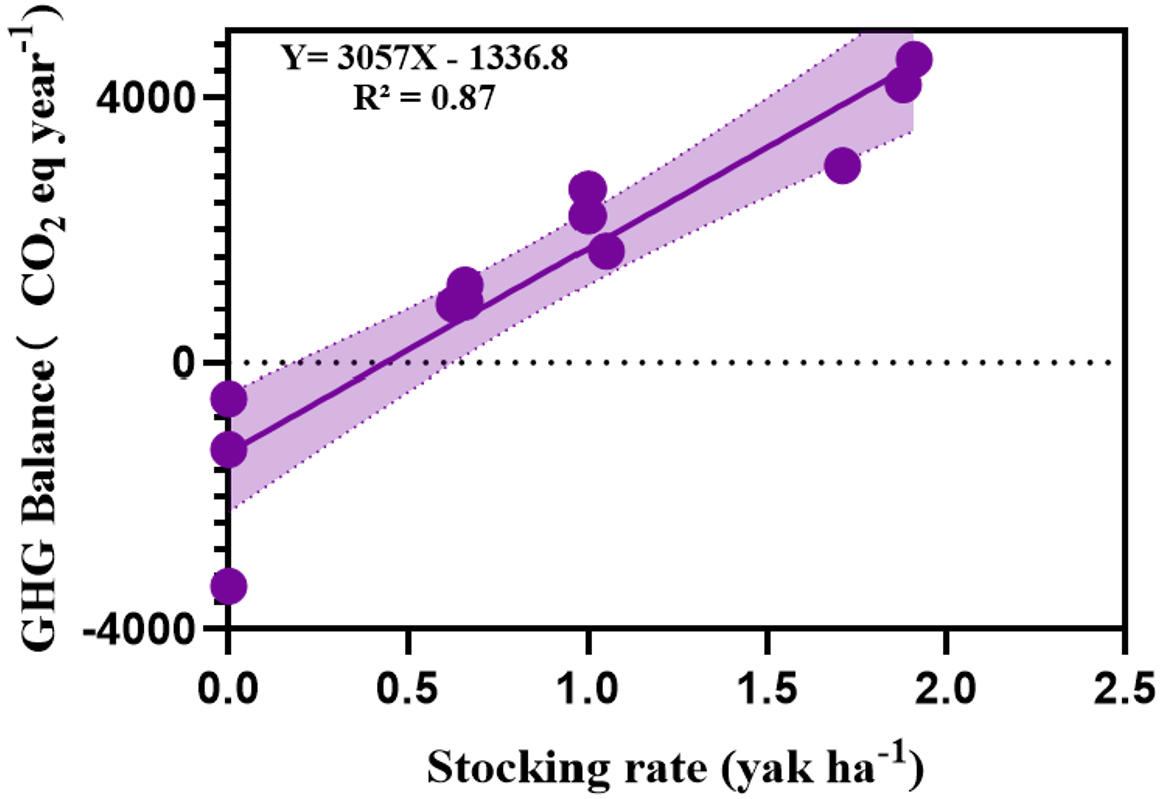
Figure 6. The relationships between the GHG balance and the stocking rate in yak grazing farm systems.
Analysis of GHG emissions and balance
The GHG balance of both grazed and ungrazed systems was significantly influenced by CO2 originating from carbon sequestration. Pasture CH4 and N2O fluxes accounted for 2.7% and -2.0%, respectively, of the total GHG balance for the ungrazed scenarios. In the grazed scenarios, enteric fermentation and manure management were the second and third most important components, contributing 34.8%-48.7% and
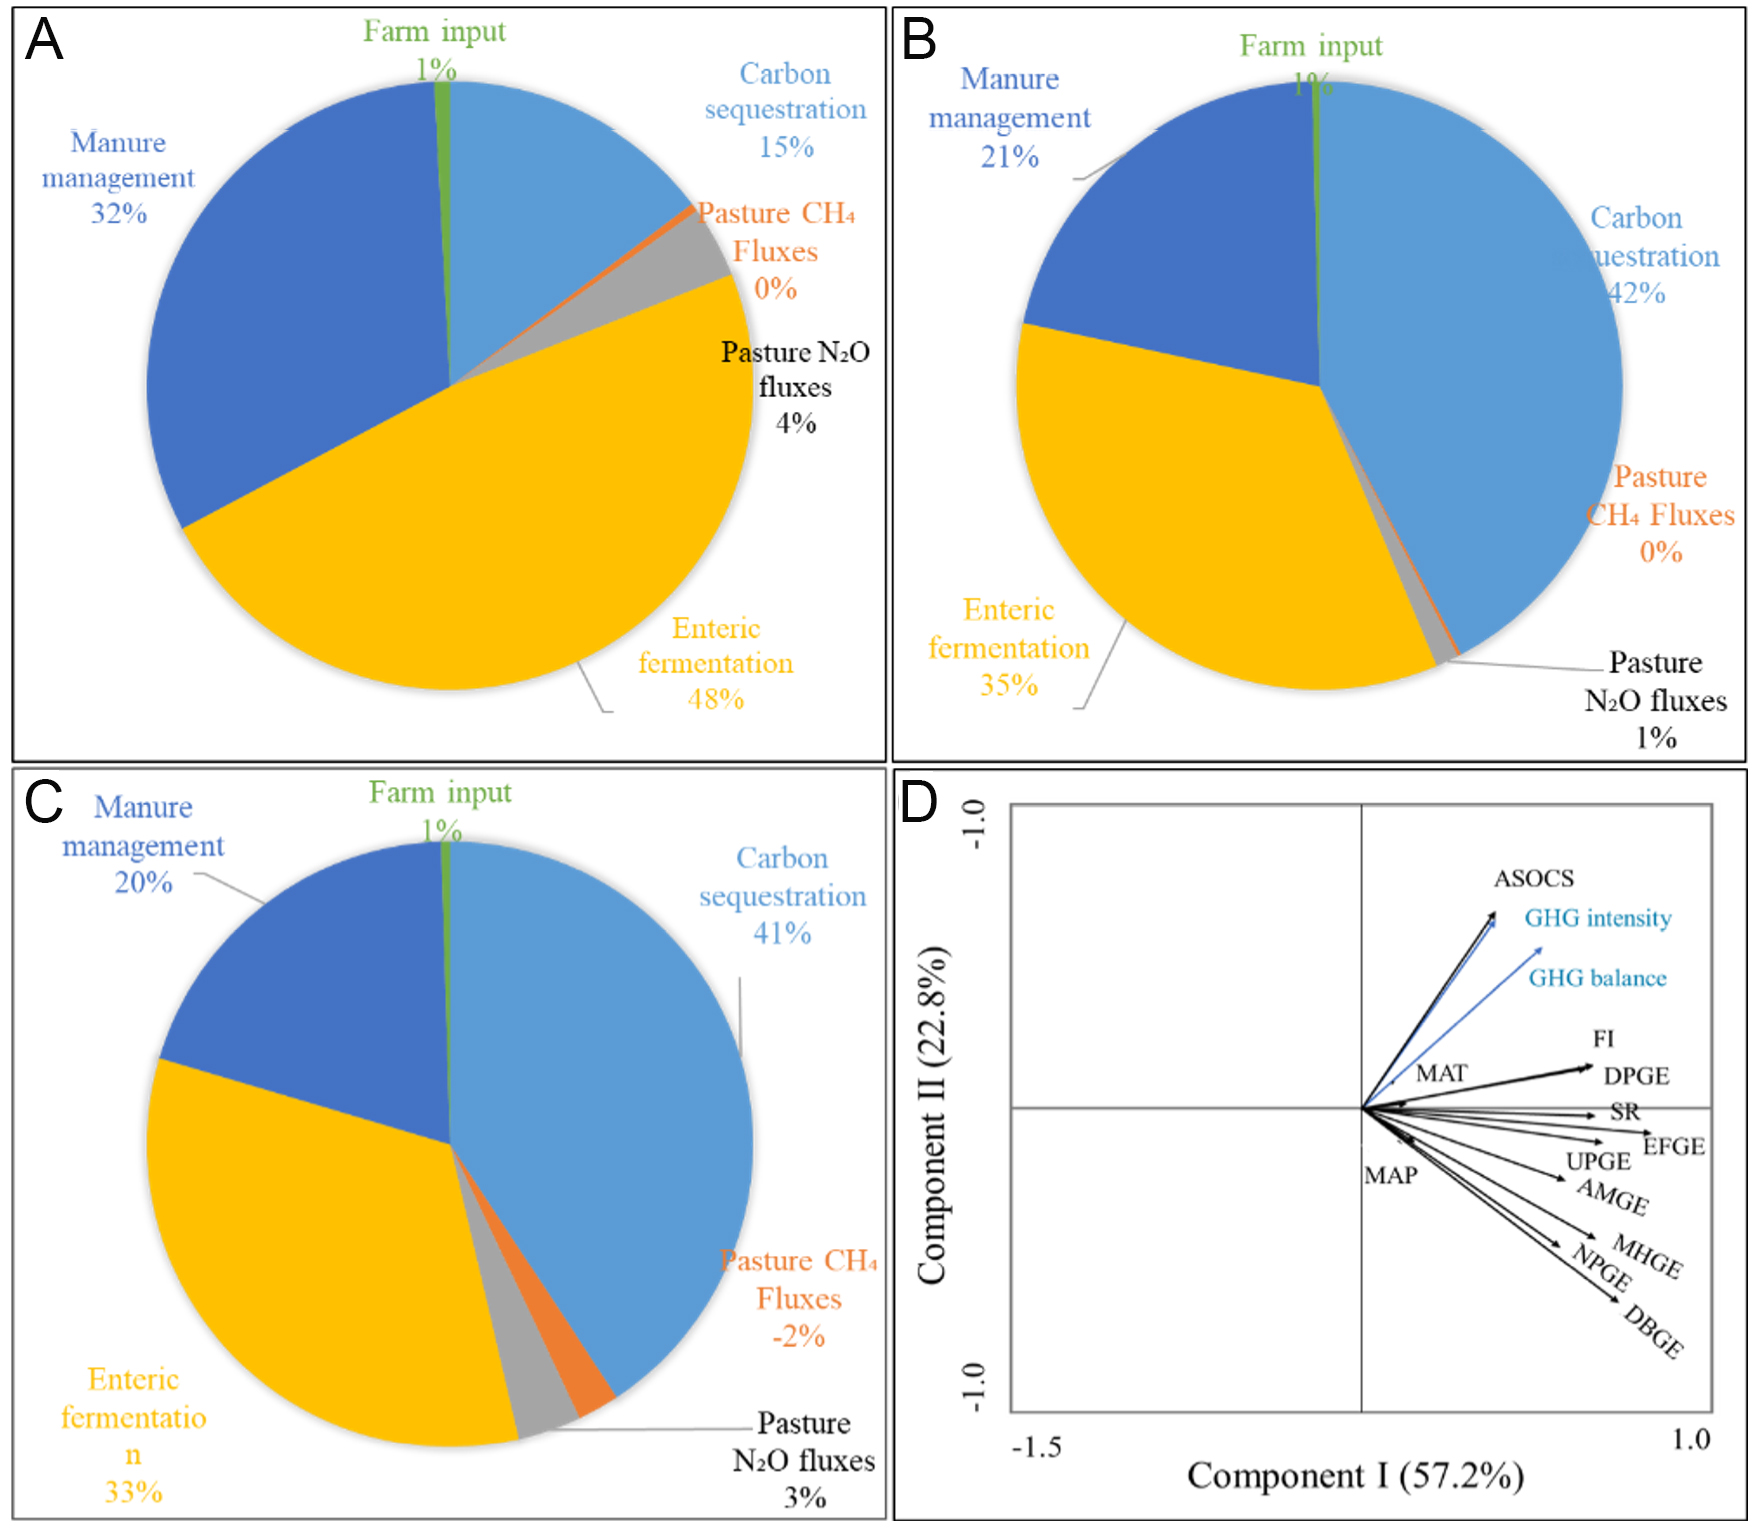
Figure 7. Greenhouse gas contribution rate and principal component analysis of greenhouse gas balance under different stocking rates. (A-C) represent LSR, MSR and HSR systems, respectively. (D) shows RDA analysis. AMGE: Alpine meadow GHG emissions; EFGE: enteric fermentation GHG emissions; FI: farm input; DPGE: dung patches GHG emissions; UPGE: urine patches GHG emissions; MHGE: manure heaps GHG emissions; NPGE: night pens GHG emissions; DBGE: dung burning GHG emissions; SR: stocking rates; MAT: mean annual temperature; MAP: mean annual precipitation.
DISCUSSION
Grazing intensity mediates soil carbon dynamics through coupled biophysical mechanisms
The depletion of topsoil organic carbon (SOC) stocks observed under grazing regimes
Yak husbandry systems as nonlinear GHG emitters: from rumen to landscape
The hump-shaped relationship between stocking rate and GHG emissions (peak at 1.19 yak/ha, Figure 8) challenges conventional linear emission models, revealing threshold behaviors unique to high-altitude pastoral systems. Enteric CH4 emissions (34.8%-48.7% of total balance) follow allometric scaling
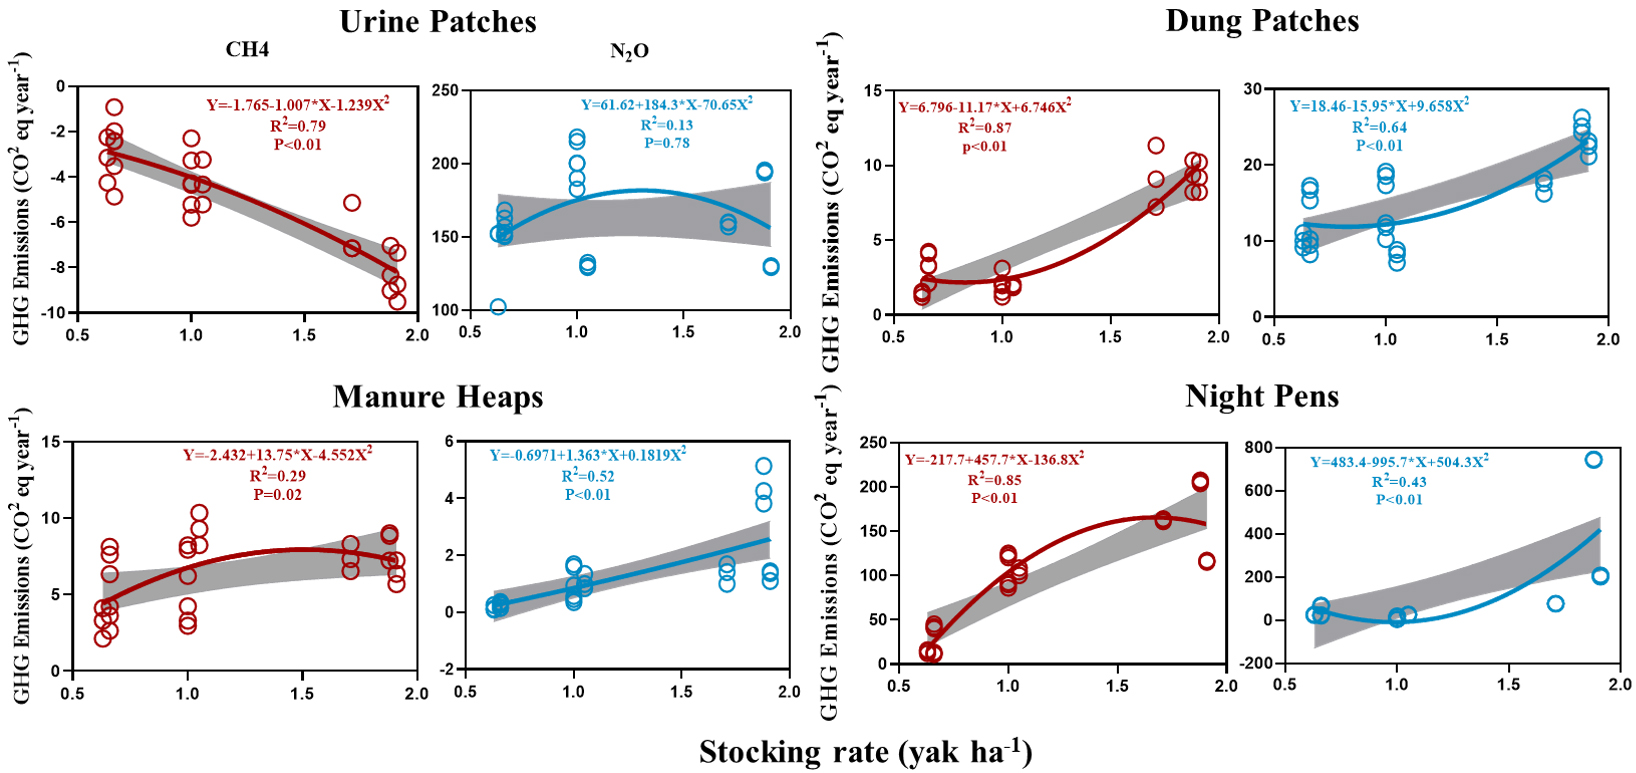
Figure 8. Relationship between greenhouse gas emissions and urine and manure management.
Toward climate-smart pastoralism: integrating ecological memory with technological innovation
Reconciling GHG mitigation (-1,720 kg CO2-eq ha-1 year-1 under exclusion) with pastoral livelihoods requires a three-pillar strategy blending traditional knowledge with cutting-edge science. Internet of Things-enabled (IoT-enabled) collars (Global positioning system (GPS) + accelerometers) optimize stocking density in real-time by tracking yak movement and pasture Normalized Difference Vegetation Index (NDVI). Trials in Maqu County reduced CH4/kg meat by 18% while increasing ANPP by 22% through adaptive grazing windows[43]. Blockchain-based pasture leases could incentivize carbon farming, with herders earning credits for maintaining SOC stocks > 3.5%[44]. Pyrolyzing yak dung at 450 °C produces biochar with
CONCLUSIONS
Our study demonstrates that the greenhouse gas (GHG) balance of the Qinghai-Tibetan Plateau (QTP) alpine meadow ecosystems is fundamentally governed by CO2 dynamics linked to carbon sequestration, irrespective of grazing status. Through a life cycle assessment of yak pastoralism across varying grazing intensities, we identified a critical threshold: ungrazed meadows act as significant carbon sinks, whereas the introduction of yaks converts these ecosystems into net GHG sources. This source strength escalates with increasing stocking rates, a trend mirrored by a corresponding rise in GHG intensity per unit of live weight gain. Within the grazed systems, enteric fermentation and manure management emerge as the second and third most significant contributors to the total GHG emissions, respectively. Consequently, effective mitigation strategies for yak grazing systems must prioritize the reduction of emissions from these two key processes. Given the unique geographical and biophysical context of the QTP, substituting dry manure consumption with renewable energy sources such as solar and wind presents a viable pathway to curb emissions from manure management. Furthermore, the implementation of adaptive management practices, such as appropriately fenced grazing, can enhance the soil’s carbon sequestration capacity. This not only promotes the removal of atmospheric CO2 but also offers a crucial mechanism for mitigating the overall GHG footprint of the QTP’s alpine grazing ecosystems.
DECLARATIONS
Authors’ contributions
Methodology, investigation, formal analysis, writing - original draft: Zhang, J.
Methodology, investigation, writing - review & editing, Conceptualization: Cheng, P.; Liu, Y.
Conceptualization, writing - review & editing, project administration, supervision, funding acquisition: Hou, F.; Chang, S.
Data collection and manuscript revision: Yan, C.; Sun, Y.; Zhang, Y.; Wang, Z. F.
Availability of data and materials
The data are available from the corresponding authors upon reasonable request.
Financial support and sponsorship
This study was funded by the National Key Research and Development Program of China, Grant/Award Number: 2021YFD1300504; the National Natural Science Foundation of China, Grant/Award Number: U21A20242; Gansu Province Science and Technology Plan Project, Grant/Award Number: 23JDKA0009; the Innovative Research Team in University, Grant/Award Number: IRT_17R50; ‘Lanzhou City’s Scientific Research Funding Subsidy to Lanzhou University, Grant/Award Number: GSRCZC2021001.
Conflicts of interest
All authors declared that there are no conflicts of interest.
Ethical approval and consent to participate
Not applicable.
Consent for publication
Not applicable.
Copyright
© The Author(s) 2025.
REFERENCES
1. He, D.; Deng, X.; Wang, X.; Zhang, F. Livestock greenhouse gas emission and mitigation potential in China. J. Environ. Manag. 2023, 348, 119494.
2. Wei, C.; Li, J.; Xu, W.; Sha, Y.; Qu, Y. Temporal and spatial dynamics of carbon emissions in animal husbandry and their influencing factors: a case study of three provinces in Northeast China. J. Clean. Prod. 2025, 508, 145418.
3. Li, L.; Awada, T.; Shi, Y.; Jin, V. L.; Kaiser, M. Global greenhouse gas emissions from agriculture: pathways to sustainable reductions. Glob. Chang. Biol. 2025, 31, e70015.
4. He, D.; Deng, X.; Gao, Y.; Wang, X. How does digitalization affect carbon emissions in animal husbandry? A new evidence from China. Resour. Conserv. Recy. 2025, 214, 108040.
5. Soussana, J.; Allard, V.; Pilegaard, K.; et al. Full accounting of the greenhouse gas (CO2, N2O, CH4) budget of nine European grassland sites. Agr. Ecosyst. Environ. 2007, 121, 121-34.
6. Wan, L.; Liu, G.; Su, X. Global meta-analysis reveals different grazing management strategies change greenhouse gas emissions and global warming potential in grasslands. Geogr. Sustain. 2025, 6, 100251.
7. Imer, D.; Merbold, L.; Eugster, W.; Buchmann, N. Temporal and spatial variations of soil CO2, CH4 and N2O fluxes at three differently managed grasslands. Biogeosciences 2013, 10, 5931-45.
8. You, C.; Wang, Y.; Tan, X.; et al. Inner Mongolia grasslands act as a weak regional carbon sink: a new estimation based on upscaling eddy covariance observations. Agr. Forest. Meteorol. 2023, 342, 109719.
9. Dong, S. Revitalizing the grassland on the Qinghai-Tibetan Plateau. Grassland. Res. 2023, 2, 241-50.
10. Wang, L.; Yan, L.; Zhang, J.; Lu, F.; Ouyang, Z. Spatiotemporal patterns and alleviating of grassland overgrazing under current and future conditions in Qinghai-Tibet Plateau. J. Environ. Manag. 2025, 376, 124456.
11. Li, S.; Li, Y.; Wang, W.; et al. Dietary habits of pastoralists on the Tibetan plateau are influenced by remoteness and economic status. Food. Res. Int. 2023, 174, 113627.
12. Wang, T.; Ji, X.; Wei, J.; et al. The Tibetan Plateau acts as a net greenhouse gas sink. Sci. Bull. 2025, 70, 2147-56.
13. Li, W.; Liu, Y.; Lin, Q.; et al. Identification of ecological security pattern in the Qinghai-Tibet Plateau. Ecol. Indic. 2025, 170, 113057.
14. Dong, S.; Xu, Y.; Li, S.; Shen, H.; Yang, M.; Xiao, J. Restoration actions associated with payment for ecosystem services promote the economic returns of alpine grasslands in China. J. Clean. Prod. 2024, 458, 142439.
15. Chen, H.; Ju, P.; Zhu, Q.; et al. Carbon and nitrogen cycling on the Qinghai-Tibetan Plateau. Nat. Rev. Earth. Environ. 2022, 3, 701-16.
16. Wang, Y.; Lv, W.; Xue, K.; et al. Grassland changes and adaptive management on the Qinghai-Tibetan Plateau. Nat. Rev. Earth. Environ. 2022, 3, 668-83.
17. Xu, X.; Zhao, Q.; Guo, J.; et al. Inequality in agricultural greenhouse gas emissions intensity has risen in rural China from 1993 to 2020. Nat. Food. 2024, 5, 916-28.
18. Mayer, R.; Erschbamer, B. Long-term effects of grazing on subalpine and alpine grasslands in the Central Alps, Austria. Basic. Appl. Ecol. 2017, 24, 9-18.
19. Wilson, K. M.; McCool, W. C.; Brewer, S. C.; et al. Climate and demography drive 7000 years of dietary change in the Central Andes. Sci. Rep. 2022, 12, 2026.
20. Bai, Y.; Guo, C.; Li, S.; et al. Instability of decoupling livestock greenhouse gas emissions from economic growth in livestock products in the Tibetan highland. J. Environ. Manag. 2021, 287, 112334.
21. Cai, Y.; Wang, X.; Tian, L.; Zhao, H.; Lu, X.; Yan, Y. The impact of excretal returns from yak and Tibetan sheep dung on nitrous oxide emissions in an alpine steppe on the Qinghai-Tibetan Plateau. Soil. Biol. Biochem. 2014, 76, 90-9.
22. Liu, Y.; Yan, C.; Matthew, C.; Wood, B.; Hou, F. Key sources and seasonal dynamics of greenhouse gas fluxes from yak grazing systems on the Qinghai-Tibetan Plateau. Sci. Rep. 2017, 7, 40857.
23. Sun, Y.; Angerer, J. P.; Hou, F. J. Effects of grazing systems on herbage mass and liveweight gain of Tibetan sheep in Eastern Qinghai-Tibetan Plateau, China. Rangeland. J. 2015, 37, 181-90.
24. Yang, C.; Zhang, Y.; Hou, F.; Millner, J. P.; Wang, Z.; Chang, S. Grazing activity increases decomposition of yak dung and litter in an alpine meadow on the Qinghai-Tibet plateau. Plant. Soil. 2019, 444, 239-50.
25. ISO 14040:2006. Environmental management - Life cycle assessment - Principles and framework. Available from: https://www.iso.org/standard/37456.html#lifecycle [Last accessed on 25 Nov 2025].
26. Ding, X.; Long, R.; Kreuzer, M.; Mi, J.; Yang, B. Methane emissions from yak (Bos grunniens) steers grazing or kept indoors and fed diets with varying forage:concentrate ratio during the cold season on the Qinghai-Tibetan Plateau. Anim. Feed. Sci. Technol. 2010, 162, 91-8.
27. Eggleston, H.; Buendia, L.; Miwa, K.; et al. 2006 IPCC guidelines for national greenhouse gas inventories. Available from: https://www.ipcc-nggip.iges.or.jp/public/2006gl/ [Last accessed on 25 Nov 2025].
28. Schönbach, P.; Wolf, B.; Dickhöfer, U.; et al. Grazing effects on the greenhouse gas balance of a temperate steppe ecosystem. Nutr. Cycl. Agroecosyst. 2012, 93, 357-71.
29. Xue, B.; Zhao, X.; Zhang, Y. Feed intake dynamic of grazing livestock in nature grassland in Qinghai-Tibetan Plateau (In Chinese). Ecol. Domest. Anim. 2004, 25, 21-5. Available from: https://kns.cnki.net/kcms2/article/abstract?v=LYi8dJWcB0US51TTv_C0U4AAqF2FuFOkoAXGRTl7404KJ1Qoy52Bdlh9WbwYV0z1p4flRkQcJ6l8iCRzTVKJ272OVCIy7ZXRiBkgy1Gkt07Mv5FB8Mpm73JKDQv6y5O9sSEcPvCqRKgX-H9g6QA0EDr-I0fkdDYXr5Q5MMUmnuoiSI673IL6IA==&uniplatform=NZKPT&language=CHS [Last accessed on 25 Nov 2025].
30. Lin, X.; Wang, S.; Ma, X.; et al. Fluxes of CO2, CH4, and N2O in an alpine meadow affected by yak excreta on the Qinghai-Tibetan plateau during summer grazing periods. Soil. Biol. Biochem. 2009, 41, 718-25.
31. Wang, S.; Li, Y. The influence of diffeent stocking rates and grazing periods on the amount of feces and its relationship to DM intake and digestibility of grazing sheep. Acta. Zoonutrimenta. Sin. 1997, 9, 47-54. Available from: https://kns.cnki.net/kcms2/article/abstract?v=LYi8dJWcB0UPd7L8kJKrdcsbssXk5pZr-ZHMMYqw4yxP6J-ES5t3Bzolan81VvPQ33lADw3uLJ5D8ns2ZUhZnURSYBEOzbJzXP4zDWjI9ebDiKr4qN1wpwddgsXQCpgQoGzJvfcA_wINxul8XUCXmZmiBF01kSIxB7yJIUKOuvli-ls19ttOtg==&uniplatform=NZKPT&language=CHS [Last accessed on 27 Nov 2025].
32. Yan, L.; Wang, P. Contributions of ruminants and their excreta to N2O and CH4 emissions. CJE 2011, 30, 2604-12.
33. Artaxo, P.; Berntsen, T.; Betts, R.; et al. Changes in atmospheric constituents and in radiative forcing. 2007. Available from: https://www.ipcc.ch/site/assets/uploads/2018/02/ar4-wg1-chapter2-1.pdf [Last accessed on 25 Nov 2025].
34. Yelery, A. The national development reform commission’s report at the 4th session of 12th national people’s congress: a review. Sage. J. 2016, 52, 228-34.
35. Piñeiro, G.; Paruelo, J. M.; Oesterheld, M.; Jobbágy, E. G. Pathways of grazing effects on soil organic carbon and nitrogen. Rangeland. Ecol. Manag. 2010, 63, 109-19.
36. Cui, X.; Wang, Z.; Yan, T.; Chang, S.; Hou, F. Modulation of feed digestibility, nitrogen metabolism, energy utilisation and serum biochemical indices by dietary Ligularia virgaurea supplementation in Tibetan sheep. Animal 2023, 17, 100910.
37. Reay, M. K.; Marsden, K. A.; Powell, S.; et al. The soil microbial community and plant biomass differentially contribute to the retention and recycling of urinary-N in grasslands. Soil. Biol. Biochem. 2023, 180, 109011.
38. Zhou, X.; Wang, Y.; Huang, X.; Tian, J.; Hao, Y. Effect of grazing intensities on the activity and community structure of methane-oxidizing bacteria of grassland soil in Inner Mongolia. Nutr. Cycl. Agroecosyst. 2008, 80, 145-52.
39. Ren, S.; Wang, T.; Ji, X.; et al. Grazing reverses climate-induced soil carbon gains on the Tibetan Plateau. Nat. Commun. 2025, 16, 6978.
40. Kato, T.; Hirota, M.; Tang, Y.; et al. Strong temperature dependence and no moss photosynthesis in winter CO2 flux for a Kobresia meadow on the Qinghai-Tibetan plateau. Soil. Biol. Biochem. 2005, 37, 1966-9.
41. Cai, Y.; Wang, X.; Ding, W.; Tian, L.; Zhao, H.; Lu, X. Potential short-term effects of yak and Tibetan sheep dung on greenhouse gas emissions in two alpine grassland soils under laboratory conditions. Biol. Fertil. Soils. 2013, 49, 1215-26.
42. Wang, X.; Luo, X.; Zhang, Y.; Kang, S.; Chen, P.; Niu, H. Black carbon: a general review of its sources, analytical methods, and environmental effects in snow and ice in the Tibetan Plateau. Environ. Sci. Pollut. Res. Int. 2024, 31, 3413-24.
43. Cao, G.; Tang, Y.; Mo, W.; Wang, Y.; Li, Y.; Zhao, X. Grazing intensity alters soil respiration in an alpine meadow on the Tibetan plateau. Soil. Biol. Biochem. 2004, 36, 237-43.
44. Nyamuryekung’e, S. Transforming ranching: precision livestock management in the internet of things era. Rangelands 2024, 46, 13-22.
45. Arango, J.; Rubio, N. M.; Costa, C. Jr.; et al. Scaling up Hacienda San Jose sustainable ranch model and securing private sector finance. Montpellier: CGIAR System Organization. 2024. Available from: https://www.sidalc.net/search/Record/dig-cgspace-10568-173196/Description [Last accessed on 25 Nov 2025].
46. Gill, M.; Smith, P.; Wilkinson, J. M. Mitigating climate change: the role of domestic livestock. Animal 2010, 4, 323-33.
47. Dayoub, M.; Shnaigat, S.; Tarawneh, R.; Al-Yacoub, A.; Al-Barakeh, F.; Al-Najjar, K. Enhancing animal production through smart agriculture: possibilities, hurdles, resolutions, and advantages. Ruminants 2024, 4, 22-46.
Cite This Article
How to Cite
Download Citation
Export Citation File:
Type of Import
Tips on Downloading Citation
Citation Manager File Format
Type of Import
Direct Import: When the Direct Import option is selected (the default state), a dialogue box will give you the option to Save or Open the downloaded citation data. Choosing Open will either launch your citation manager or give you a choice of applications with which to use the metadata. The Save option saves the file locally for later use.
Indirect Import: When the Indirect Import option is selected, the metadata is displayed and may be copied and pasted as needed.
About This Article
Special Topic
Copyright

Data & Comments
Data
0


Comments
Comments must be written in English. Spam, offensive content, impersonation, and private information will not be permitted. If any comment is reported and identified as inappropriate content by OAE staff, the comment will be removed without notice. If you have any queries or need any help, please contact us at [email protected].