


fig2
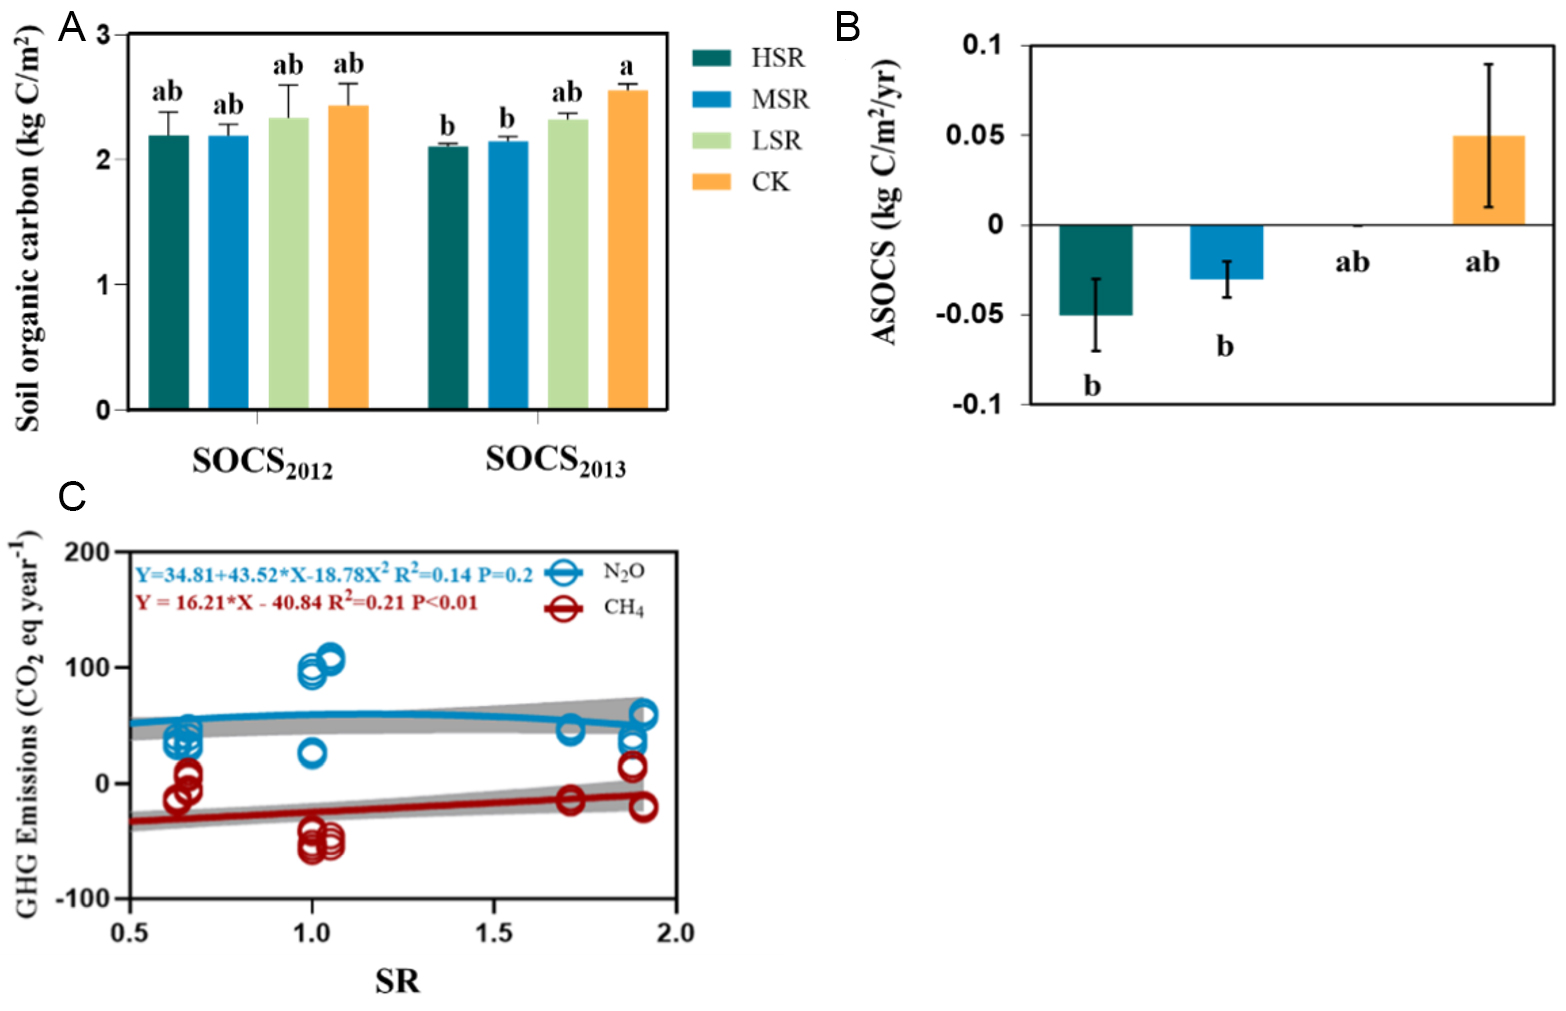
Figure 2. An investigation of surface soil (0-5 cm) organic carbon stocks, annual carbon sequestration rates, and the correlation between greenhouse gas emissions and livestock stocking rates. Mean ± SD (n = 3); (A) Soil organic carbon stocks (SOCS) content; (B) ASOCS, annual sequestration of soil organic carbon stocks; HSR: High stocking rate; MSR: moderate stocking rate; LSR: low stocking rate; Fenced: no grazing. Positive values indicate carbon sequestration and negative values indicate carbon release; (C) greenhouse gases (GHG) change with the stocking rate increase. In analyses of significant differences, different letters (such as a, b) are used to denote the level of significance for differences between groups. Identical letters indicate no significant difference (P > 0.05), while different letters indicate a significant difference (P < 0.05).


