

Minimizing inequality between methane emissions and economic variations in the Belt and Road countries
 0
0 Abstract
The steady increase in global methane (CH4) emissions has recently drawn international attention. However, CH4 emissions in countries along the Belt and Road (B&R) remain underexamined. This study applies a multi-regional input-output analysis to quantify production-based emissions (PBEs) and consumption-based emissions (CBEs) across 138 countries and economies within the B&R region. It further employs the Lorenz curve and Gini coefficient to assess inequality in CH4 emissions across income groups in these countries and examines the degree of decoupling between PBEs/CBEs and economic growth. CH4 emissions from B&R countries contributed significantly to the global total, with major contributions from energy- and resource-intensive sectors such as agriculture, petroleum, chemical and non-metallic mineral products, construction, financial intermediation, and commercial activities. Across the region, CBEs were consistently lower than PBEs but showed a stronger upward trend. Significant inequality in CH4 emissions was observed, particularly in PBEs within high-income (H-H) countries and CBEs within low-income (L-L) countries. Over time, the gap between PBEs and CBEs in H-H countries narrowed, suggesting positive changes in economic structure or consumption patterns. By analyzing the spatial and temporal evolution of CH4 emissions, this study provides insights and policy recommendations for reducing CH4 emission inequality and developing effective mitigation strategies within the B&R region.
Keywords
INTRODUCTION
Methane (CH4), the second most significant greenhouse gas (GHG), accounts for approximately one-fifth of global GHG emissions. It is much more active in the atmosphere than carbon dioxide (CO2), with a global warming potential over a 20-year period that is more than 80 times greater than that of CO2[1-3]. Given the pressing challenges of global climate change, mitigating CH4 emissions holds paramount significance[4-7]. The Belt and Road (B&R) Initiative - one of the largest and most geographically extensive international development strategies - faces extensive use of fossil fuels and ruminant livestock, coupled with limited mitigation measures, making CH4 emissions in this region a major concern.
Proposed by China in 2013 and inspired by the ancient Silk Road, the B&R Initiative encompasses 62.36% of the world’s population and accounts for 31.14% of global GDP[8,9]. Most B&R countries are developing economies experiencing rapid urbanization, industrialization, and international trade growth, all of which may contribute to rising global GHG emissions[10-12]. In Central Asian B&R countries such as Kazakhstan, coal represents more than 50% of primary energy consumption. Extensive underground coal mining in these areas often releases substantial amounts of CH4 emissions through coal mine gas venting. Similarly, ruminant livestock farming, particularly cattle and buffalo rearing in countries such as India and Pakistan, constitutes another major source of CH4 emissions. Moreover, many countries are especially vulnerable to the impacts of climate change[13,14]. As the second most important greenhouse gas, CH4 has the advantage of rapid atmospheric response, meaning that spatiotemporal analysis of CH4 emissions can provide valuable guidance for designing effective mitigation policies. However, studies focusing on CH4 emissions in the B&R region, especially those examining emission inequality and the drivers of CH4 growth, remain scarce.
Previous research has largely concentrated on the evolution of GHG emissions[7,15], particularly in the B&R countries[16-18]. Studies also examined electricity development and its carbon impact[19,20], drivers of total carbon emission changes[21], and carbon peaking trends[22]. With abundant energy resources[23,24], the B&R region plays an increasingly influential role in shaping the global economy, trade flows, emission patterns, and climate trends[25,26]. While considerable attention has been paid to CO2 emissions, understanding the trends and characteristics of CH4 emissions in the B&R region is both necessary and urgent.
Multi-regional input-output (MRIO) models have been widely applied to quantify resource and environmental footprints, including energy[27,28], air pollution[29], water[30], ecological impacts[31], renewable energy[32], and GHG emissions[25]. Most studies have emphasized carbon emissions, focusing on topics such as the pollution haven hypothesis[33], the B&R’s effect on global and Chinese CO2 emissions[34], mutual carbon emissions and spillover effects between China and B&R countries[35], embodied carbon transfer flows[36-38], emission inequality[39,40], and the exchanges between embodied economic benefits and CO2 emissions[41]. For example, Fang et al. applied MRIO analysis to assess water, land, carbon, nitrogen, and phosphorus footprints, finding that the B&R region was a net exporter of trade-embodied flows, except for virtual water[31]. Lu et al. showed that from 1995 to 2015, the B&R region contributed over 50% of the global carbon footprint[40]. Wang et al. examined India’s embodied carbon emissions in international trade and found that most of its exported CO2 emissions were destined for developed countries, while the majority of its imported emissions originated from developing countries[42]. Hou et al. analyzed CH4 emissions embodied in B&R trade between 2004 and 2011[25].
In recent years, inequality in CO2 emissions has been widely studied using methods such as the Lorenz curve, Theil index, coefficient of variation, and Gini coefficient[43-46]. However, little attention has been given to inequality in CH4 emissions. Tapio[47] first proposed the decoupling theory to evaluate the relationship between emissions and economic growth in the European transport sector. Since then, Tapio's framework has been widely applied to examine the decoupling of CO2 emissions and economic development in OECD countries[48], BRICS countries[49], and B&R countries[50-52]. Building on this, the logarithmic mean Divisia index (LMDI) method is often used to identify the key drivers and barriers of emission trends[53,54] and has been broadly applied in energy and environmental research[55].
Although extensive studies have investigated the carbon footprints, environmental emissions, and water scarcity of the B&R region, the issue of CH4 emissions remains underexplored. To address this gap, this study makes the following contributions: (i) it examines the evolution of production-based emissions (PBEs) and consumption-based emissions (CBEs) in the B&R countries using MRIO modeling; (ii) it compares inequality in CH4 emissions across income groups and regions using the Lorenz curve and Gini coefficient; and (iii) it investigates the evolution and drivers of decoupling between CH4 emissions and economic growth, offering practical insights for reducing CH4 inequality and developing mitigation strategies in the B&R region.
METHODS AND DATA SOURCES
The methodology employed in this study is comprehensively illustrated in Figure 1, with a specific focus on the B&R countries. First, the global multi-regional input-output model is used to assess the total CH4 emission flows generated by each B&R country. This model enables a detailed examination of CH4 emissions from both production and consumption perspectives, providing a comprehensive understanding of emission sources and transfers within the B&R context. Next, the Lorenz curve and Gini coefficient are applied to measure spatial inequality in CH4 emissions across the B&R countries. These tools provide both visual and quantitative insights into disparities in emission levels, highlighting regions with disproportionately high or low emissions within this international cooperation framework. Finally, a decoupling decomposition analysis is conducted to delve into the driving forces behind CH4 emissions in the B&R countries.
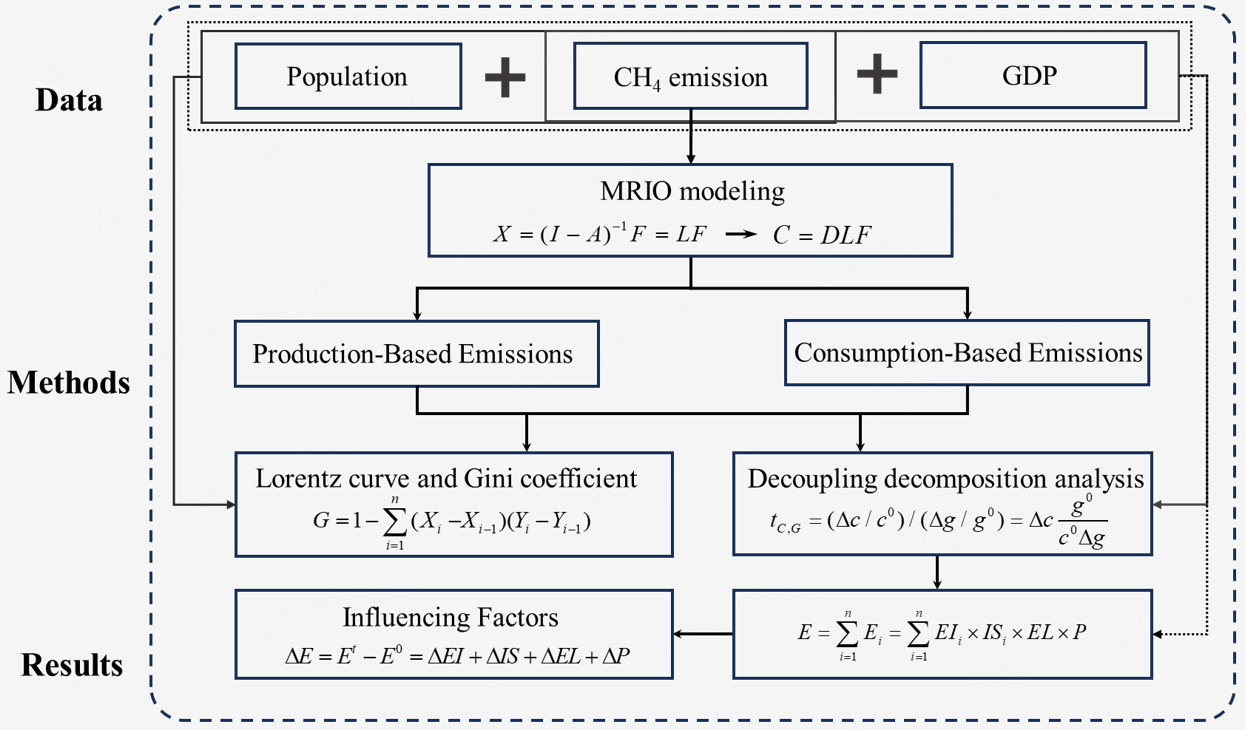
Figure 1. Flow diagram of the methane emissions accounting framework.
Multi-regional input-output modeling
Input-output analysis, originally proposed by Leontief[56], provides a framework for describing commodity supply chains from both production and consumption perspectives. The balance of the MRIO model can be expressed in matrix form as:
where X denotes the total output, matrix A represents the technical coefficients that describe the interdependencies among economic sectors, and matrix F denotes final demand.
According to the MRIO framework, Eq. (2) can be expressed as:
where L = (I - A)-1 represents the Leontief inverse matrix, which reflects the total economic inputs to satisfy one unit of final demand in monetary terms.
The Leontief inverse matrix can also be used to link direct GHG emissions with final demand categories, as expressed in Eq. (3):
where Cst represents the emissions of region s embodied in the final consumption of region t, corresponding to the embodied emission export from region s to region t, and ds denotes the direct emission intensity, defined as the emissions generated per unit of output in region s. Based on this emission intensity matrix, PBEs are defined as the direct CH4 emissions occurring within a nation’s geographical boundaries, while CBEs are defined as the CH4 emissions embodied in the final demand of the economy.
The emissions embodied in imports (EEI) and exports (EEE) of region t can be expressed as Eqs. (4) and (5):
where EEIt represents the emissions embodied in imports to region t from other regions, and EEEt represents the emissions embodied in exports from region t to other regions. The trade balance of embodied emissions is obtained by calculating the difference between EEIt and EEEt.
Lorenz curve and Gini coefficient
The Lorenz curve, a standard analytical tool, is frequently employed to analyze income or wealth disparities. Extending this principle, it can also be harnessed to measure inequality in CH4 emissions. The Lorenz curve of CH4 emissions is a graphical representation where the x-axis shows the cumulative proportion of the sampled population, arranged in ascending order by per capita CH4 emissions, while the y-axis represents the cumulative percentage of total CH4 emissions per capita. In an ideal scenario, where every individual contributes equally to CH4 emissions, the Lorenz curve coincides with the diagonal line, representing absolute equality. In the presence of inequality, however, the curve lies below this line. The degree of deviation from the diagonal serves as a quantitative indicator: the greater the deviation, the larger the disparity in CH4 emissions.
The Gini coefficient, traditionally used to measure differences in income distribution, can similarly be employed to quantify inequality in CH4 emissions across countries with different income groups. It reflects the relationship between cumulative population shares and cumulative CH4 emissions. The Gini coefficient ranges from 0 to 1, where 0 indicates perfect equality and 1 represents complete inequality. It is calculated as follows:
where Xi denotes the cumulative percentage of the population in region i, and Yi represents the cumulative percentage of CH4 emissions (production/consumption) in region i. When i = 1, Xi-1 and Yi-1 are zero, marking the beginning of the cumulative process. Generally, a Gini coefficient below 0.2 indicates a high level of equality, values between 0.2 and 0.3 suggest relative equality, and values from 0.3 to 0.4 are considered acceptable. By contrast, values between 0.4 and 0.5 point to moderate inequality, while values above 0.5 indicate severe inequality.
Decoupling decomposition analysis
To clarify the correlation between economic development and CH4 emissions, the Tapio decoupling model was applied to measure the decoupling effect between GDP growth and CH4 emissions in the B&R countries[39]. The Tapio decoupling index is defined as Eq. (7):
where tC,G represents the decoupling index between CH4 emissions and GDP, Δc and Δg denote the growth rates of CH4 emissions and GDP, respectively, and c0 and g0 represent the baseline values of CH4 emissions and GDP, respectively. Different decoupling states are classified according to the value of the decoupling index.
The LMDI decomposition method was then used to identify the main factors influencing CH4 emissions, while the Kaya identity was employed to decompose these drivers[57]. Since CH4 emissions are distributed across different industrial sectors, PBEs and CBEs were further divided into four primary industries: agriculture, industry, construction, and services. To identify the main drivers of CH4 emissions, including emission intensity, industrial structure, economic level, and population size, the decoupling decomposition for each country is expressed in Eq. (8):
where i denotes the industrial structure, Ei denotes CH4 emissions from industry i (MtCO2-eq), GDPi is the value added of industry i (in billion USD), Y denotes the GDP (in billion USD), and P is the total population (in billions). ΔE can be expressed by Eq. (9), while ΔEI, ΔIS, ΔEL, and ΔP are calculated using
where EIt, EI0, ISt, IS0, ELt, EL0, Pt, and P0 represent CH4 emission intensity, industrial structure share, GDP per capita, and population size for year t and the base year 0, respectively.
Data sources
To compile the direct CH4 emission inventory, official GHG emission data were obtained from the United Nations Framework Convention on Climate Change (UNFCCC) database[58]. Additional annual CH4 emission data were sourced from the Emissions Database for Global Atmospheric Research 6.0[59]. Together, these datasets cover the period from 2005 to 2021. For the analysis, we focused on data points at eight-year intervals to capture long-term trends and changes in CH4 emissions, while also utilizing the full dataset where necessary to provide more comprehensive insights. The MRIO tables from the Eora database were employed, encompassing 189 individual economies and a 26-sector harmonized classification system[60,61]. Population and GDP data (in constant 2015 US$) were obtained from the World Bank[9]. The list of countries and regions participating in the B&R Initiative was compiled according to the National Development and Reform Commission[62]. In total, 138 countries and economies along the Belt and Road were selected as the research area and grouped into 12 regions. Countries and regions were further categorized into four income groups based on World Bank criteria, making it possible to identify gaps and transitions across income levels. Detailed names and abbreviations of the 138 countries, regional classifications, and sectoral classifications are provided in Supplementary Tables 1 and 2.
RESULTS
Spatiotemporal characteristics
Figure 2 shows the PBEs and CBEs of B&R countries between 2005 and 2021. Globally, total CH4 emissions increased from 6,839.68 to 8,114.75 MtCO2-eq, representing an 18.64% increase. During the same period, PBEs in the B&R region grew from 4,434.76 to 5,654.25 MtCO2-eq, with the region’s global share rising from 64.84% to 69.68%. By comparison, CBEs increased more substantially, from 4,036.16 to 5,412.46 MtCO2-eq, with the global share rising from 58.82% to 66.54%. Notably, CBEs in the B&R region grew at a faster rate, although they consistently remained lower than PBEs.
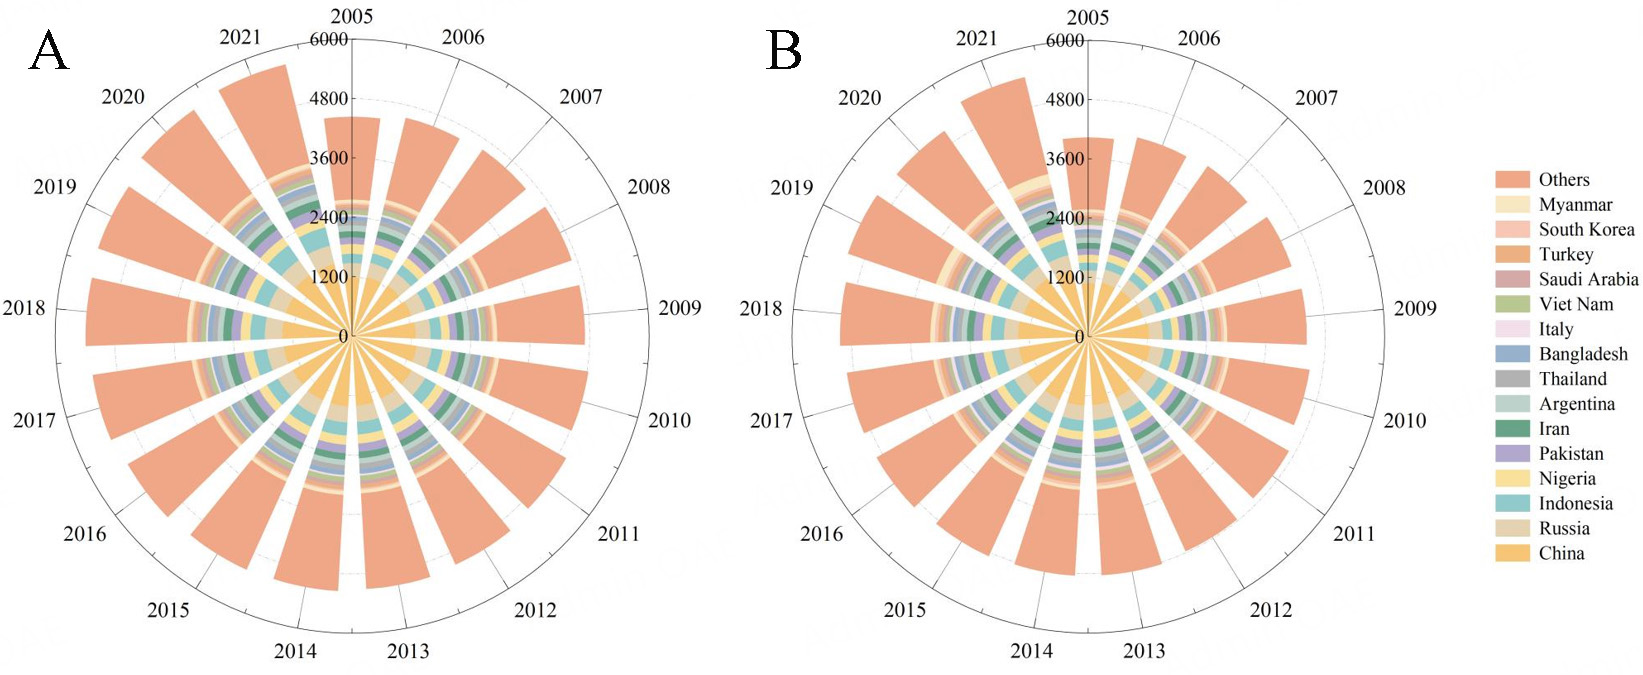
Figure 2. CH4 emissions of the B&R countries (Unit: MtCO2-eq), (A) PBEs; (B) CBEs.
The sectoral structures of PBEs and CBEs are shown in Figure 3. For PBEs, the CH4-intensive sectors included Agriculture (S1), Petroleum, Chemical and Non-Metallic Mineral Products (S7), Construction (S14), and Financial Intermediation and Business Activities (S21), together accounting for 35.57% and 35.75% of total emissions in 2005 and 2021, respectively. At the country level, Pakistan, Bangladesh, Thailand, the Philippines, Turkey, and Vietnam were dominated by agriculture-related CH4 emissions, while energy-related CH4 emissions were predominant in Russia, Iran, Malaysia, and Ukraine. From the consumption-based perspective, the major emission sectors were Food and beverages (S4), Construction (S14), Financial Intermediation and Business Activities (S21), and Education, health, and other services (S23), which together contributed 45.49% and 44.64% of CBEs in 2005 and 2021, respectively. Among these, the share of Construction (S14) increased from 14.32% in 2005 to 15.85% in 2021.
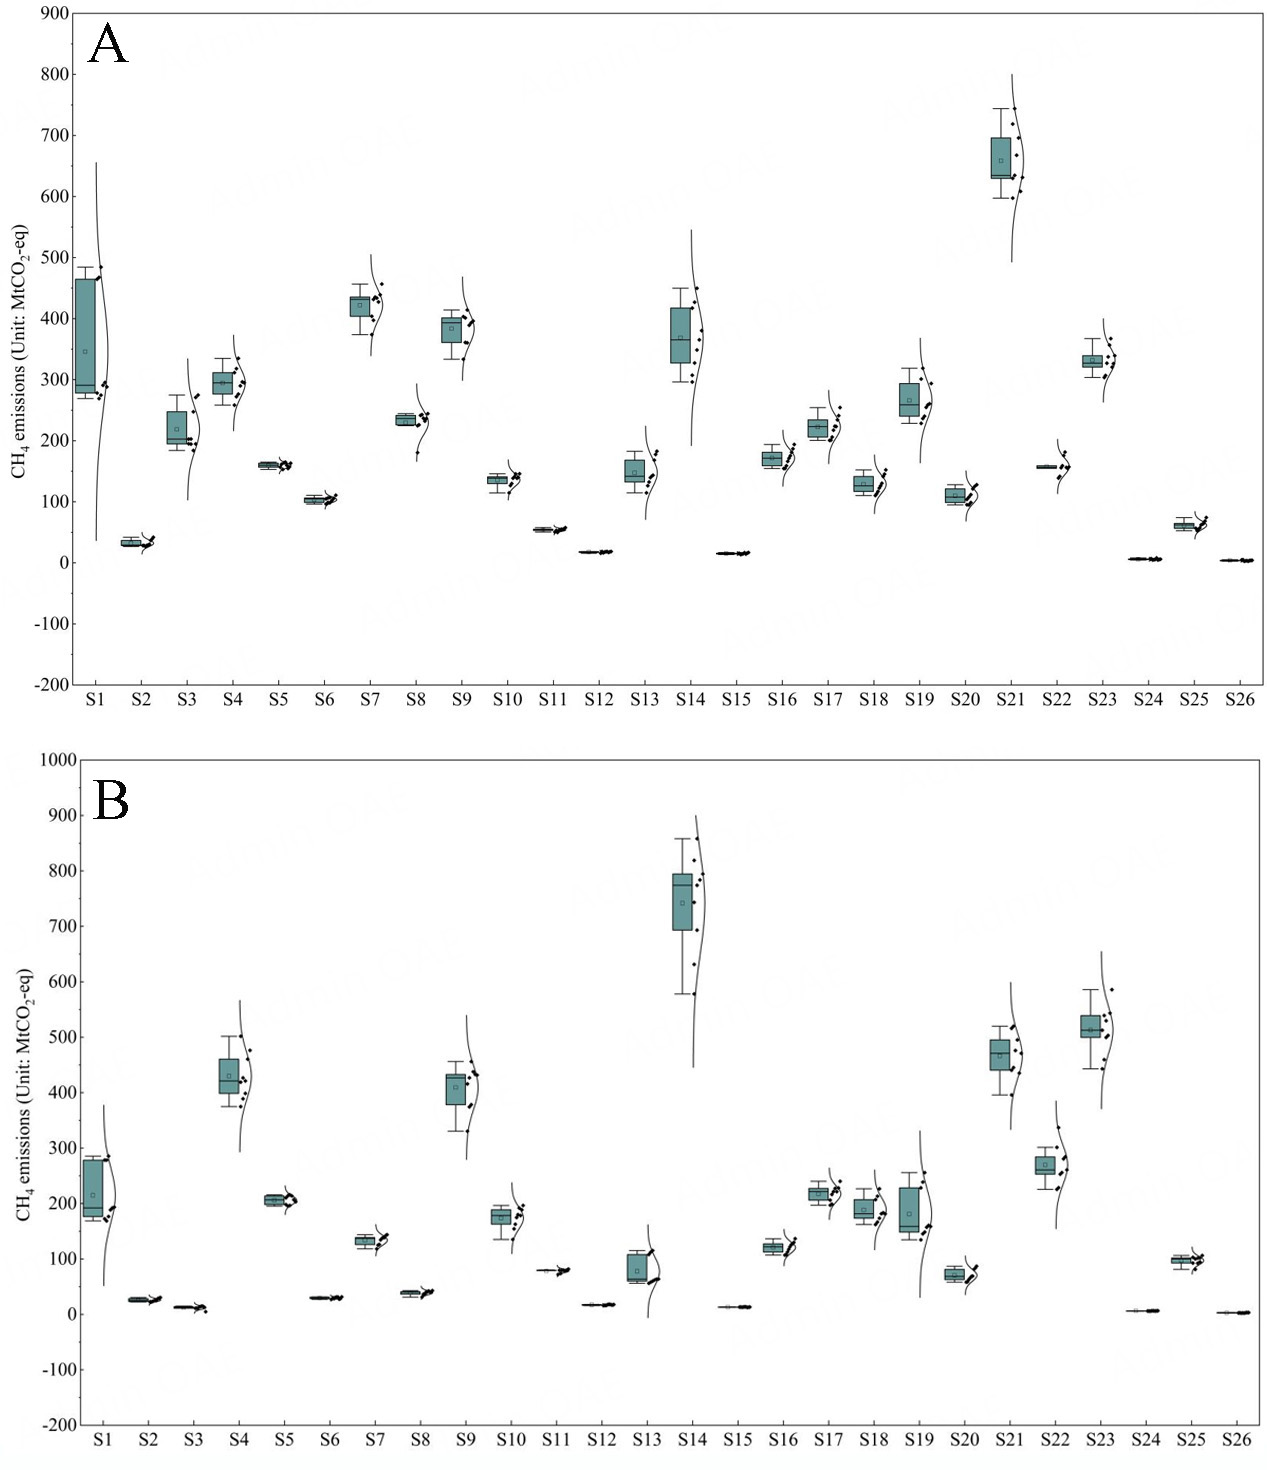
Figure 3. Statistical characteristics of CH4 emissions in the B&R countries. notes: The scatter box diagram displays six values and one curve: maximum, 75th percentile, mean, median, 25th percentile, minimum, and the normal distribution curve. (A) PBEs; (B) CBEs.
Income-divided inequalities
Figure 4 depicts the Lorenz curves of PBEs and CBEs. The global Gini coefficient for CH4 emissions, taken as a whole, was higher than that of the B&R countries collectively. From 2005 to 2021, the Gini index for PBEs in the B&R region showed a decreasing trend. Across income groups, H-H income countries exhibited the highest Gini index for PBEs, consistently ranging between 0.460 and 0.510, reflecting moderate to high inequality. In contrast, U-M income countries had the lowest Gini index, ranging from 0.150 to 0.200, indicating a high degree of equality. The L-M income countries had Gini indices between 0.210 and 0.250, corresponding to mild equality. Meanwhile, the Gini index of L-L income countries declined from 0.330 to 0.313, remaining within the mild-to-fair range of equality.
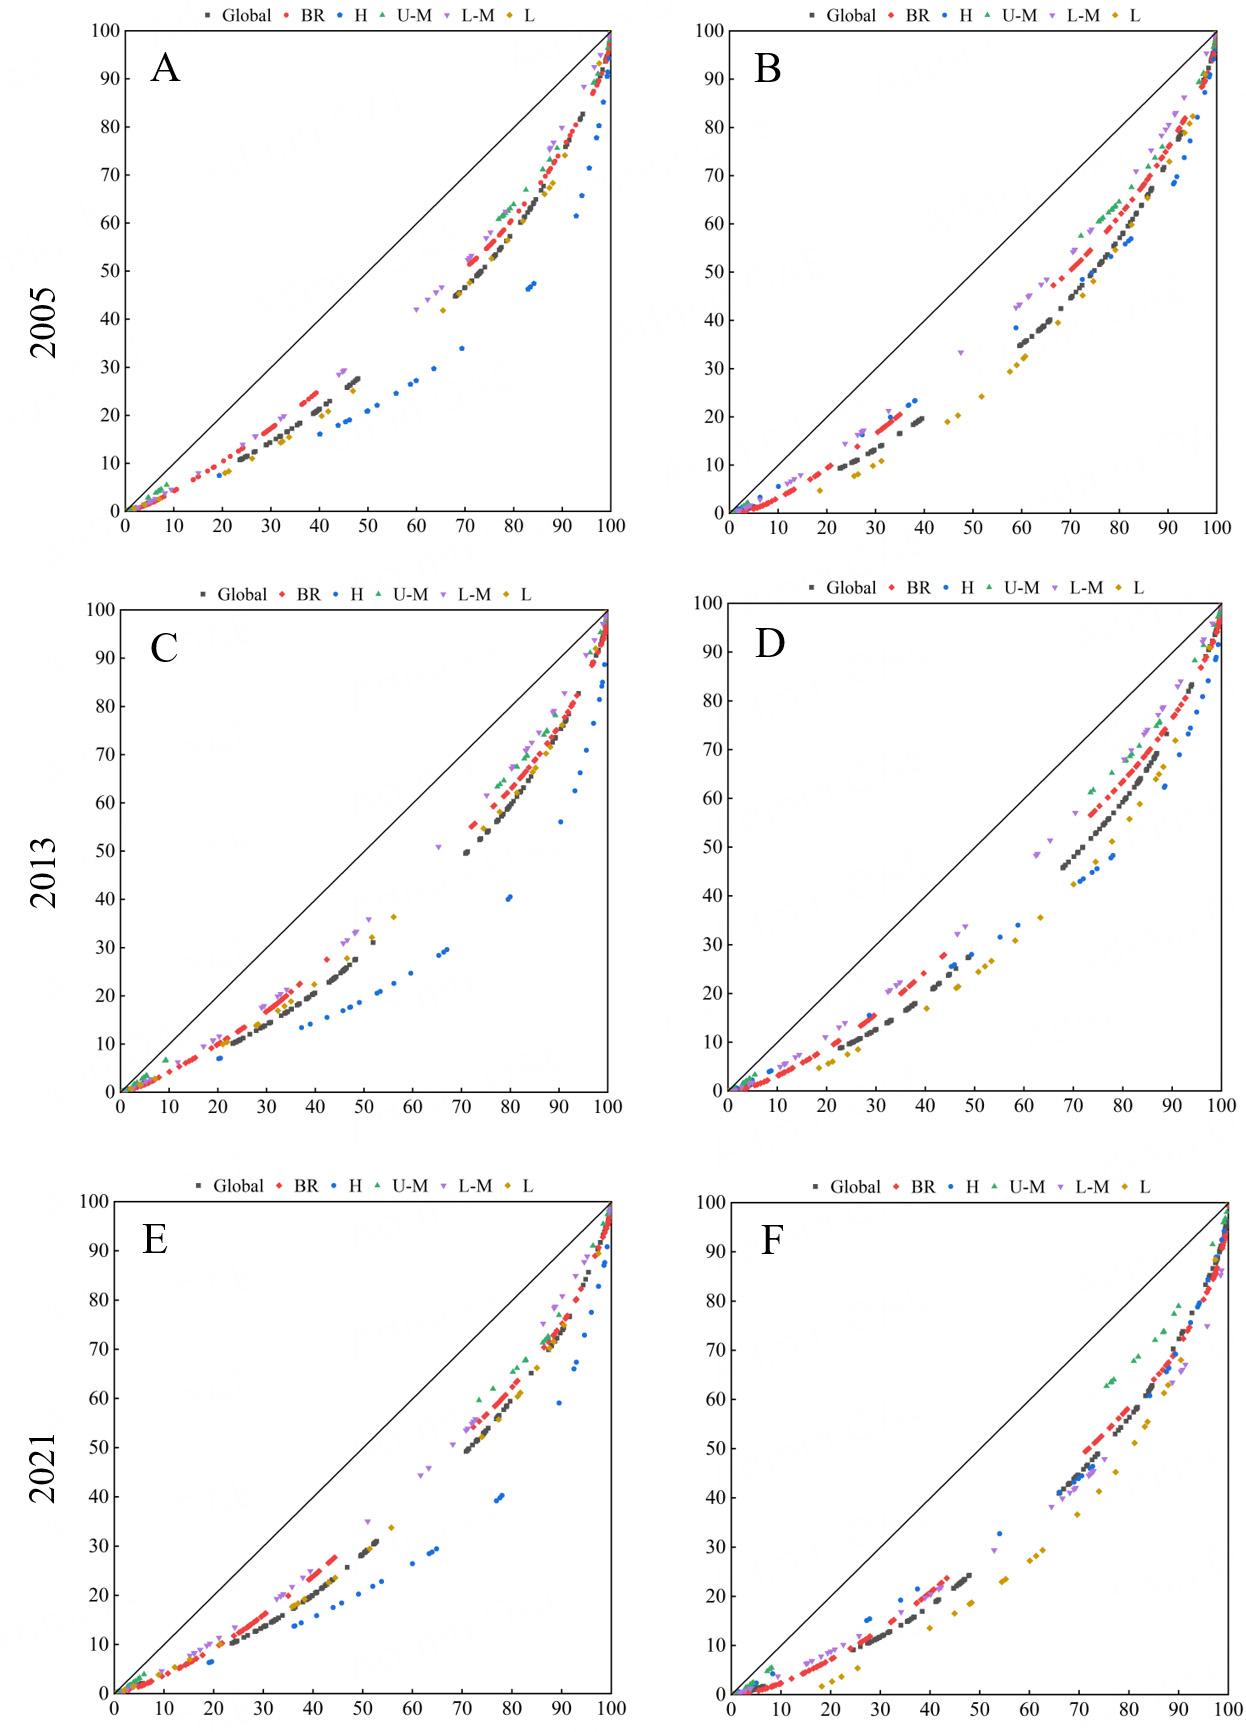
Figure 4. Lorenz curves of CH4 emissions in the B&R countries. (A) PBEs; (B) CBEs; (C) PBEs; (D) CBEs; (E) PBEs; (F) CBEs.
In comparison, the Gini index of CBEs in the B&R region showed an upward trend. It increased from 0.274 to 0.331, a growth rate of 20.52%, suggesting a rising level of inequality. By income group, the CBE Gini index of H-H income countries increased from 0.310 to 0.322, shifting from mild inequality toward relative balance compared with PBEs. For U-M income countries, the CBE Gini index remained similarly balanced as with PBEs. The Gini index of L-M income countries rose from 0.217 (mildly balanced) to 0.372 (relatively balanced), while that of L-L income countries increased from 0.388 (relatively balanced) to 0.455 (mild inequality), indicating worsening inequality in both groups.
Overall, inequality in CBEs was slightly lower than in PBEs for most income groups, except for L-L countries. The greatest inequality appeared in PBEs among H-H income countries, while L-L income countries had the highest inequality in CBEs. From both perspectives, U-M income countries consistently remained the most equal group, maintaining the lowest Gini indices. Notably, although H-H income countries initially showed substantial disparities, the gap diminished considerably over time.
Figure 5 presents CH4 emissions across income groups in the B&R region. The results reveal a positive correlation between CH4 emissions and economic development: countries with higher income levels generally had higher per capita CH4 emissions, whereas those with lower income levels had lower emissions. Globally, per capita CH4 emissions declined, whereas they rose in the B&R region. In particular, the per capita CBEs in the B&R region, initially lower than the global average, later surpassed it, while per capita PBEs consistently remained above the global average.
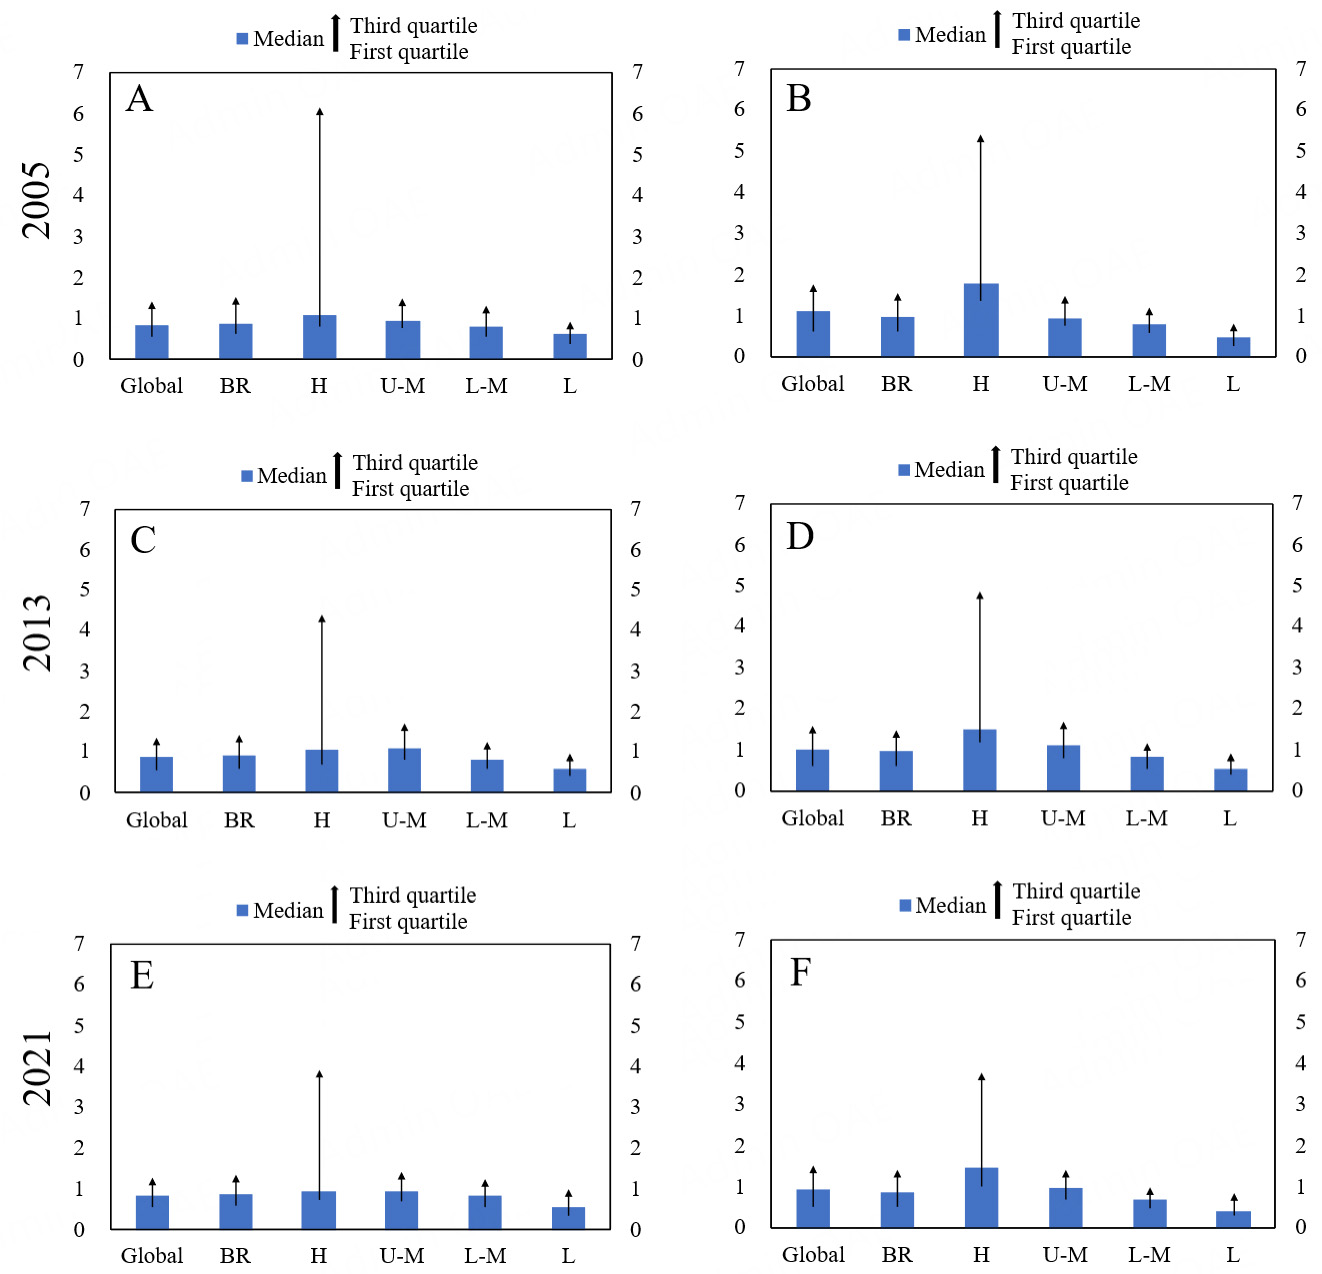
Figure 5. CH4 emissions across income groups in the B&R region (unit: tons per capita). (A) PBEs; (B) CBEs; (C) PBEs; (D) CBEs; (E) PBEs; (F) CBEs.
For PBEs, per capita emissions in H-H income countries decreased slightly from 1.70 to 1.63 tCO2-eq, at an annual reduction rate of 0.26%. In L-L income countries, PBEs fell from 0.73 to 0.69 tCO2-eq per capita, with a higher annual reduction rate of 0.32%. Conversely, PBEs in U-M and L-M income countries increased, rising from 1.12 to 1.28 tCO2-eq (3.08% annual growth) and from 0.98 to 0.99 tCO2-eq per capita (0.09% annual growth), respectively.
For CBEs, H-H income countries saw a decrease from 2.02 to 1.76 tCO2-eq per capita, with an annual reduction rate of 0.80%. U-M income countries experienced an increase from 1.02 to 1.16 tCO2-eq per capita (0.79% annual growth). L-M income countries’ CBEs grew more rapidly than PBEs, from 0.85 to
Overall, CH4 emissions per capita fluctuated over time in H-H and L-L income groups, while U-M and L-M groups showed opposite trends. Notably, per capita PBEs were higher than CBEs in all income groups except for H-H countries. H-H countries maintained relatively high per capita CBEs, reflecting a tendency to consume more than they produce, although this gap has been narrowing. From a production perspective, the gap between PBEs and CBEs fluctuated and widened in U-M countries, narrowed and then expanded in L-M and L-L income groups.
Decoupling status evolution
From a production perspective, the B&R region showed a weak decoupling (WD) state, meaning that the economic growth outpaced the growth rate of CH4 emissions. More than 70% of B&R countries exhibited strong decoupling (SD) or weak decoupling (WD), with SD accounting for 23.74% and WD for 53.24%.
Figure 6 shows the decoupling of economic growth from CH4 emissions across B&R countries. Overall, these countries maintained a WD state during both eight-year periods, suggesting that most regions achieved a certain level of decoupling between economic growth and CH4 emissions. Between 2005 and 2013, Oceania reached an SD state in both PBEs and CBEs, but shifted to WD between 2013 and 2021. Central and Eastern Europe sustained a stable SD state throughout 2005-2021. Western Europe maintained recessive decoupling (RD) from 2005 to 2013, then transitioned to SD during 2013-2021. North America shifted from WD to SD but showed a weakening decoupling trend overall.
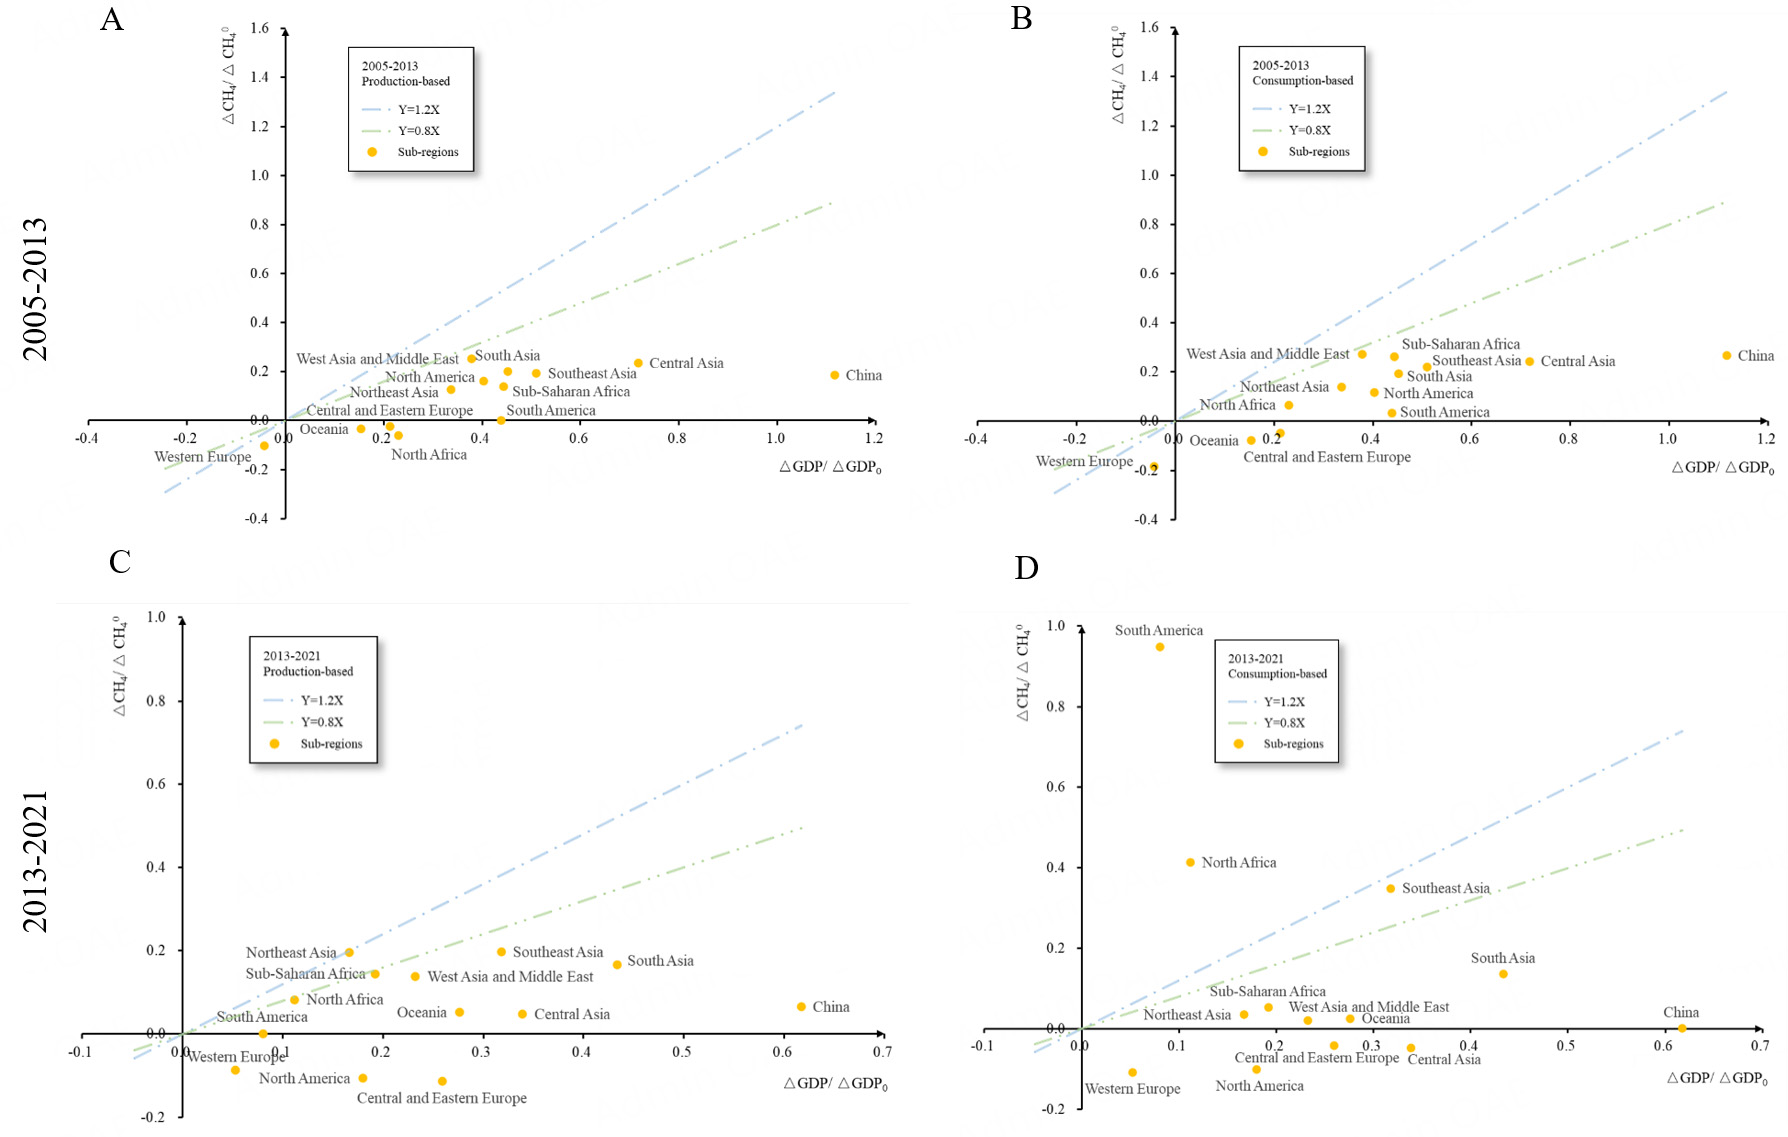
Figure 6. Decoupling statuses of PBEs and CBEs in the B&R countries. (A) PBEs; (B) CBEs; (C) PBEs; (D) CBEs.
Figure 7A-C displays the decoupling status of PBEs in the B&R countries. From 2005 to 2013, 73.91% of countries exhibited SD or WD, indicating relatively effective decoupling of economic growth from CH4 emissions. In 2013-2021, the share declined to 65.94%, reflecting that fewer countries achieved decoupling. During this period, Congo, Libya, Lesotho, Lebanon, Afghanistan, Suriname, Argentina, and Barbados entered strong negative decoupling (SND), while most expansive negative decoupling (END) occurred in Sub-Saharan African countries such as Sudan, Chad, Liberia, and Ghana. Several North African countries were in RD during 2005-2013 but shifted to SND during 2013-2021, as was the case with Libya. Conversely, Tunisia moved from WD to SD over the same periods.
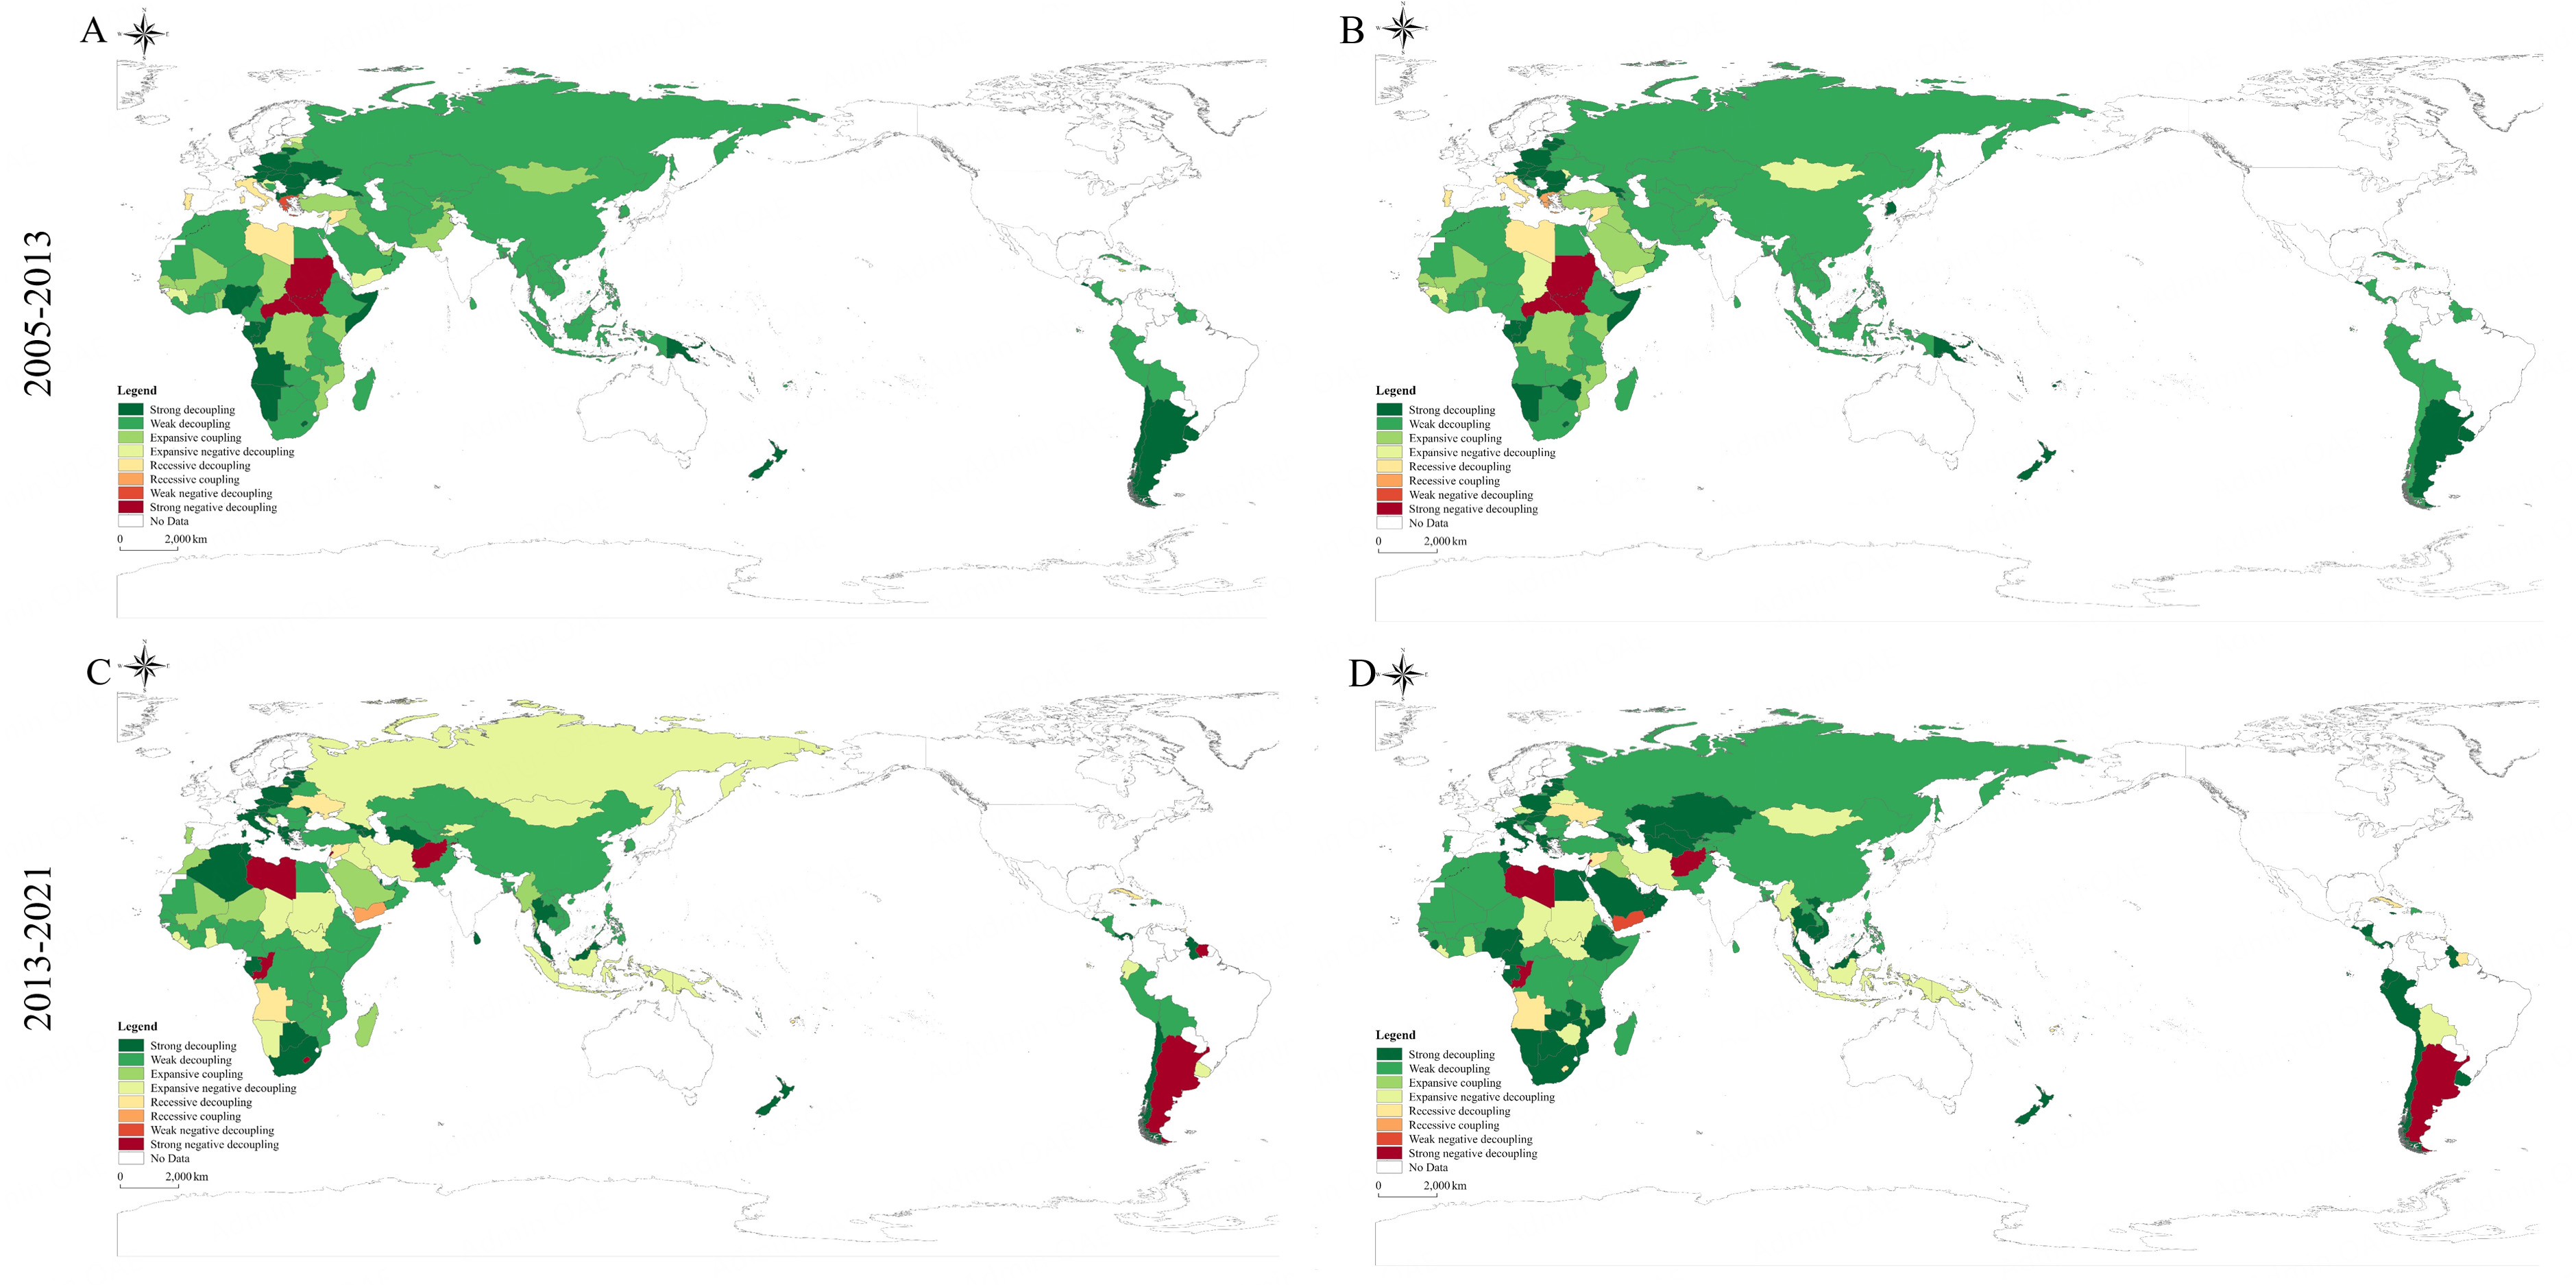
Figure 7. CH4 emission decoupling statuses of the B&R countries. (A) PBEs; (B) CBEs; (C) PBEs; (D) CBEs. Note: GS (2016) 1666.
From the consumption perspective, most B&R countries were in SD or WD, accounting for a higher proportion than PBEs (80.58%). At the subregional level, North America and Central & Eastern Europe fluctuated between SD and WD, while China and Northeast Asia maintained stable WD. Central Asia was in WD during 2005-2013 but shifted to SD in 2013-2021. In contrast, South America moved from WD in 2005-2013 to SND in 2013-2021.
Figure 7B-D illustrates the decoupling status of CBEs. Between 2005 and 2013, 76.81% of economies were in SD or WD, compared with 73.19% during 2013-2021, again showing a decrease in the number of decoupled countries. In this later period, Congo, Libya, Lebanon, Afghanistan, and Argentina experienced SND, while several Sub-Saharan African countries, such as Sudan and the Central African Republic, worsened from SND to END. Detailed country-level results for production- and consumption-based CH4 decoupling are listed in Supplementary Table 3.
Decoupling decomposition
Table 1 shows the contribution drivers of CH4 emissions within the B&R countries. The economic level (EL) was identified as the primary driver of both PBEs and CBEs. Its contribution was highest in Northeast Asia and Southeast Asia. Population size (P) also contributed to the growth of CH4 emissions, with the strongest impact observed in West Asia and the Middle East. When comparing the decoupling performance of specific countries or regions, notable differences emerge. The B&R region has strong economic growth potential; thus, further efforts to control CH4 emissions will be necessary if the region aims to balance climate risk mitigation with improvements in living standards. This indicates that the B&R region may face challenges in achieving a high level of decoupling due to its growth-oriented economic model. Emission intensity (EI) exerted a significant inhibitory effect, especially in Western Europe and Central & Eastern Europe. In contrast, North Africa experienced a marked increase in emission intensity (EI) due to its declining GDP. In Western Europe, the contribution of emissions intensity (EI) exceeded 80%, playing a decisive role in reducing CH4 emissions and supporting the achievement of a SD state. The strong decoupling observed in Western Europe is attributed to advanced technological development and stringent environmental policies, which have effectively lowered emission intensities.
Driving factors of CH4 emissions in the B&R countries during 2005-2021
| Country/Region | PBEs (%) | CBEs (%) | ||||||
| △EI | △IS | △EL | △P | △EI | △IS | △EL | △P | |
| BR countries | -40.50% | -0.38% | 43.37% | 15.75% | -40.27% | -0.39% | 44.37% | 14.97% |
| Northeast Asia | -20.20% | -0.99% | 74.53% | 4.29% | -37.33% | -0.77% | 58.12% | 3.77% |
| Central Asia | -42.39% | -0.29% | 41.60% | 15.73% | -45.35% | -0.28% | 39.56% | 14.82% |
| South Asia | -35.27% | -0.43% | 42.98% | 21.32% | -37.09% | -0.42% | 41.72% | 20.78% |
| Southeast Asia | -34.43% | -0.43% | 50.03% | 15.11% | -24.83% | -0.48% | 57.78% | 16.91% |
| West Asia and Middle East | -24.24% | -0.71% | 16.97% | 58.07% | -32.94% | -0.64% | 16.61% | 49.81% |
| Central and Eastern Europe | -52.43% | -0.51% | 41.97% | -5.08% | -50.18% | -0.55% | 44.26% | -5.01% |
| Western Europe | -79.00% | -2.06% | -11.95% | 6.99% | -84.81% | -1.36% | -7.93% | 5.91% |
| North Africa | -45.85% | -1.08% | -2.74% | 50.32% | 45.68% | -0.98% | -8.69% | 44.65% |
| Sub-Saharan Africa | -37.21% | -0.47% | 21.22% | 41.10% | -34.98% | -0.51% | 20.47% | 44.04% |
| North America | -47.99% | -0.58% | 36.37% | 15.06% | -49.87% | -0.53% | 35.90% | 13.70% |
| South America | -45.36% | -0.68% | 30.95% | 23.01% | -46.50% | -0.65% | 30.95% | 21.90% |
| Oceania | -49.13% | -0.63% | 20.81% | 29.44% | -53.51% | -0.59% | 19.05% | 26.85% |
To identify the driving factors, the decomposition factors were analyzed in Figure 8. From a production-based perspective, CH4 emissions in the B&R countries increased rapidly after 2009, rising by 8.78% in 2009-2013. After 2013, the growth rate slowed to 3.89% during 2013-2017. The results show that economic level and population size were the main contributors to rising CH4 emissions, with the economic level being dominant. Its contribution declined from 20.31% in 2005-2009 to 7.85% in 2017-2021. The contribution of population size was lower, fluctuating around 5%. Emission intensity reduced CH4 emissions, with its largest effect observed in 2005-2009 (-20.49%), decreasing to around -5% in 2017-2021, yet still playing a critical role in mitigation. In comparison, industrial structure made only a negligible contribution to emission reductions.
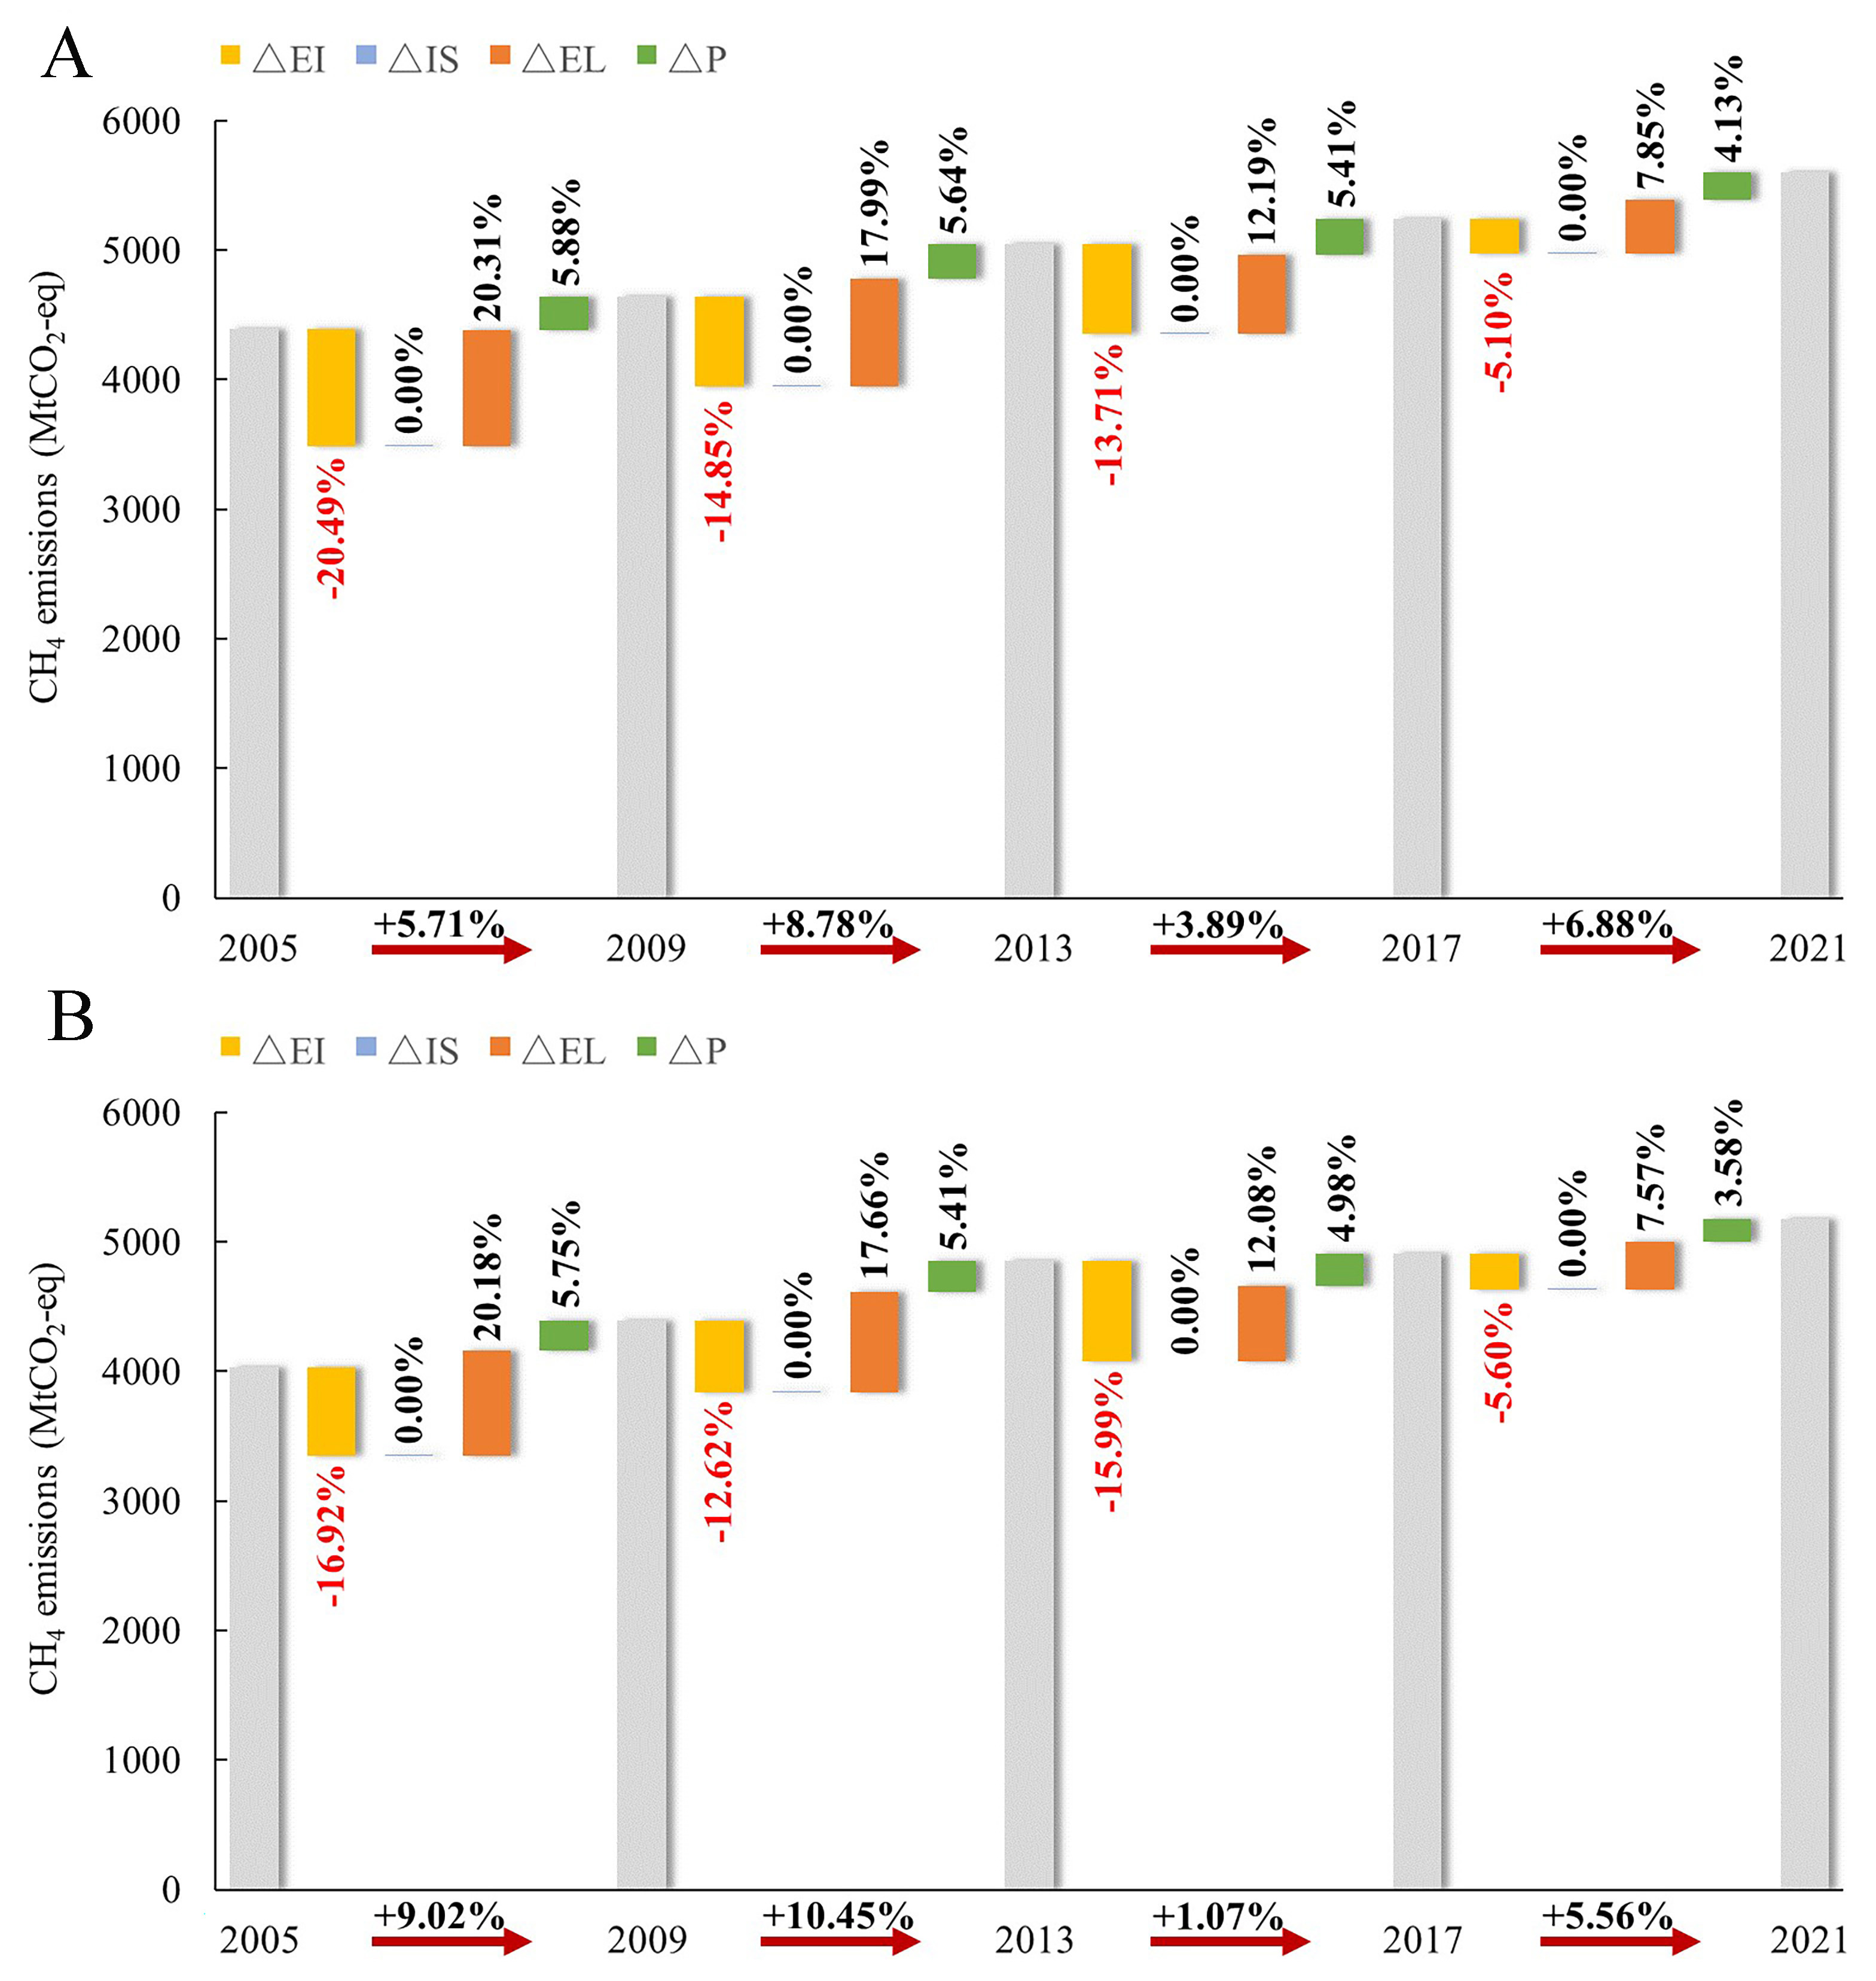
Figure 8. Decomposition factors of CH4 emission decoupling in the B&R countries. (A) PBEs; (B) CBEs.
From a consumption-based perspective, CH4 emissions in the B&R countries also grew rapidly from 2005 to 2013, faster than PBEs, but the growth rate slowed from 2013 to 2021. Similarly, economic level and population size drove emissions upward, while emission intensity remained a key factor in reduction, with its largest contribution in 2005-2009 (-16.92%), decreasing to -5.60% in 2017-2021. The contribution of industrial structure to emission reduction also declined over time. Detailed country-level production- and consumption-based CH4 emission decomposition are provided in
DISCUSSION AND POLICY IMPLICATIONS
In the context of globalization, the geographical shift of global supply chains from developed to developing countries has played an essential role[63-66]. Notably, the B&R region is largely composed of developing countries, making it the primary destination for CH4 emissions embodied in international trade. Historically, developed countries generated large amounts of greenhouse gas emissions during early industrialization, while labor-intensive and heavy industries were gradually relocated to newly industrialized economies. Although this shift promoted economic growth in developing countries, it also increased their resource uses and environmental costs. By contrast, with the support of advanced technologies and financial organizations, developed countries have been able to continuously reduce their GHG emissions.
To assess the incremental impact of CH4 emissions from B&R countries on the atmosphere, it is important to recognize that international trade activities have shifted excess responsibility for CH4 emissions onto B&R countries, particularly on behalf of developed countries and regions. This significant contribution of CH4 embodied in trade across income groups should therefore be fully considered when determining emission responsibility and developing mitigation policies. Furthermore, given the interconnectedness of trade, cooperation on CH4 mitigation between B&R and non-B&R countries needs initiation without delay. Countries with established experience in reducing CH4 emissions can provide technical assistance, actively participate in the development of renewable energy in B&R countries[67], and increase investment in non-carbon-intensive sectors[68]. Such efforts would help establish effective CH4 mitigation strategies and ensure financial support.
Table 2 compares PBEs and CBEs to highlight disparities within the B&R region. Regardless of whether emissions are measured by PBEs or CBEs, the B&R countries occupy a pivotal position in global CH4 reduction, accounting for more than half of global emissions. The disparities between PBEs and CBEs are driven by trade linkages, as CH4 emissions embodied in imports and exports influences inequality levels. Specifically, inequality in CBEs was slightly lower than in PBEs for most countries, except in the L-L income group. The highest inequality was observed in PBEs among H-H income countries, while in CBEs, the L-L income group exhibited the greatest inequality. Decoupling analysis further showed that most B&R countries were in a WD state. Regarding driving factors, ΔEL and ΔP contributed to the growth of CH4 emissions, while ΔEI exhibited an inhibitory effect and emerged as the most influential factor in mitigating emissions.
Differences between PBEs and CBEs in the B&R countries
| Category | PBEs | CBEs | ||
| 2005 | 2021 | 2005 | 2021 | |
| Proportion | 2005: 64.84% → 2021: 68.68% | 2005: 58.82% → 2021: 66.54% | ||
| CH4-intensive sectors | Agriculture, Petroleum, Chemical, and Non-Metallic Mineral Products, Construction | Food & beverages, Construction, Financial Intermediation, and Business Activities | ||
| Gini coefficient | H-H income countries had the highest values (0.460-0.510), reflecting mild to high inequality; U-M had the lowest (0.150-0.200 ), indicating high equality | L-L income countries showed the highest increase (0.388-0.455), shifting from relative balance to mild inequality; U-M had the lowest (0.140-0.200), indicating high equality | ||
| CH4 emissions per capita | H-H income countries: highest (2005: 1.70 t → 2021: 1.62 t); L-L income countries: lowest (2005: 0.73 t → 2021: 0.69 t) | H-H income countries: highest (2005: 2.02 t → 2021: 1.76 t); L-L income countries: lowest (2005: 0.48 t → 2021: 0.51 t) | ||
| Decoupling status | Weak decoupling countries accounted for 53.24% (2005-2021) | Weak decoupling countries accounted for 41.73% (2005-2021) | ||
| Driving factors | Economic level was the main driver of CH4 emissions; emission intensity showed a significant inhibitory effect | Economic level was the primary driver of CH4 emissions; emission intensity showed a significant inhibitory effect | ||
Overall, PBEs and CBEs from B&R countries have grown faster than those from non-B&R countries. Differences are also evident across income groups within the B&R region in terms of per capita PBEs and CBEs. A clear positive correlation exists between CH4 emissions and economic development: wealthier B&R countries tend to have higher per capita CH4 emissions, whereas poorer countries show lower levels. Except for H-H income countries, per capita CH4 emissions based on production are higher than those based on consumption. In contrast, H-H income countries generally exhibit higher CBEs per capita, suggesting greater consumption relative to production. However, the narrowing gap between PBEs and CBEs in these countries indicates ongoing shifts in economic structures or consumption patterns. From a production-based perspective, the persistent gap between PBEs and CBEs, especially in L-L income countries, remains a critical issue that requires targeted measures to balance CH4 emissions worldwide.
Table 3 further summarizes the comparisons between the results of this study and those reported in previous studies. Considering the differences between PBEs and CBEs, a systematic assessment of CH4 emissions from both production- to consumption-based perspectives is essential to mitigate CH4 emissions and address global climate change. The B&R initiative provides tremendous opportunities through energy cooperation, financial investment, and technology transfer[24,71,72]. In addition, it holds considerable potential for promoting sustainable development in the future[73]. Effective solutions already exist for reducing CO2 emissions, such as Carbon Capture, Utilization, and Storage (CCUS) and Carbon Capture and Storage (CCS) technologies[74]. International collaboration should be strengthened to advance coordinated action among multiple parties while enabling the transfer of green technologies. Meanwhile, practical strategies to jointly manage CH4 and CO2 emissions in international trade can be enhanced by implementing higher import tariffs on emission- and energy-intensive technologies[75].
Comparisons between the results of this study and previous studies
| Author | Method | Research scale | Time period | Main conclusions |
| Wang et al.,[7] | Environmentally extended input-output analysis (EEIOA) | Major economies | 2000-2012 | China, the EU, the US, India, and Brazil are the major economies with high consumption-based methane emissions. Russia-EU, China-US, and China-EU are the main bilateral trading pairs for embodied emission flows |
| Han et al.,[39] | Multi-regional input-output (MRIO) analysis, Decoupling analysis, Theil index | B&R region and non-B&R countries | 1990-2015 | Carbon inequality within the B&R region is lower than the global average; however, investment-driven carbon emissions exhibit a significantly increasing trend of inequality |
| Gao et al.,[69] | MRIO model, Complex network theory | B&R countries | 2011-2016 | Significant air pollution inequality exists among BRI countries, with some countries being net beneficiaries and others net victims |
| Wu et al.,[70] | MRIO model, Carbon Gini coefficient, Structural Decomposition Analysis (SDA) | Major economies | 2000-2014 | In developed countries, such as the US, embodied carbon emissions are largely driven by per capita end-use, while in developing countries, such as China, they are influenced by unsustainable consumption and investment patterns |
| This study | MRIO model, Lorenz curve, Gini coefficient, and Decoupling analysis | Major countries and regions within the B&R region | 2005-2021 | CH4 emissions from B&R countries account for over half of global emissions. The gap between PBEs and CBEs in high-income countries has narrowed over time, while significant inequality persists, especially in PBEs among high-income groups and CBEs among low-income groups |
Since the release of China’s Guidance on Promoting Green Belt and Road in 2017, climate governance within the B&R region has entered a phase of accelerated policy coordination and multilateral cooperation. In 2019, the B&R South-South Cooperation Plan on Climate Change was launched, enabling over 40 countries to deepen climate collaboration through policy instruments such as technology sharing and the establishment of low-carbon demonstration zones. By 2023, the Early Warning Initiative had been implemented in Southeast Asia, enhancing disaster response capacities in six countries through regional monitoring networks. Concurrently, the B&R Climate Cooperation Forum institutionalized mechanisms for aligning emission reduction targets and formulating green investment standards, fostering a more coordinated regional approach. Against this backdrop of intensified climate action, however, projections indicate that CH4 emissions are likely to continue rising in B&R countries. The following recommendations are proposed to achieve effective CH4 emission control and support sustainable economic growth:
(1) Industrial and technological interventions: CH4 emissions from B&R countries contributed significantly to global totals, particularly from sectors such as agriculture, petroleum, chemical, and non-metallic mineral products, construction, financial intermediation, and commercial activities. B&R countries should strengthen cooperation in renewable energy deployment by jointly investing in solar, wind, and hydroelectric projects. For traditional energy sources, such as coal and natural gas, policies should promote clean technologies, including carbon capture and storage (CCS) for coal-fired power plants and advanced natural gas purification techniques. Emission intensity has played a crucial role in facilitating decoupling in recent years, indicating that countries with lower technological levels possess greater abatement potential. By seizing the opportunities arising from technological innovation and industrial transformation, accelerating industrial structure optimization and upgrading, and improving production efficiency, countries are expected to effectively reduce CH4 emissions.
(2) Addressing regional inequality: Technological and financial constraints in some countries widen the gap in CH4 emissions between PBEs in H-H income groups and CBEs in L-L income groups, even as the divergence between PBEs and CBEs within H-H income countries narrows. To promote CH4 emission reduction, the international community should strengthen cooperation through policy coordination and joint actions. Policy coordination could involve harmonizing emission standards and regulatory frameworks across B&R countries, while joint actions could include collaborative research and development programs focused on CH4 capture and utilization technologies. Weak decoupling remains a challenge for reducing CH4 emissions across the B&R countries. In the context of global economic integration, uneven distribution and potential fragmentation of technologies and resources, despite increasing economic linkages, may weaken collective climate action. Strengthening cooperation in environmental protection, promoting clean energy projects, developing ecological infrastructure, and facilitating green trade will reduce emission intensity across the B&R region and help narrow the emissions gap with the rest of the world.
(3) Strengthening regional cooperation and capacity building: Effective CH4 emission reduction requires close cooperation among countries and enterprises along the energy supply chain, with an emphasis on capacity building, standardization of monitoring technologies and criteria, data-sharing platforms, innovation in emission reduction technologies, and joint infrastructure development. Regional agreements on monitoring standards will ensure consistent data quality, while shared data platforms will promote transparency and informed decision making. Joint innovation initiatives focused on CH4 detection and mitigation can accelerate technological progress. Additionally, a tiered approach can maximize effectiveness: high-income B&R countries can fund R&D and share advanced CH4 reduction technologies, while low-income countries receive training in CH4 management and support for basic monitoring. When combined with reinforced international cooperation, sustainable practices, improved regulatory frameworks, advocacy for green B&R initiatives, and public awareness campaigns, these measures will significantly reduce CH4 emissions and foster a more sustainable environmental future in the B&R region.
CONCLUSION
Following China’s proposal to collaborate with other countries in building a Green Silk Road, the countries along the B&R have played a crucial role in mitigating greenhouse gas emissions, especially non-CO2 emissions. Using compiled CH4 emission inventories, this study employs a MRIO analysis to compare PBEs and CBEs across 138 countries and regions within the B&R context. The Lorenz curve and Gini coefficient are used to reveal disparities in CH4 emissions among different income groups, while the decoupling status of PBEs and CBEs from economic growth is thoroughly assessed. The results demonstrate that the B&R countries contribute substantially to global CH4 emissions. Although CBEs are consistently lower than PBEs, they are increasing at a faster pace. Significant emission inequalities exist, particularly PBEs in H-H income groups and CBEs in L-L income groups, though the gap between PBEs and CBEs in H-H income countries has narrowed. These findings enhance the understanding of CH4 emission dynamics in the B&R region and offer valuable insights for policymakers seeking to address emission inequalities and implement targeted mitigation strategies. Several limitations should be noted. First, the Eora datasets may have constraints in terms of coverage, accuracy, and timeliness, potentially affecting the estimation of economic interactions. Second, sectoral aggregation can mask intersectoral differences, leading to less precise assessments of economic disparities and influencing indicators such as the Gini coefficient. Third, the MRIO method may yield range-bound footprint analyses due to the limited robustness and reliability of the original data. Such uncertainties in data and methods may result in deviations in the findings, which should be addressed in future research. To jointly tackle global climate change, countries involved in the B&R Initiative are encouraged to actively engage in CH4 emission mitigation and strengthen international cooperation in this area, which presents a valuable opportunity for coordinated global action to reduce CH4 emissions and combat climate change.
DECLARATIONS
Authors’ contributions
Conceptualization, formal analysis, writing - original draft: Han, M.
Formal analysis, visualization, writing - original draft: Sun, Z.
Methodology, data curation: Zhao, Y.
Conceptualization, writing - review & editing: Zhang, B.
Availability of data and materials
The datasets are available in the following open-access data files: EDGAR 6.0 (http://data.europa.eu/89h/97a67d67-c62e-4826-b873-9d972c4f670b), the UNFCCC database (https://unfccc.int), the Eora database
Financial support and sponsorship
This research was supported by the National Social Science Fund of China (Grant No. 22CJY020).
Conflicts of interest
Han, M. is the Guest Editor of the Special Issue “The Race to Decarbonization in the Next Phase of Globalization”. Han, M. was not involved in any steps of editorial processing, notably including reviewer selection, manuscript handling, or decision making, while the other authors have declared that they have no conflicts of interest.
Ethical approval and consent to participate
Not applicable.
Consent for publication
Not applicable.
Copyright
© The Author(s) 2025.
Supplementary Materials
REFERENCES
1. Etminan, M.; Myhre, G.; Highwood, E. J.; Shine, K. P. Radiative forcing of carbon dioxide, methane, and nitrous oxide: a significant revision of the methane radiative forcing. Geophys. Res. Lett. 2016, 43.
2. IPCC. Climate change 2013: the physical science basis. In: Contribution of Working Group I to the Fifth Assessment Report of the Intergovernmental Panel on Climate Change. Cambridge: Cambridge University Press. Available from: https://www.ipcc.ch/report/ar5/wg1/ [Last accessed on 12 Sep 2025].
3. Nisbet, E. G.; Manning, M. R.; Dlugokencky, E. J.; et al. Very strong atmospheric methane growth in the 4 years 2014-2017: implications for the Paris agreement. Global. Biogeochem. Cycles. 2019, 33, 318-42.
4. Zhou, Y.; Li, J.; Cui, J.; et al. Personal GHG emissions accounting and the driving forces decomposition in the past 10 years. Carb. Neutrality. 2023, 2, 45.
5. Folberth, G. A.; Jones, C. D.; O’connor, F. M.; Gedney, N.; Griffiths, P. T.; Wiltshire, A. J. Drivers of persistent changes in the global methane cycle under aggressive mitigation action. NPJ. Clim. Atmos. Sci. 2025, 8, 867.
6. Nzotungicimpaye, C.; Macisaac, A. J.; Zickfeld, K. Delaying methane mitigation increases the risk of breaching the 2 °C warming limit. Commun. Earth. Environ. 2023, 4, 898.
7. Wang, Y.; Chen, B.; Guan, C.; Zhang, B. Evolution of methane emissions in global supply chains during 2000-2012. Resour. Conserv. Recy. 2019, 150, 104414.
8. Wang, C.; Miao, Z.; Chen, X.; Cheng, Y. Factors affecting changes of greenhouse gas emissions in Belt and Road countries. Renew. Sustain. Energy. Rev. 2021, 147, 111220.
9. World Bank. World Bank open data. 2022; Available from: http://data.worldbank.org [Last accessed on 12 Sep 2025].
10. Ascensão, F.; Fahrig, L.; Clevenger, A. P.; et al. Environmental challenges for the Belt and Road Initiative. Nat. Sustain. 2018, 1, 206-9.
11. Xiang, T.; Du, M.; Yang, L.; et al. Impacts of trade facilitation on greenhouse gas emissions in the Belt and Road Initiative countries. Resour. Conserv. Recy. 2024, 209, 107777.
12. Zhang, N.; Liu, Z.; Zheng, X.; Xue, J. Carbon footprint of China's Belt and Road. Science 2017, 357, 1107.
13. Zhang, D.; Wu, L.; Huang, S.; et al. Ecology and environment of the Belt and Road under global climate change: a systematic review of spatial patterns, cost efficiency, and ecological footprints. Ecol. Ind. 2021, 131, 108237.
14. Tan, X.; Zhu, K.; Sun, Y.; Zhao, W.; Chen, F. Bibliometric research on the development of climate change in the BRI regions. Adv. Climate. Chang. Res. 2021, 12, 254-62.
15. Li, Y.; Zhong, H.; Shan, Y.; et al. Changes in global food consumption increase GHG emissions despite efficiency gains along global supply chains. Nat. Food. 2023, 4, 483-95.
16. Lee, H. S.; Arestis, P.; Chong, S. C.; Yap, S.; Sia, B. K. The heterogeneous effects of urbanisation and institutional quality on greenhouse gas emissions in Belt and Road Initiative countries. Environ. Sci. Pollut. Res. Int. 2022, 29, 1087-105.
17. Yin, Y.; Xiong, X.; Hussain, J. The role of physical and human capital in FDI-pollution-growth nexus in countries with different income groups: a simultaneity modeling analysis. Environ. Impact. Assess. Rev. 2021, 91, 106664.
18. Yuelan, P.; Akbar, M. W.; Zia, Z.; Arshad, M. I. Exploring the nexus between tax revenues, government expenditures, and climate change: empirical evidence from Belt and Road Initiative countries. Econ. Chang. Restruct. 2022, 55, 1365-95.
19. Shi, K.; Yu, B.; Huang, C.; Wu, J.; Sun, X. Exploring spatiotemporal patterns of electric power consumption in countries along the Belt and Road. Energy 2018, 150, 847-59.
20. Tao, Y.; Liang, H.; Celia, M. A. Electric power development associated with the Belt and Road Initiative and its carbon emissions implications. Appl. Energy. 2020, 267, 114784.
21. Fan, J.; Da, Y.; Wan, S.; et al. Determinants of carbon emissions in ‘Belt and Road initiative’ countries: A production technology perspective. Appl. Energy. 2019, 239, 268-79.
22. Chou, J.; Li, Y.; Xu, Y.; Zhao, W.; Li, J.; Hao, Y. Carbon dioxide emission characteristics and peak trend analysis of countries along the Belt and Road. Environ. Sci. Pollut. Res. Int. 2023, 30, 81881-95.
23. Chen, Z.; Yang, Y.; Zhou, L.; et al. Ecological restoration in mining areas in the context of the Belt and Road initiative: capability and challenges. Environ. Impact. Assess. Rev. 2022, 95, 106767.
24. Zhao, Y.; Liu, X.; Wang, S.; Ge, Y. Energy relations between China and the countries along the Belt and Road: an analysis of the distribution of energy resources and interdependence relationships. Renew. Sustain. Energy. Rev. 2019, 107, 133-44.
25. Hou, J.; Deng, X.; Springer, C. H.; Teng, F. A global analysis of CO2 and non-CO2 GHG emissions embodied in trade with Belt and Road Initiative countries. Ecosyst. Health. Sustain. 2020, 6, 1761888.
26. Wang, X.; Wang, Y.; Wei, C. The impact of natural resource abundance on green economic growth in the belt and road countries: The role of institutional quality. Environ. Impact. Assess. Rev. 2023, 98, 106977.
27. Chen, J.; Zhou, W.; Yang, H.; Wu, Z. “Grouping” or “ride one’s coattails”? - How developing countries along the Belt and Road satisfy themselves. Energies 2021, 14, 3498.
28. Sun, X.; Shi, Q. Factors influencing embodied energy trade between the Belt and Road countries: a gravity approach. Environ. Sci. Pollut. Res. Int. 2022, 29, 11574-89.
29. Li, C.; Liu, B. Air pollution embodied in China’s trade with the BR countries: transfer pattern and environmental implication. J. Clean. Prod. 2020, 247, 119126.
30. Wang, L.; Zou, Z.; Liang, S.; Xu, M. Virtual scarce water flows and economic benefits of the Belt and Road Initiative. J. Clean. Prod. 2020, 253, 119936.
31. Fang, K.; Wang, S.; He, J.; Song, J.; Fang, C.; Jia, X. Mapping the environmental footprints of nations partnering the Belt and Road Initiative. Resour. Conserv. Recy. 2021, 164, 105068.
32. Han, M.; Li, W. Tele-connecting renewable energy availability from production to consumption via multi-national supply chains. Renew. Energy. 2024, 227, 120405.
33. Cai, X.; Che, X.; Zhu, B.; Zhao, J.; Xie, R. Will developing countries become pollution havens for developed countries? An empirical investigation in the Belt and Road. J. Clean. Prod. 2018, 198, 624-32.
34. Fan, J. L.; Dong, Y.; Zhang, X. How does "the Belt and Road" and the Sino-US trade conflict affect global and Chinese CO2 emissions? Environ. Sci. Pollut. Res. Int. 2020, 27, 38715-31.
35. Li, Y.; Bai, X. How can China and the Belt and Road initiative countries work together responding to climate change: a perspective on carbon emissions and economic spillover effects. Int. J. Environ. Res. Public. Health. 2022, 19, 9553.
36. Yang, J.; Gong, T.; Li, C.; et al. Carbon footprint analysis of supply chain of bio-based methyl levulinate production in China. Carb. Neutrality. 2023, 2, 58.
37. Li, Y.; Lin, K.; Huang, Q. Research on the measurement and driving factors of manufacturing export embodied carbon between China and the countries along “the Belt and Road”. Pol. J. Environ. Stud. 2021, 30, 727-37.
38. Yang, Y.; Wang, H.; Löschel, A.; Zhou, P. Patterns and determinants of carbon emission flows along the Belt and Road from 2005 to 2030. Ecol. Econ. 2022, 192, 107260.
39. Han, M.; Lao, J.; Yao, Q.; Zhang, B.; Meng, J. Carbon inequality and economic development across the Belt and Road regions. J. Environ. Manag. 2020, 262, 110250.
40. Lu, Q.; Fang, K.; Heijungs, R.; et al. Imbalance and drivers of carbon emissions embodied in trade along the Belt and Road initiative. Appl. Energy. 2020, 280, 115934.
41. Wang, X.; Yang, J.; Zhou, Q.; Liu, M.; Bi, J. Mapping the exchange between embodied economic benefits and CO2 emissions among Belt and Road initiative countries. Appl. Energy. 2022, 307, 118206.
42. Wang, Z.; Meng, J.; Zheng, H.; et al. Temporal change in India’s imbalance of carbon emissions embodied in international trade. Appl. Energy. 2018, 231, 914-25.
43. Liu, X. J.; Jin, X. B.; Luo, X. L.; Zhou, Y. K. Multi-scale variations and impact factors of carbon emission intensity in China. Sci. Total. Environ. 2023, 857, 159403.
44. Ma, X.; Zhao, C.; Song, C.; et al. The impact of regional policy implementation on the decoupling of carbon emissions and economic development. J. Environ. Manag. 2024, 355, 120472.
45. Shrestha, R. K. Red versus blue states: inequality in energy-related CO2 emissions in the United States (1997-2021). J. Clean. Prod. 2024, 468, 143127.
46. Wu, S.; Chen, Z. Carbon inequality in China: evidence from city-level data. China. Econ. Rev. 2023, 78, 101940.
47. Tapio, P. Towards a theory of decoupling: degrees of decoupling in the EU and the case of road traffic in Finland between 1970 and 2001. Transp. Policy. 2005, 12, 137-51.
48. Lundquist, S. Explaining events of strong decoupling from CO2 and NOx emissions in the OECD 1994-2016. Sci. Total. Environ. 2021, 793, 148390.
49. Naseem, S.; Mohsin, M.; Zia-Ur-Rehman, M.; Baig, S. A.; Sarfraz, M. The influence of energy consumption and economic growth on environmental degradation in BRICS countries: an application of the ARDL model and decoupling index. Environ. Sci. Pollut. Res. Int. 2022, 29, 13042-55.
50. Hu, M.; Li, R.; You, W.; Liu, Y.; Lee, C. Spatiotemporal evolution of decoupling and driving forces of CO2 emissions on economic growth along the Belt and Road. J. Clean. Prod. 2020, 277, 123272.
51. Wang, C.; Wood, J.; Geng, X.; Wang, Y.; Qiao, C.; Long, X. Transportation CO2 emission decoupling: empirical evidence from countries along the belt and road. J. Clean. Prod. 2020, 263, 121450.
52. Wang, J.; Dong, X.; Dong, K. How renewable energy reduces CO2 emissions? Decoupling and decomposition analysis for 25 countries along the Belt and Road. Appl. Econ. 2021, 53, 4597-613.
53. Dong, J.; Li, C.; Wang, Q. Decomposition of carbon emission and its decoupling analysis and prediction with economic development: a case study of industrial sectors in Henan Province. J. Clean. Prod. 2021, 321, 129019.
54. Zhang, Y.; Da, Y. The decomposition of energy-related carbon emission and its decoupling with economic growth in China. Renew. Sustain. Energy. Rev. 2015, 41, 1255-66.
55. Mousavi, B.; Lopez, N. S. A.; Biona, J. B. M.; Chiu, A. S.; Blesl, M. Driving forces of Iran's CO2 emissions from energy consumption: an LMDI decomposition approach. App. Energy. 2017, 206, 804-14.
56. Leontief, W. Environmental repercussions and the economic structure: an input-output approach. Rev. Econ. Stat. 1970, 52, 262.
57. IPCC First Assessment Report (FAR). Climate change: the IPCC response strategies (1990). Available from: https://archive.ipcc.ch/publications_and_data/publications_ipcc_first_assessment_1990_wg3.shtml [Last accessed on 12 Sep 2025].
58. UNFCCC. National inventory submissions 2019 and greenhouse gas inventory data - detailed data by party. Available from: https://unfccc.int [Last accessed on 12 Sep 2025].
59. Ferrario, F. M.; Crippa, M.; Guizzardi, D.; et al. EDGAR v6.0 greenhouse gas emissions joint research centre. 2021; Available from: http://data.europa.eu/89h/97a67d67-c62e-4826-b873-9d972c4f670b [Last accessed on 12 Sep 2025].
60. Lenzen, M.; Kanemoto, K.; Moran, D.; Geschke, A. Mapping the structure of the world economy. Environ. Sci. Technol. 2012, 46, 8374-81.
61. Lenzen, M.; Moran, D.; Kanemoto, K.; Geschke, A. Building eora: a global multi-region input-output database at high country and sector resolution. Econ. Syst. Res. 2013, 25, 20-49.
62. National Development and Reform Commission, Ministry of Foreign Affairs, Ministry of Commerce of China. In: Vision and Actions on Jointly Building Silk Road Economic Belt and 21st-Century Maritime Silk Road Foreign Languages Press, Beijing. 2015. Available from: https://www.fmprc.gov.cn/wjb_673085/zzjg_673183/gjjjs_674249/gjzzyhygk_674253/ydylfh_692140/zywj_692152/201503/t20150328_10410165.shtml [Last accessed on 12 Sep 2025].
63. Jiang, X.; Green, C. The impact on global greenhouse gas emissions of geographic shifts in global supply chains. Ecol. Econ. 2017, 139, 102-14.
64. Peters, G. P. From production-based to consumption-based national emission inventories. Ecol. Econ. 2008, 65, 13-23.
65. Peters, G. P.; Minx, J. C.; Weber, C. L.; Edenhofer, O. Growth in emission transfers via international trade from 1990 to 2008. Proc. Natl. Acad. Sci. USA. 2011, 108, 8903-8.
66. Taherzadeh, O. Locating pressures on water, energy and land resources across global supply chains. J. Clean. Prod. 2021, 321, 128701.
67. Gu, A.; Zhou, X. Emission reduction effects of the green energy investment projects of China in belt and road initiative countries. Ecosyst. Health. Sustain. 2020, 6, 1747947.
68. Cheng, S.; Qi, S. The potential for China's outward foreign direct investment and its determinants: A comparative study of carbon-intensive and non-carbon-intensive sectors along the Belt and Road. J. Environ. Manag. 2021, 282, 111960.
69. Gao, C.; Zhu, M.; Sun, M.; Gao, A. Uncovering the trade-induced air pollution inequality among Belt and Road Initiative (BRI) countries. J. Clean. Prod. 2023, 411, 137283.
70. Wu, W.; Zhang, N.; Li, A.; Chen, Y. The path to global climate justice: from the perspective of regional discrepancy in embodied carbon emissions. Environ. Impact. Assess. Rev. 2024, 105, 107410.
71. Zhang, C.; Fu, J.; Pu, Z. A study of the petroleum trade network of countries along “The Belt and Road Initiative”. J. Clean. Prod. 2019, 222, 593-605.
72. Zhang, J. Oil and gas trade between China and countries and regions along the ‘Belt and Road’: a panoramic perspective. Energy. Policy. 2019, 129, 1111-20.
73. Sarker, M. N. I.; Hossin, M. A.; Yin, X.; Sarkar, M. K. One belt one road initiative of China: implication for future of global development. Mod. Econ. 2018, 9, 623-38.
74. Fan, J.; Xu, M.; Li, F.; Yang, L.; Zhang, X. Carbon capture and storage (CCS) retrofit potential of coal-fired power plants in China: The technology lock-in and cost optimization perspective. Appl. Energy. 2018, 229, 326-34.
Cite This Article
How to Cite
Download Citation
Export Citation File:
Type of Import
Tips on Downloading Citation
Citation Manager File Format
Type of Import
Direct Import: When the Direct Import option is selected (the default state), a dialogue box will give you the option to Save or Open the downloaded citation data. Choosing Open will either launch your citation manager or give you a choice of applications with which to use the metadata. The Save option saves the file locally for later use.
Indirect Import: When the Indirect Import option is selected, the metadata is displayed and may be copied and pasted as needed.
About This Article
Special Issue
Copyright

Data & Comments
Data
0


Comments
Comments must be written in English. Spam, offensive content, impersonation, and private information will not be permitted. If any comment is reported and identified as inappropriate content by OAE staff, the comment will be removed without notice. If you have any queries or need any help, please contact us at [email protected].