


fig3
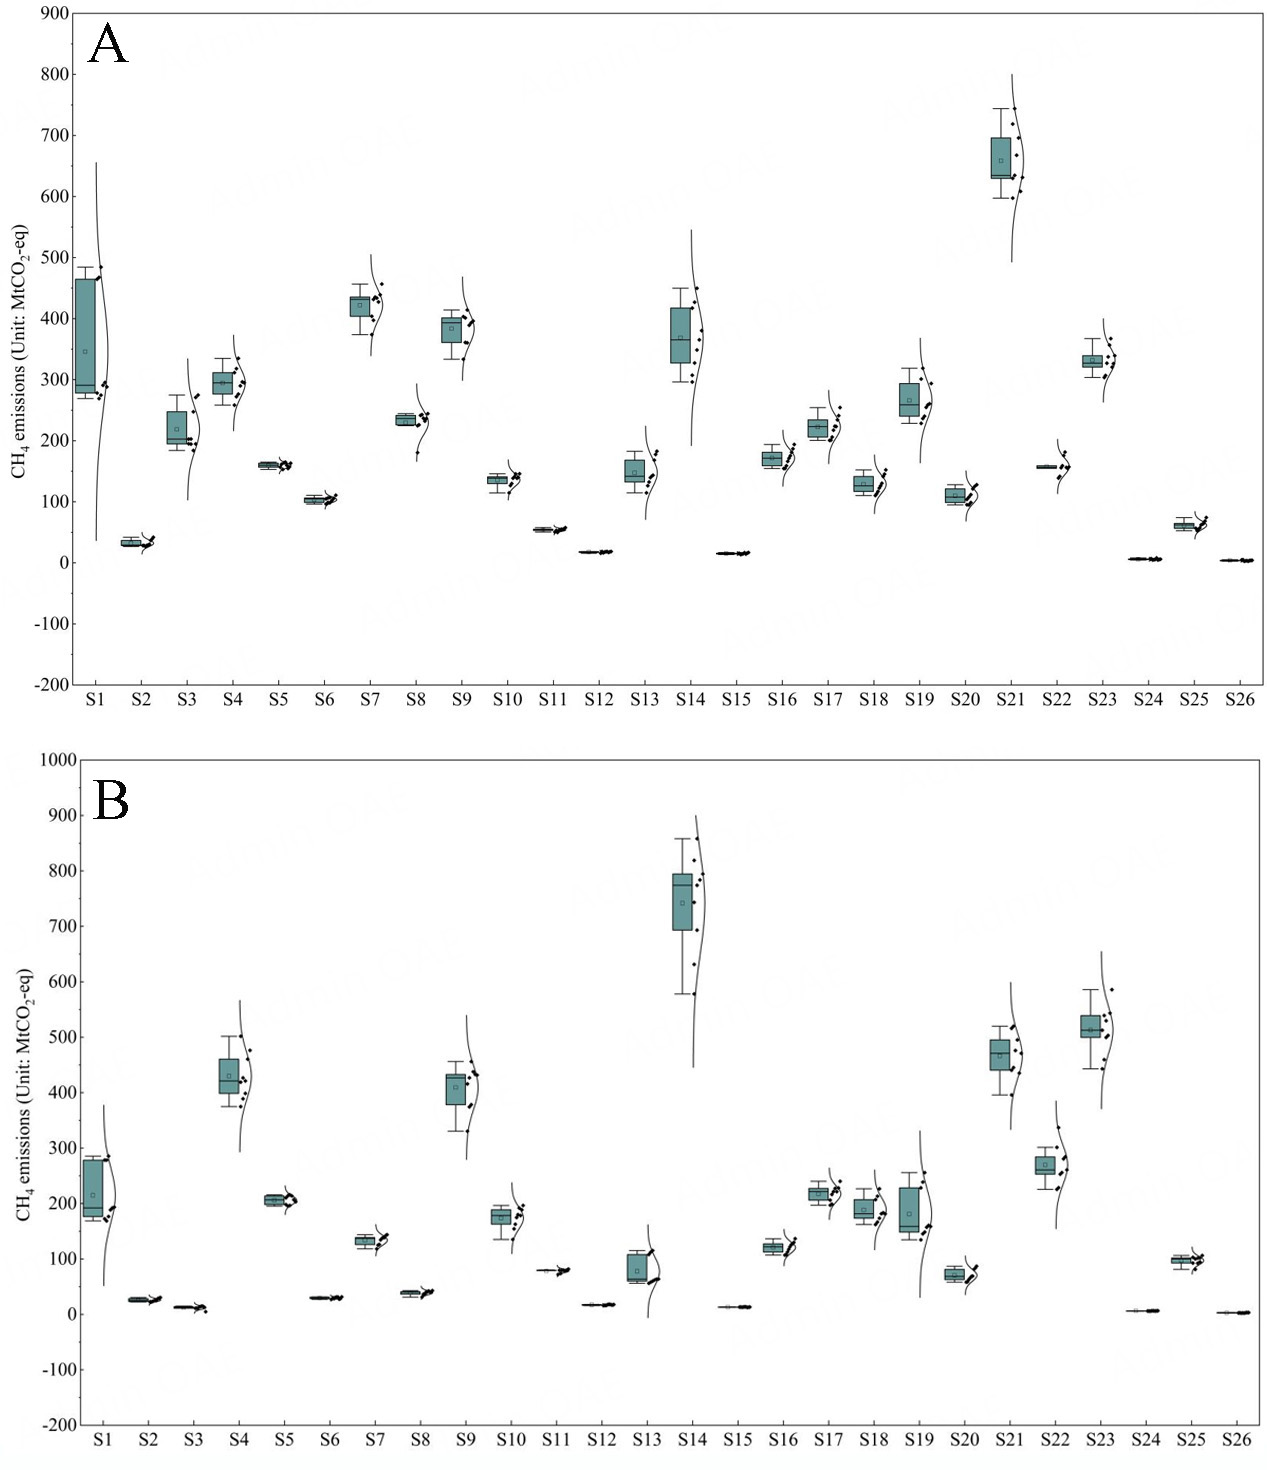
Figure 3. Statistical characteristics of CH4 emissions in the B&R countries. notes: The scatter box diagram displays six values and one curve: maximum, 75th percentile, mean, median, 25th percentile, minimum, and the normal distribution curve. (A) PBEs; (B) CBEs.


