


fig5
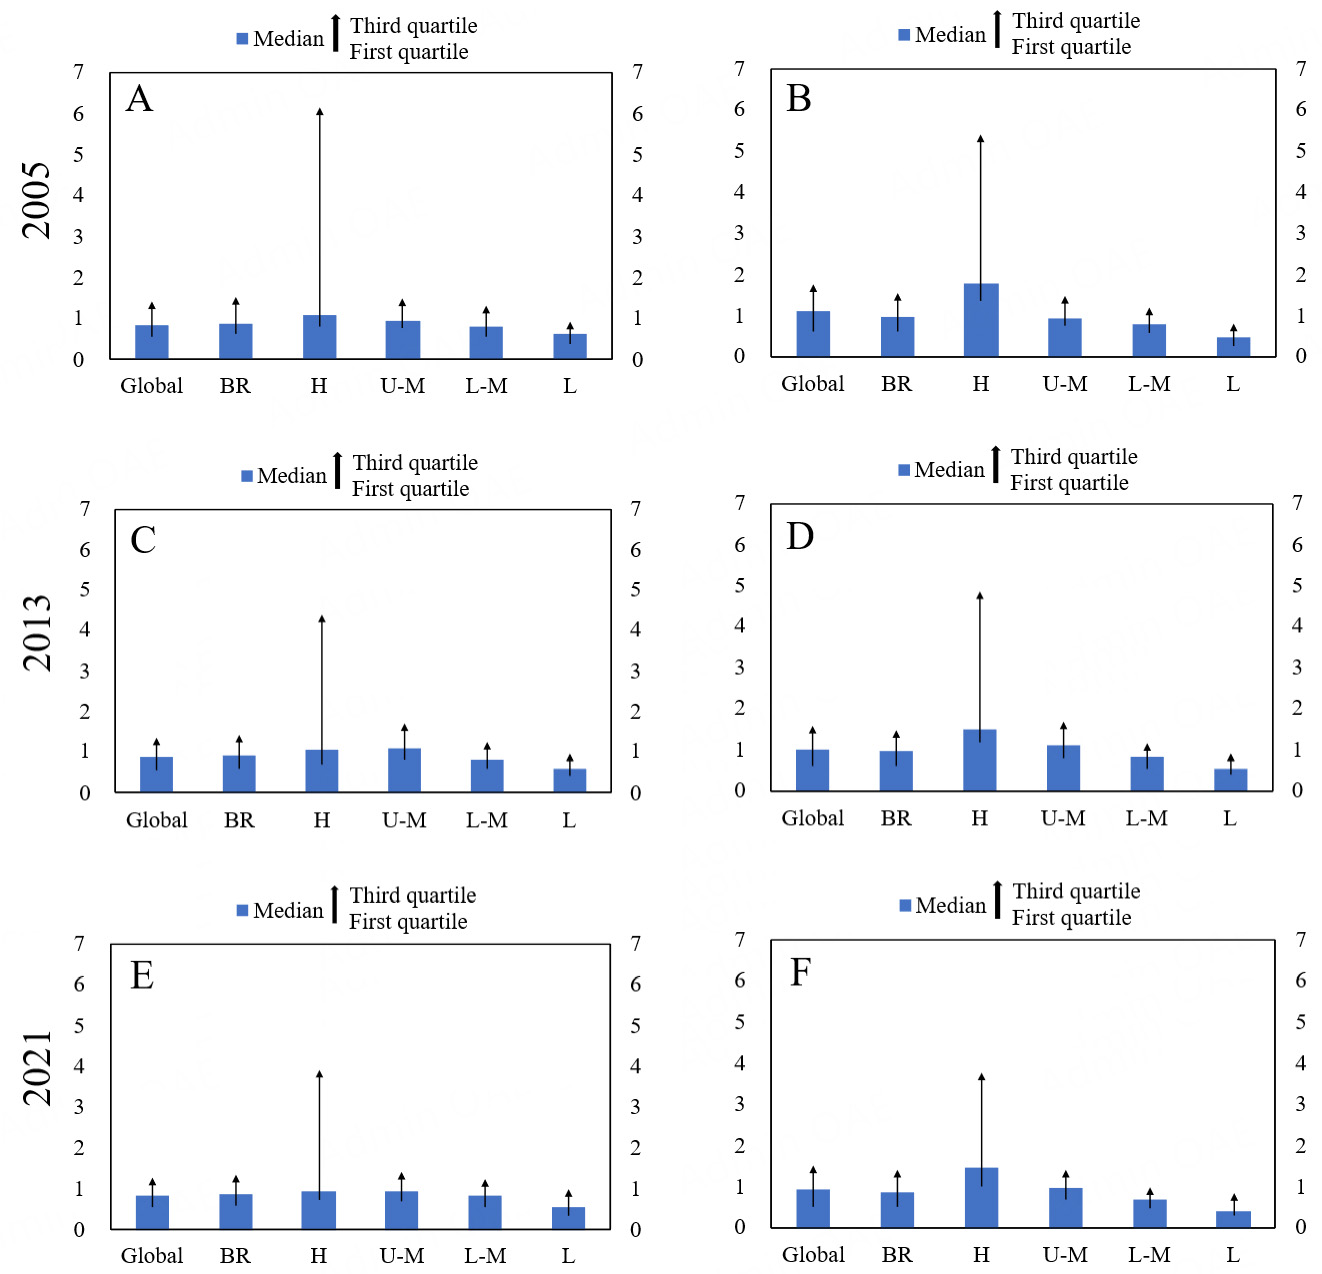
Figure 5. CH4 emissions across income groups in the B&R region (unit: tons per capita). (A) PBEs; (B) CBEs; (C) PBEs; (D) CBEs; (E) PBEs; (F) CBEs.
Figure 5. CH4 emissions across income groups in the B&R region (unit: tons per capita). (A) PBEs; (B) CBEs; (C) PBEs; (D) CBEs; (E) PBEs; (F) CBEs.


All published articles are preserved here permanently
https://www.portico.org/publishers/oae/


