
fig6
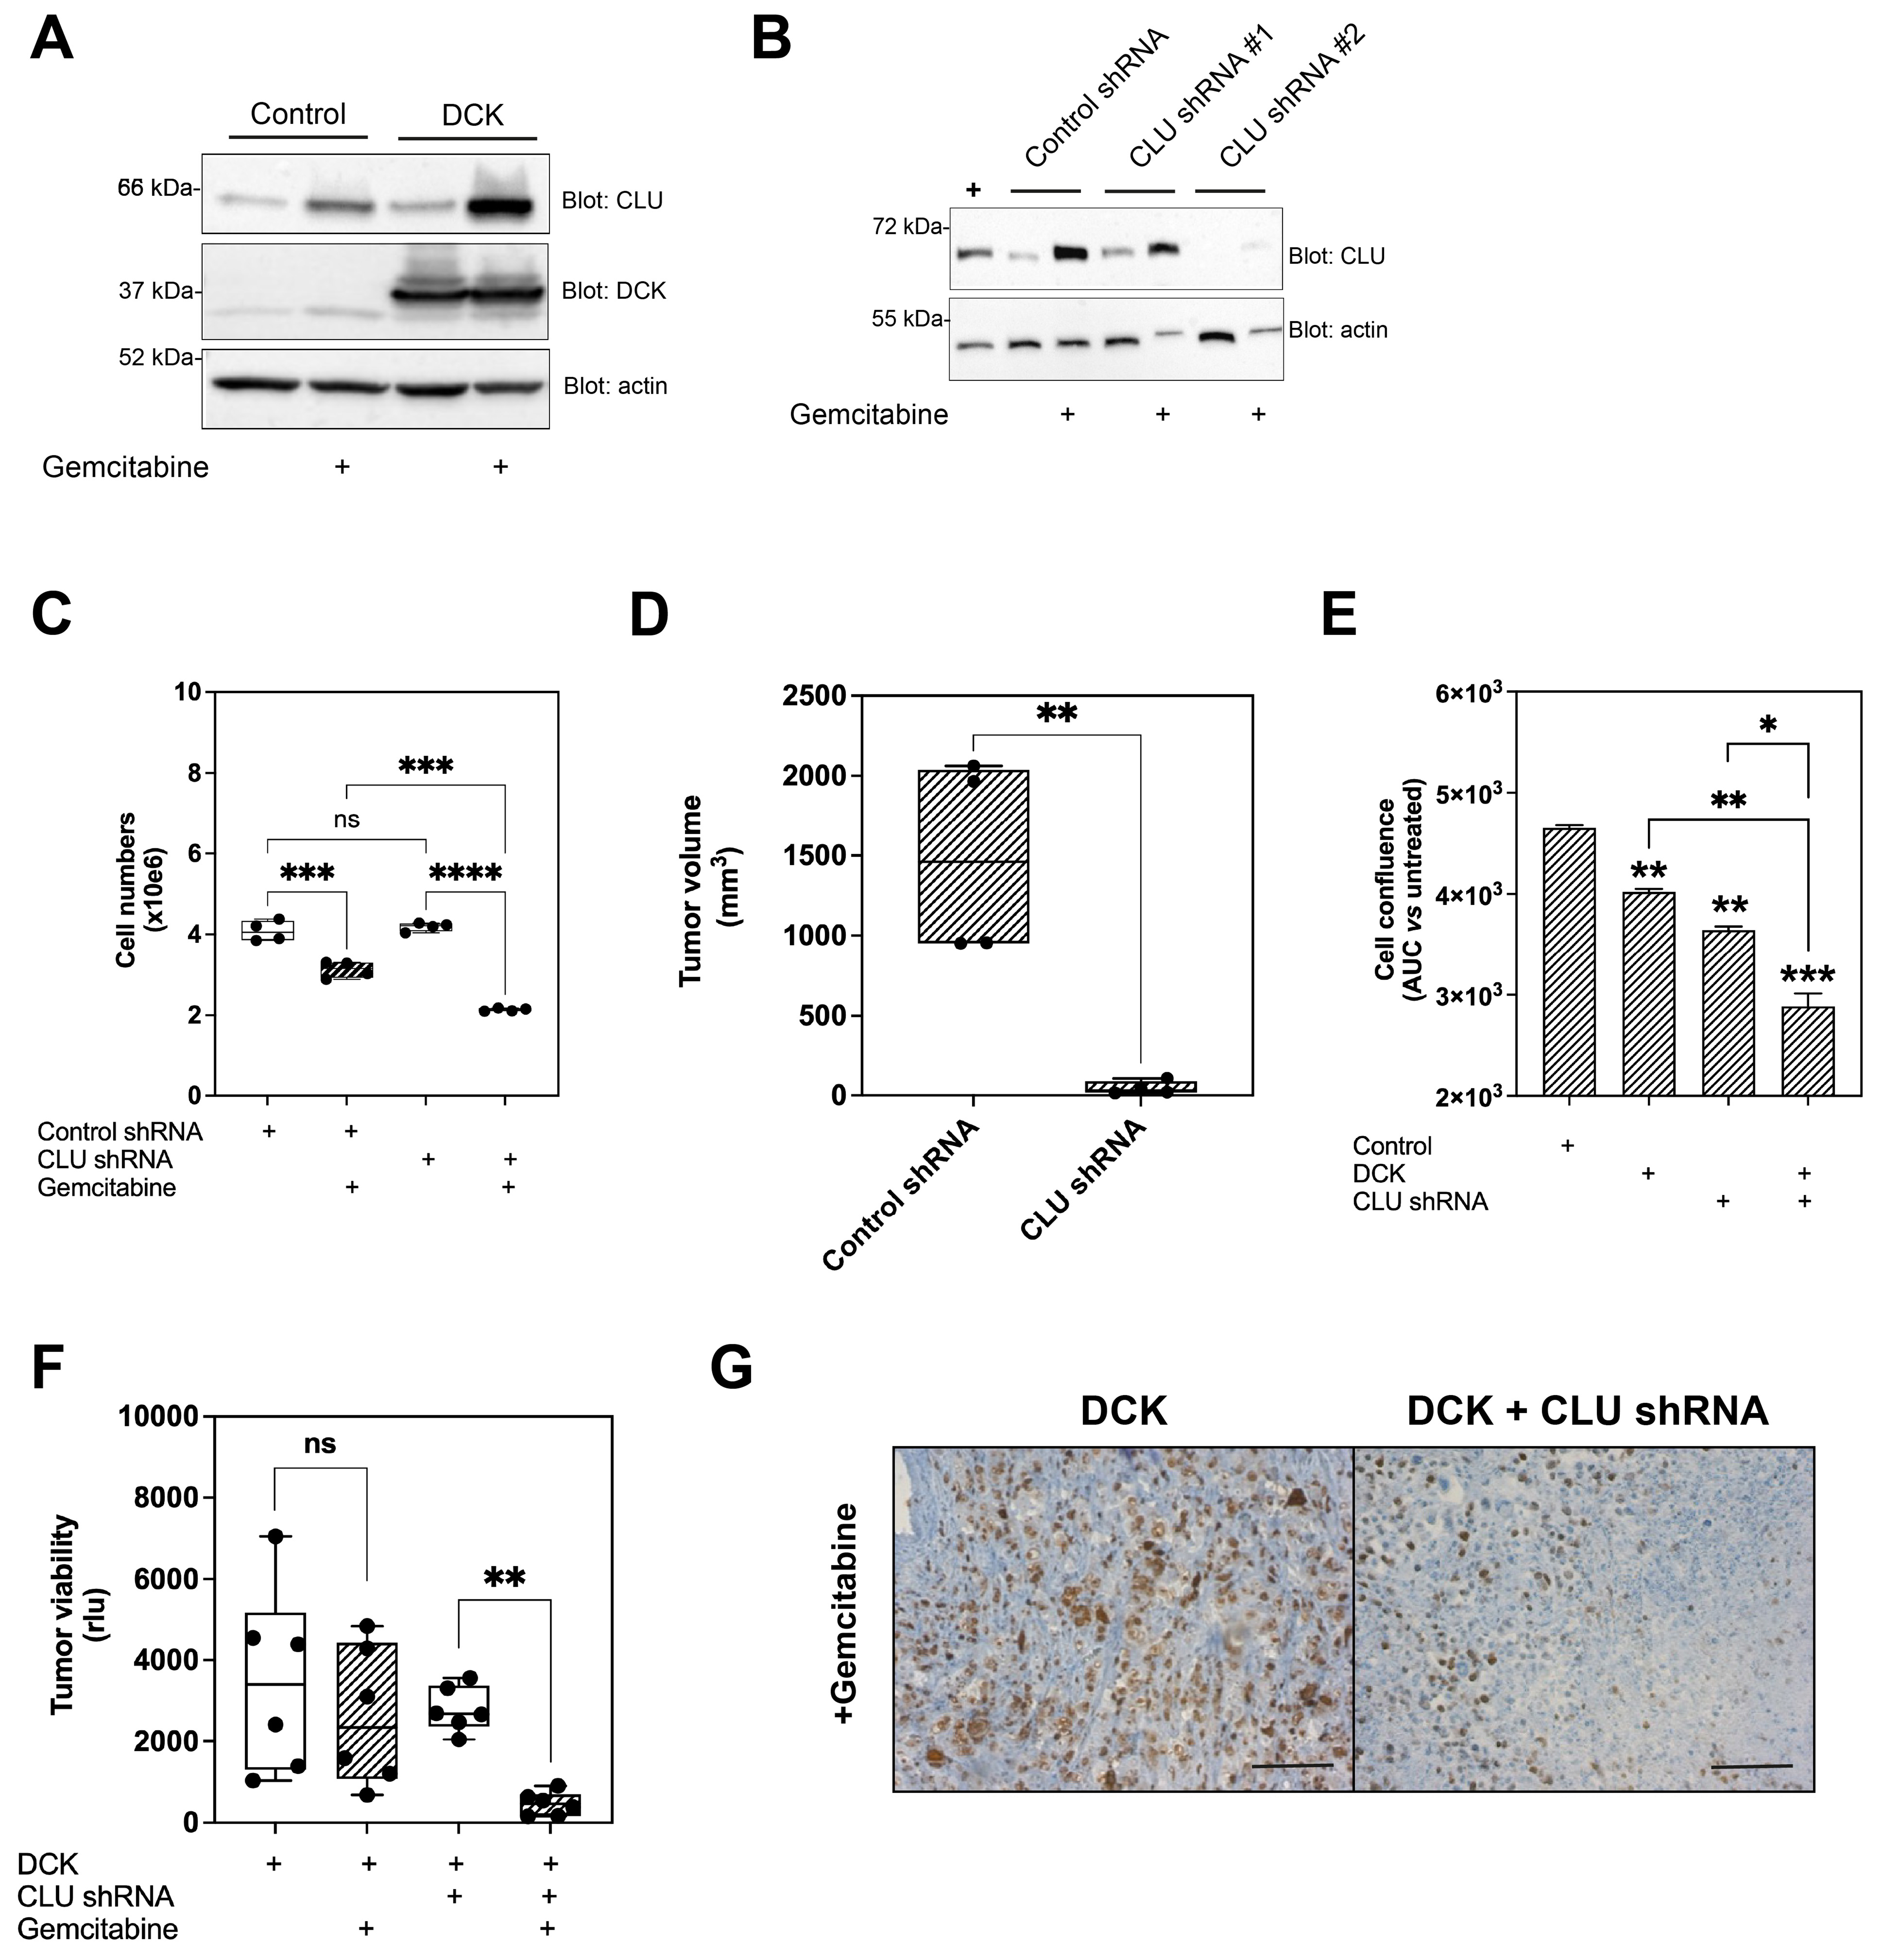
Figure 6. CLU inhibition enhances gene therapy and chemotherapy efficacy in experimental models of PDAC. (A) Western blot for CLU and DCK expression in Mia PaCa-2 cells stably expressing DCK. Mia PaCa-2 cells stably expressing GFP were used as a control. Cells were treated with or without 100 nM gemcitabine for 48 h. PBS was used as a mock treatment. Actin was used as a loading control. Data are representative of three biological replicates (n = 3); (B) Western blot for CLU expression in Mia PaCa-2 cells expressing control shRNAs or shRNAs targeting CLU. Actin was used as a loading control. Data are representative of three biological replicates (n = 3); (C) Cell counting of Mia PaCa-2 cells expressing either control shRNA or CLU shRNA, treated with or without 100 nM gemcitabine. PBS was used as a mock treatment. Results represent the mean of four independent experiments, each performed in triplicate. Statistical analysis was conducted using a two-way ANOVA; (D) Tumor volume of Mia PaCa-2 orthotopic xenografts in NSG mice expressing either control shRNA or CLU shRNA, treated or not with gemcitabine (n = 4 per group). Data are presented as minimum to maximum values. Statistical analysis was performed using a two-way ANOVA; (E) Cell confluence of Mia PaCa-2 cells expressing control shRNA, CLU shRNA, and/or DCK, treated with or without 100 nM gemcitabine. PBS was used as a mock treatment. Results represent the mean of four independent experiments, each performed in triplicate. Statistical analysis was conducted using a two-way ANOVA; (F) Tumour viability of Mia PaCa-2 orthotopic xenografts in NSG mice expressing control shRNA, CLU shRNA, and/or DCK, treated or not with gemcitabine (n = 6 per group). PBS was used as mock treatment. Data are presented as minimum to maximum values. Statistical analysis was performed using a two-way ANOVA; (G) Ki67 staining in Mia PaCa-2 orthotopic xenografts expressing DCK and/or CLU shRNA, treated with gemcitabine. Images are representative of 15 fields from 3 different tumours. Scale bar: 100 µm. *P < 0.05, **P < 0.01, ***P < 0.005, ****P < 0.001, ns, not significant. CLU: Clusterin; PDAC: pancreatic ductal adenocarcinoma; GFP: green fluorescent protein; PBS: phosphate-buffered saline; shRNAs: small hairpin RNAs; ANOVA: analysis of variance; AUC: area under the curve.