
fig4
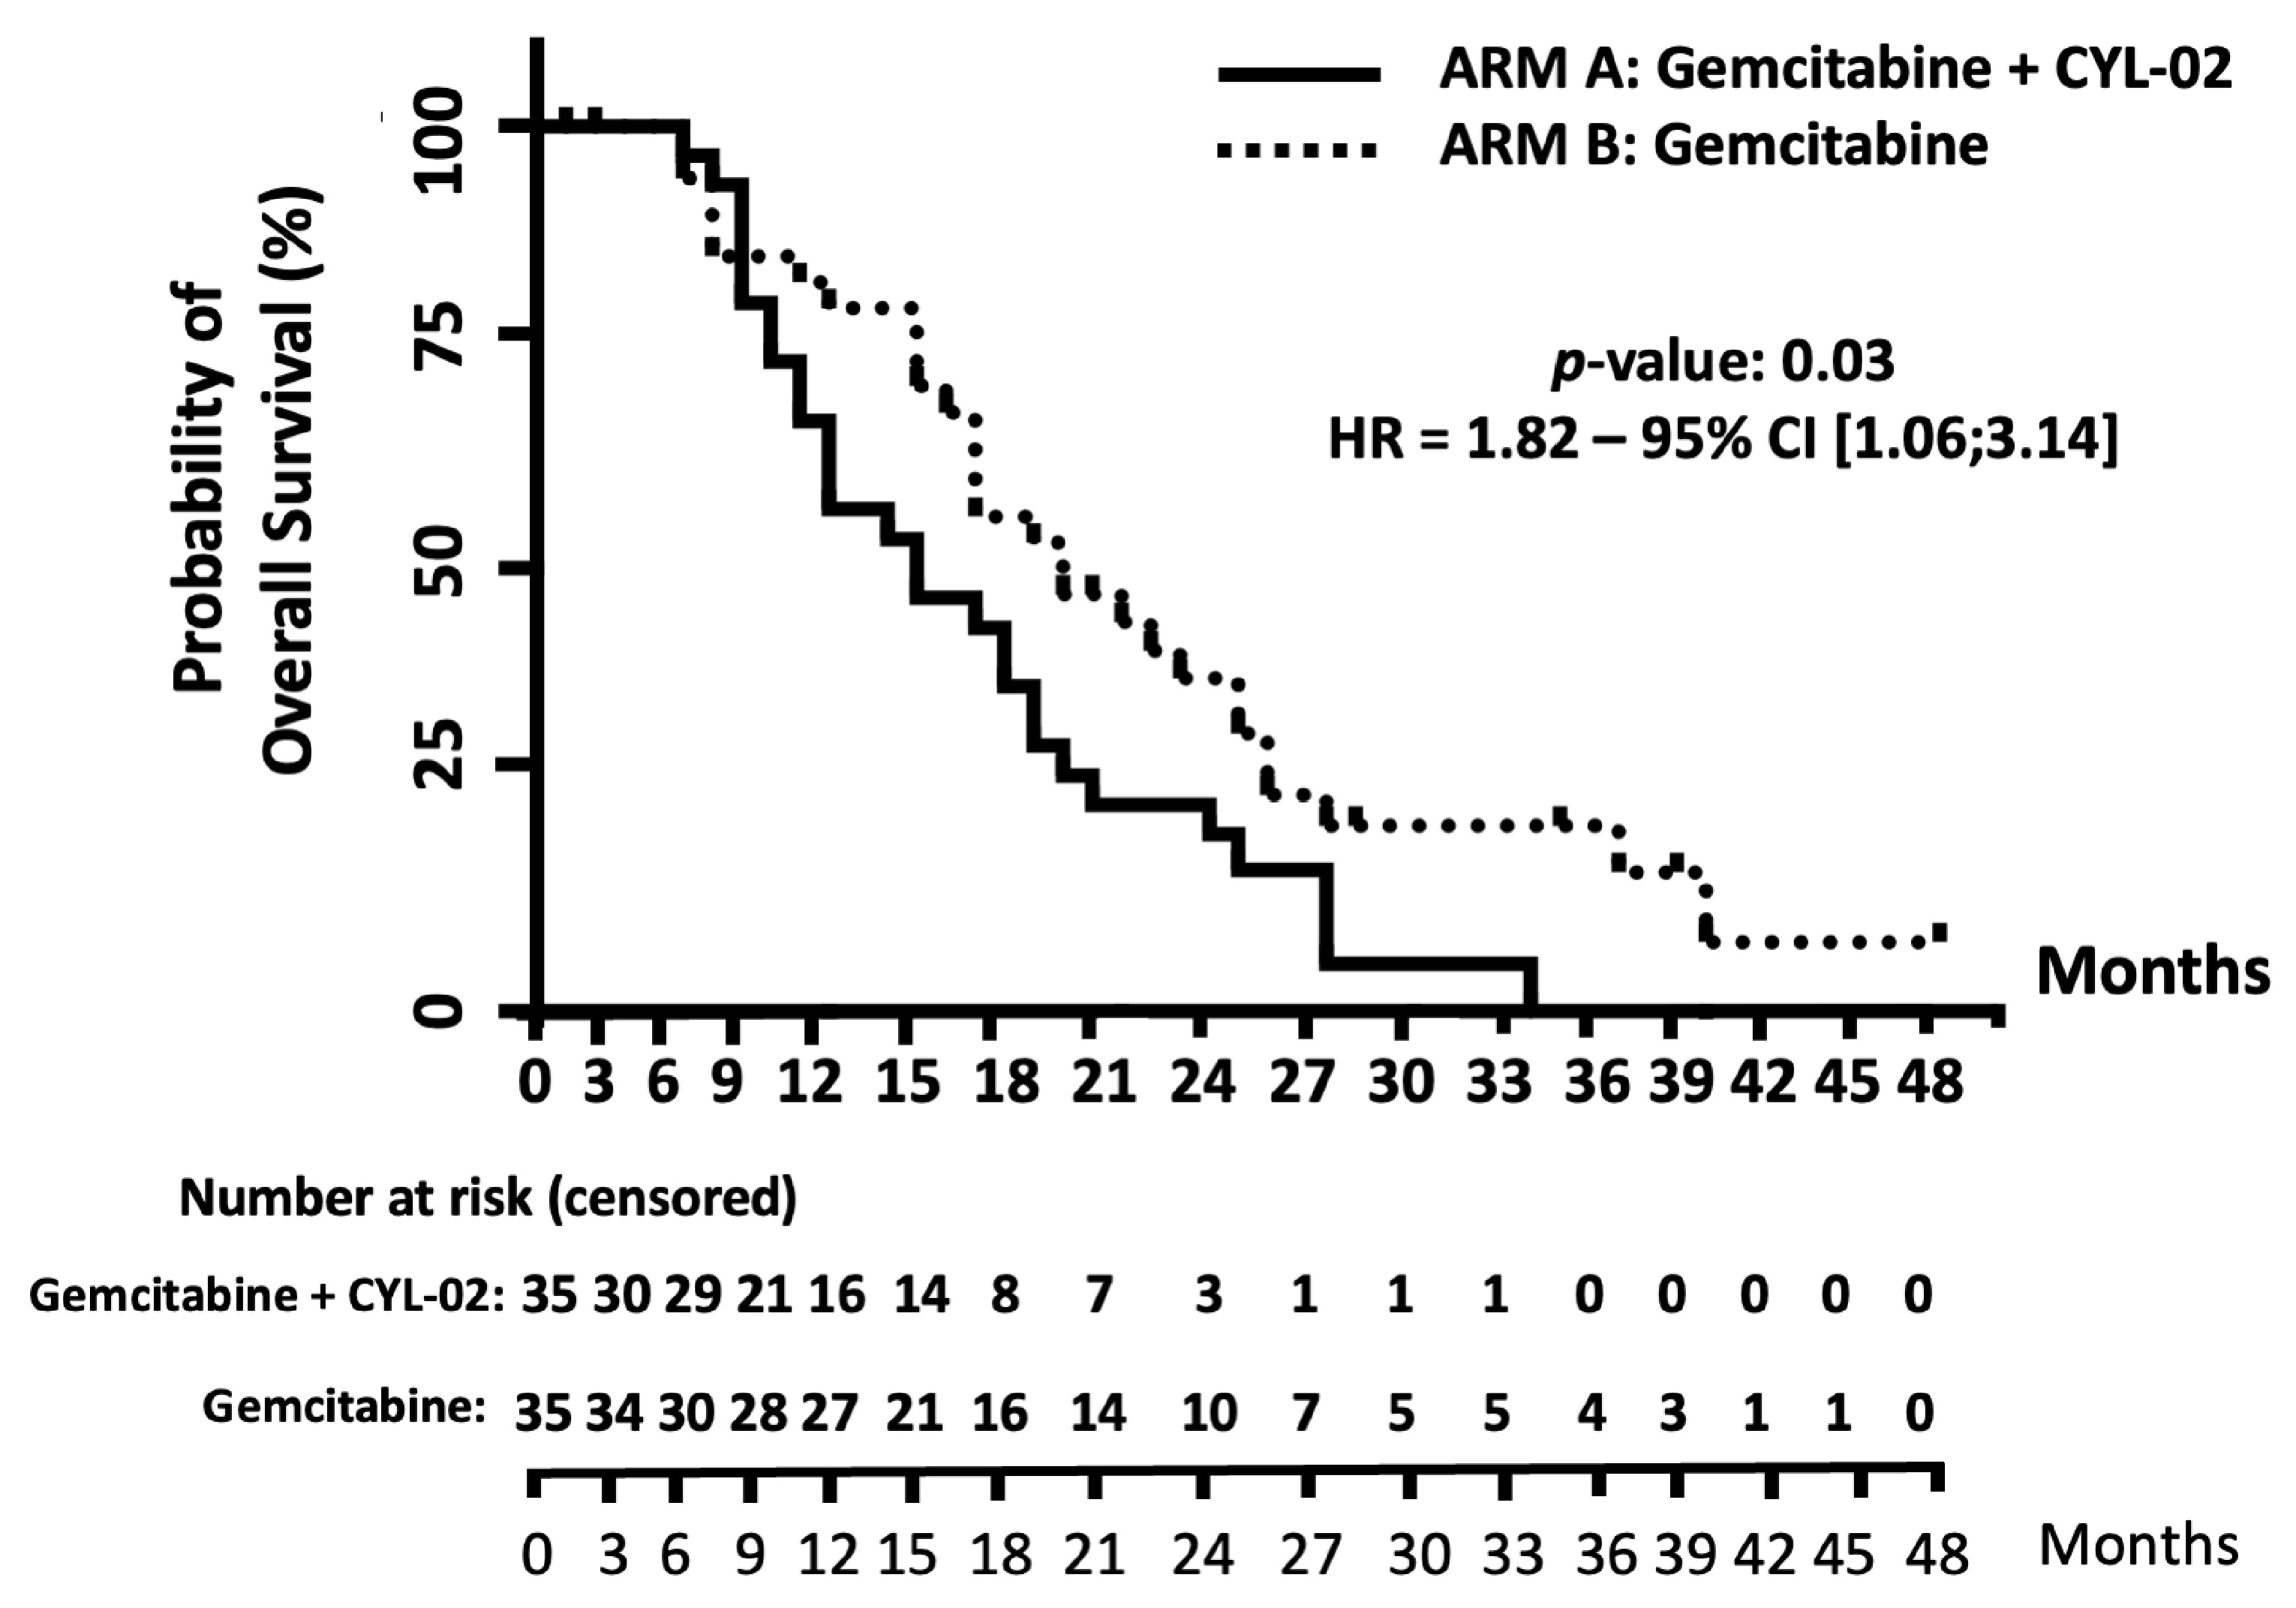
Figure 4. OS analysis using Kaplan-Meier curves for the ITT population of patients with locally advanced PDAC. This figure presents OS probabilities over 48 months for patients treated with CYL-02 + gemcitabine (Arm A, continuous line) and gemcitabine alone (Arm B, dotted line). OS: Overall survival; ITT: intent-to-treat; PDAC: pancreatic ductal adenocarcinoma; HR: hazard ratio; CI: confidence interval.