

fig7
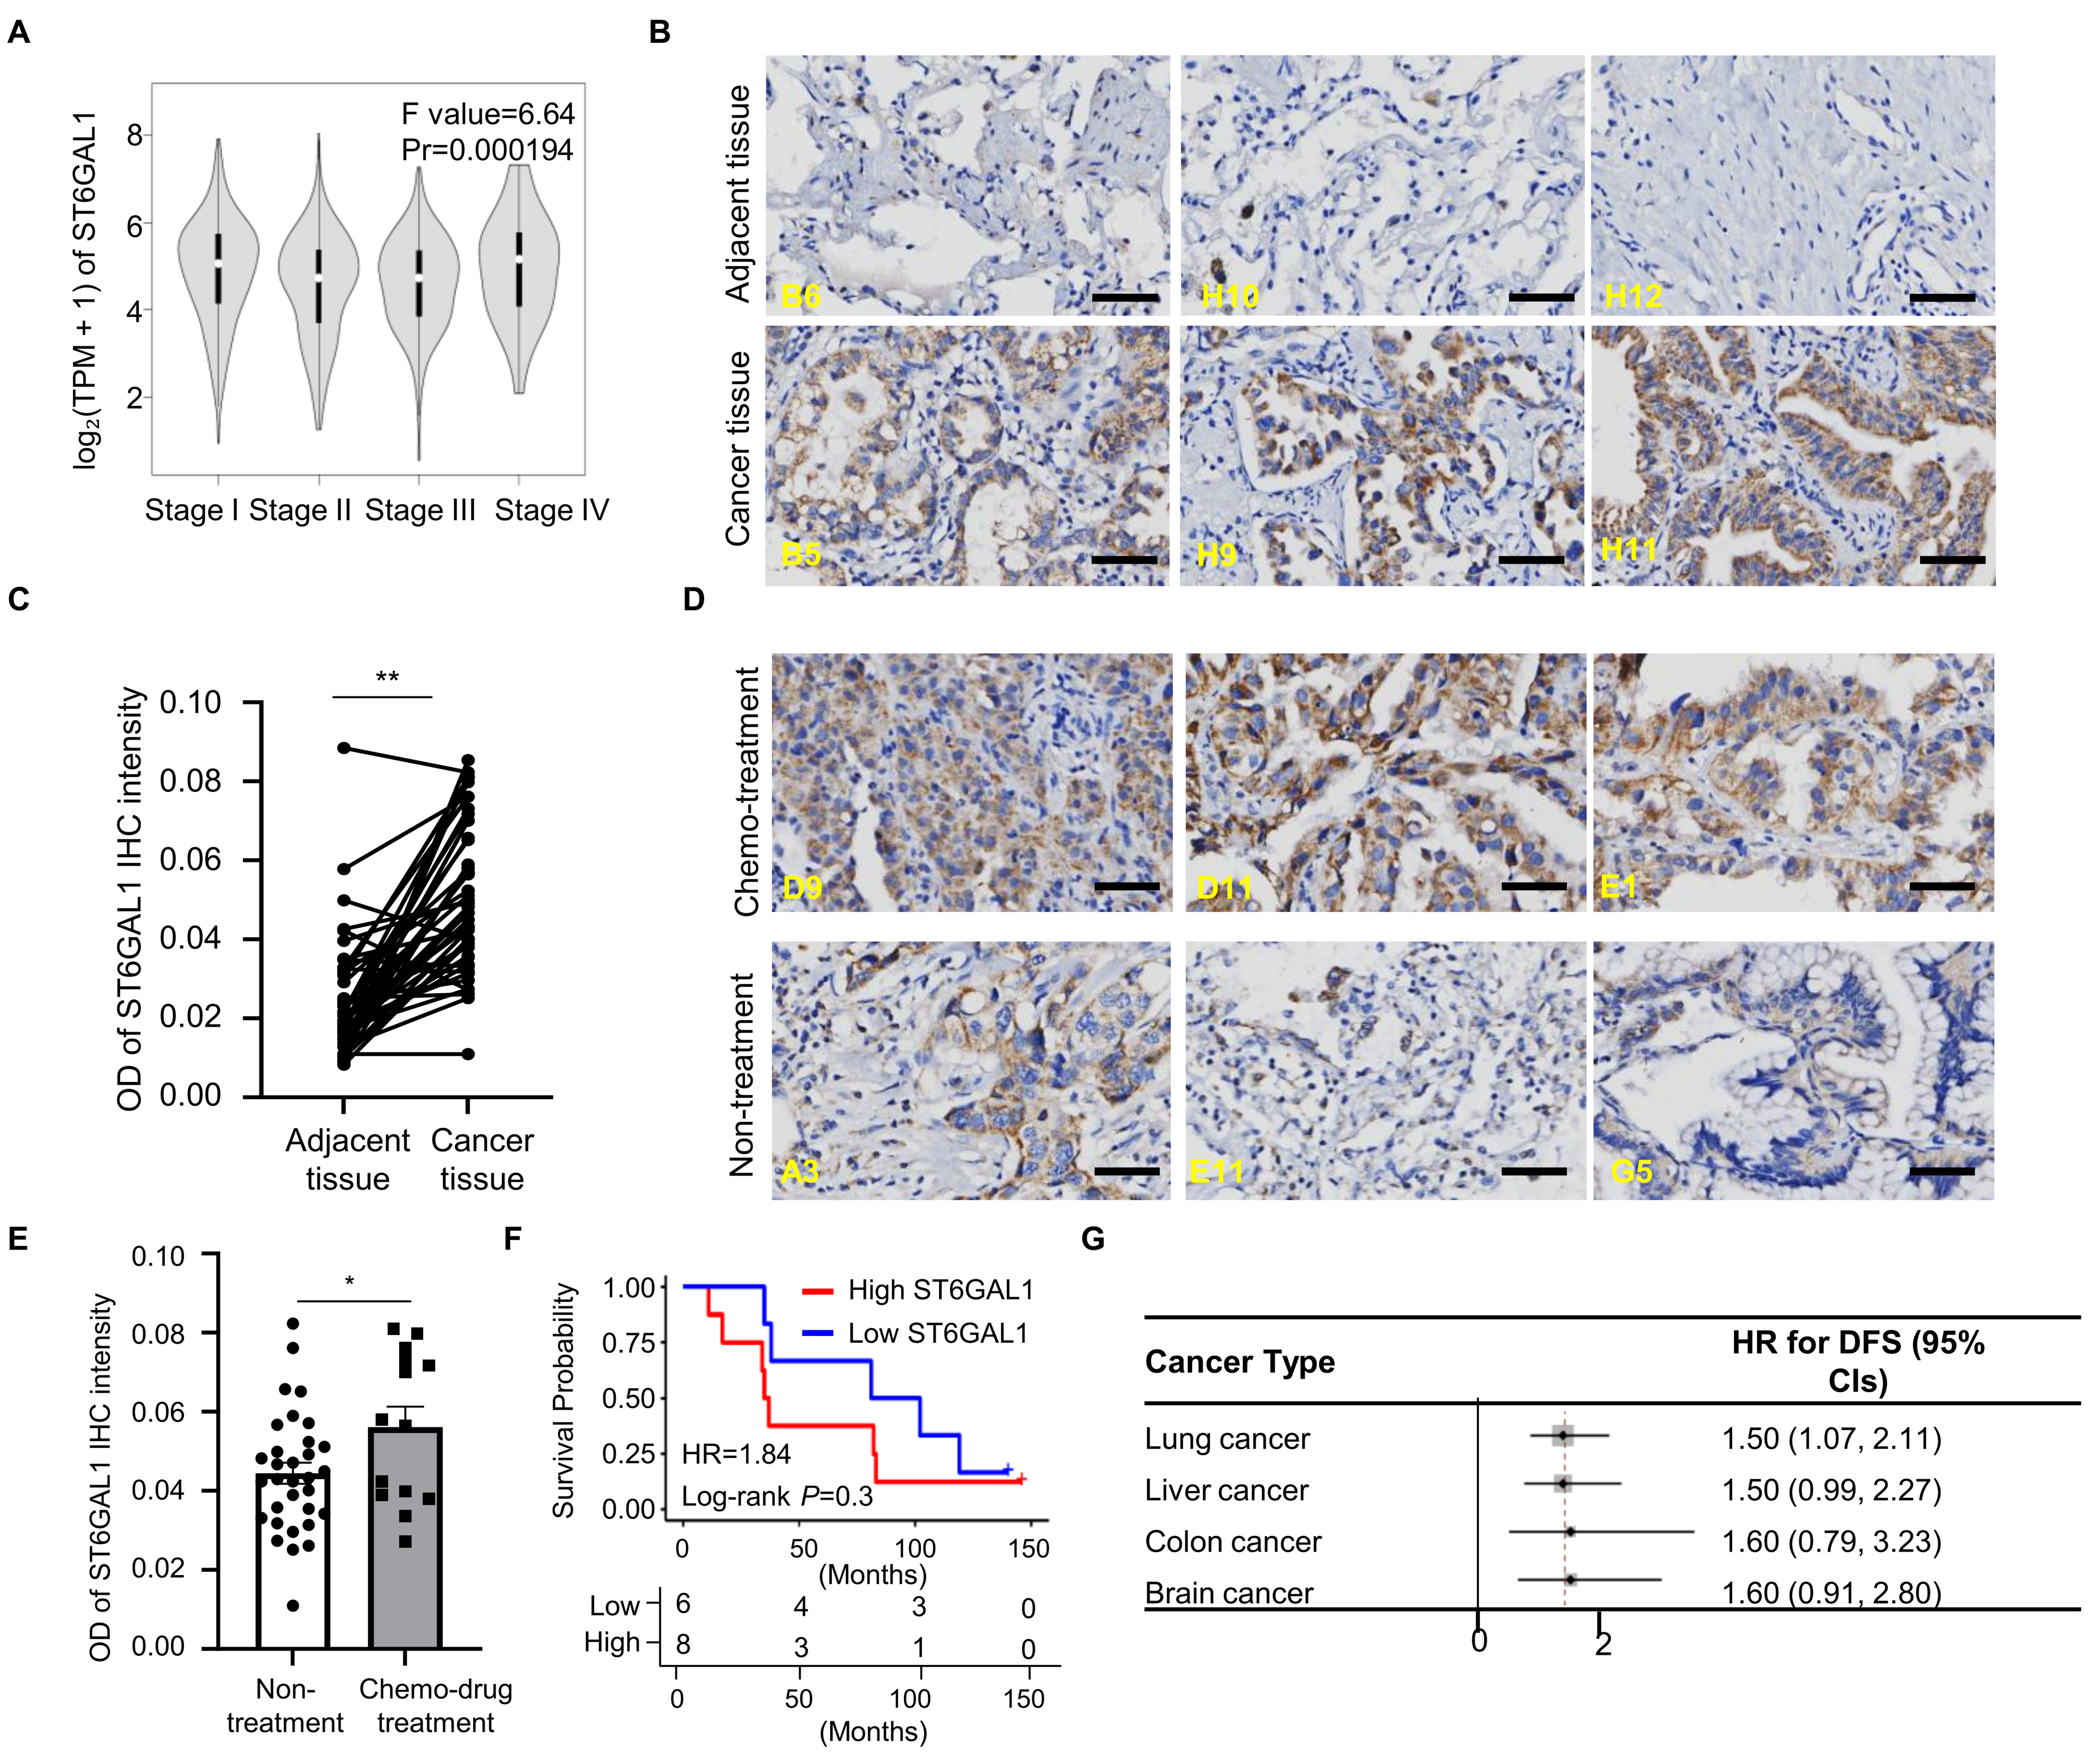
Figure 7. Clinical relevance of ST6GAL1 and the seven-gene N-glycosylation signature in lung cancer. (A) Violin plot showing ST6GAL1 expression across stages I-IV of lung cancer in the TCGA dataset, analyzed via GEPIA2; (B and C) Immunostaining (B) and quantification (C) of ST6GAL1 in adjacent normal tissues and tumor tissues from patients with lung cancer; scale bar, 50 µm; (D and E) Immunostaining (D) and quantification (E) of ST6GAL1 in cancer tissues from clinical lung cancer patients with or without chemotherapy; scale bar, 50 µm; (F) Post-chemotherapy survival curves of patients with high vs. low ST6GAL1 expression. The difference between groups was evaluated using the log-rank test, and the HR and 95%CI were estimated using Cox proportional hazards regression; (G) Forest plot showing HRs for DFS based on the expression of seven N-glycosylation-related genes across multiple cancer types. *P < 0.05; **P < 0.01. TCGA: The Cancer Genome Atlas; HR: hazard ratio; CI: confidence interval; DFS: disease-free survival; TPM: transcripts per million.





