

fig5
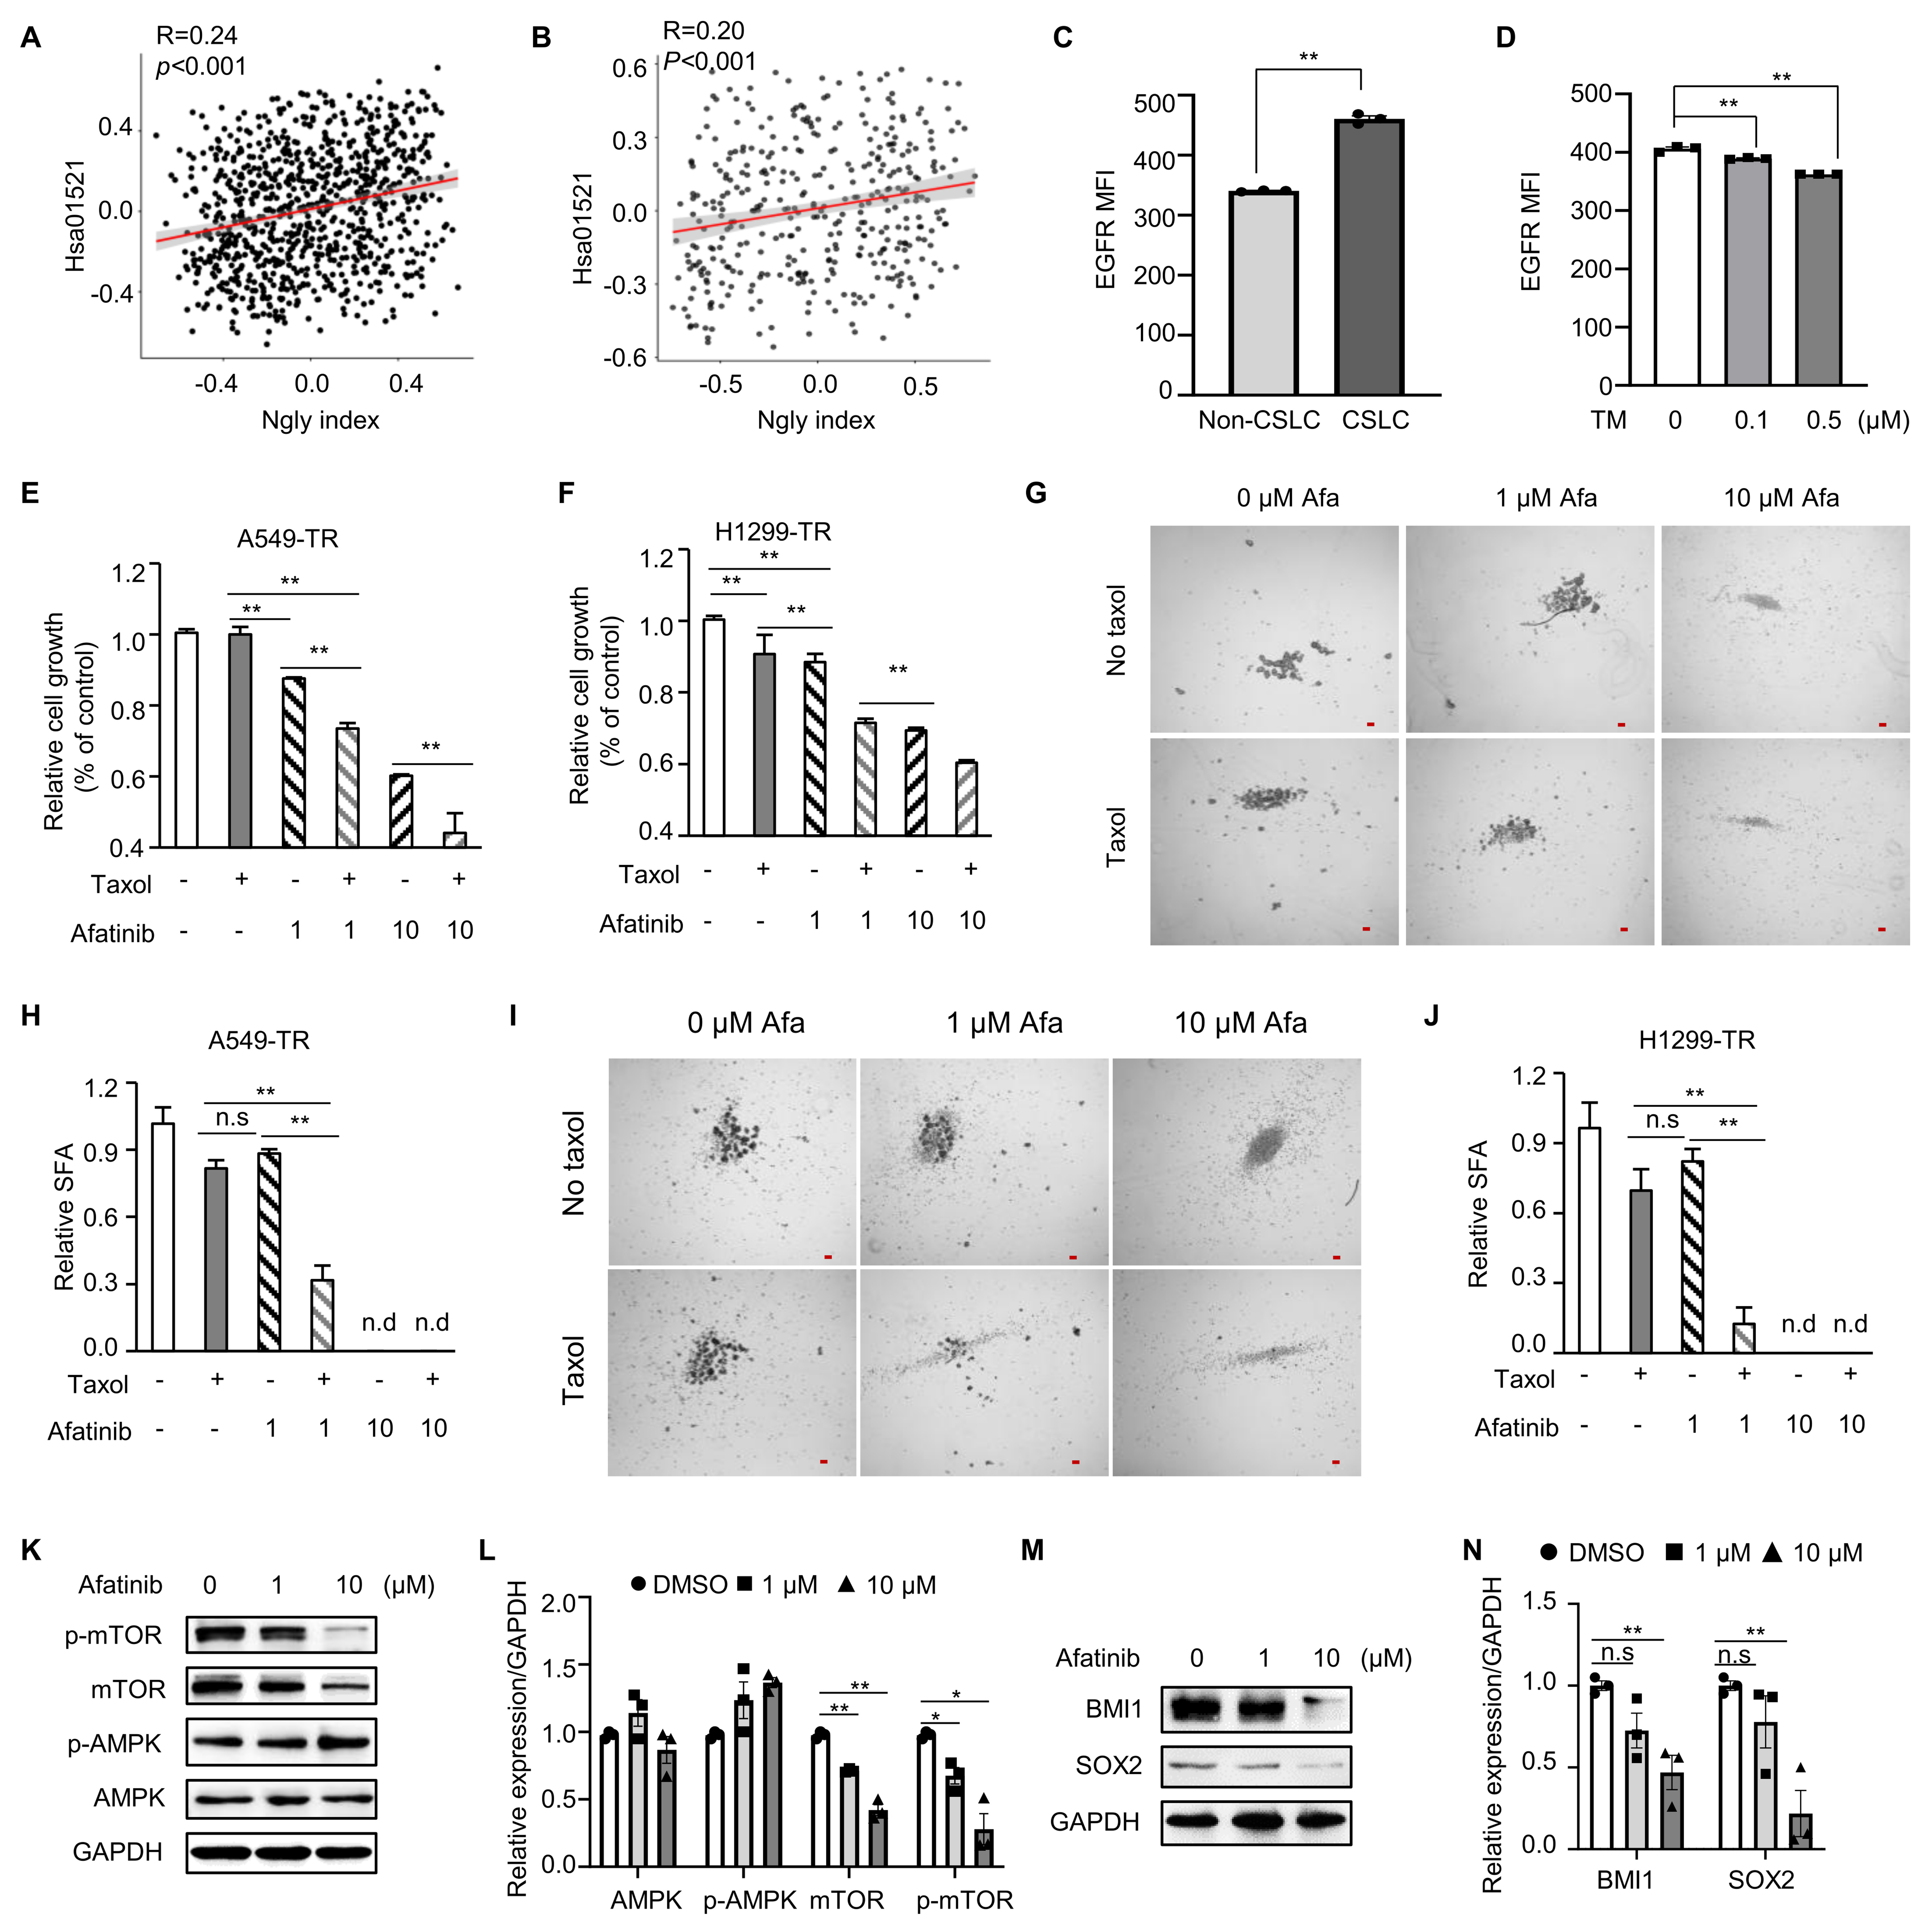
Figure 5. EGFR acted upstream of mTOR signaling in N-glycosylation-dependent CSLC-associated paclitaxel resistance. (A) Pearson correlation analysis of the N-glycosylation index with hsa01521 (EGFR tyrosine kinase inhibitor resistance) using RNA-seq data from 870 lung cancer samples; (B) Pearson correlation analysis of the N-glycosylation index with hsa01521 using TMT-quantified protein expression data from 378 cancer cell lines; (C) MFI of EGFR expression in CD104-CD166+CD49fhi CSLCs and non-CSLCs from A549-TR cells analyzed by flow cytometry; n = 3; (D) MFI of EGFR expression in A549-TR cells treated with TM, n = 3; (E and F) Relative cell growth of A549-TR (E) and H1299-TR (F) cells treated with paclitaxel in combination with afatinib, n = 4; (G-J) Representative images and quantification of spheres in A549-TR (G and H) and H1299-TR (I and J) cells treated with paclitaxel in combination with afatinib; scale bar, 100 µm; n = 4; (K and L) Representative western blots (K) and quantification (L) of p-mTOR and p-AMPK in A549-TR cells treated with 1 or 10 µM afatinib for 48 h. Statistical data were from three independent biological replicates (n = 3); (M and N) Representative western blots (M) and quantification (N) of BMI1 and SOX2 in A549-TR cells treated with 1 or 10 µM afatinib for 48 h. Statistical data were from three independent biological replicates (n = 3). n.s., not significant; *P < 0.05; **P < 0.01. EGFR: Epidermal growth factor receptor; mTOR: mechanistic target of rapamycin; CSLC: cancer stem-like cell; TMT: tandem mass tag; MFI: mean fluorescence intensity; TM: tunicamycin; Afa: afatinib; n.d.: not detected; AMPK: AMP-activated protein kinase; DMSO: dimethyl sulfoxide.





