

fig2
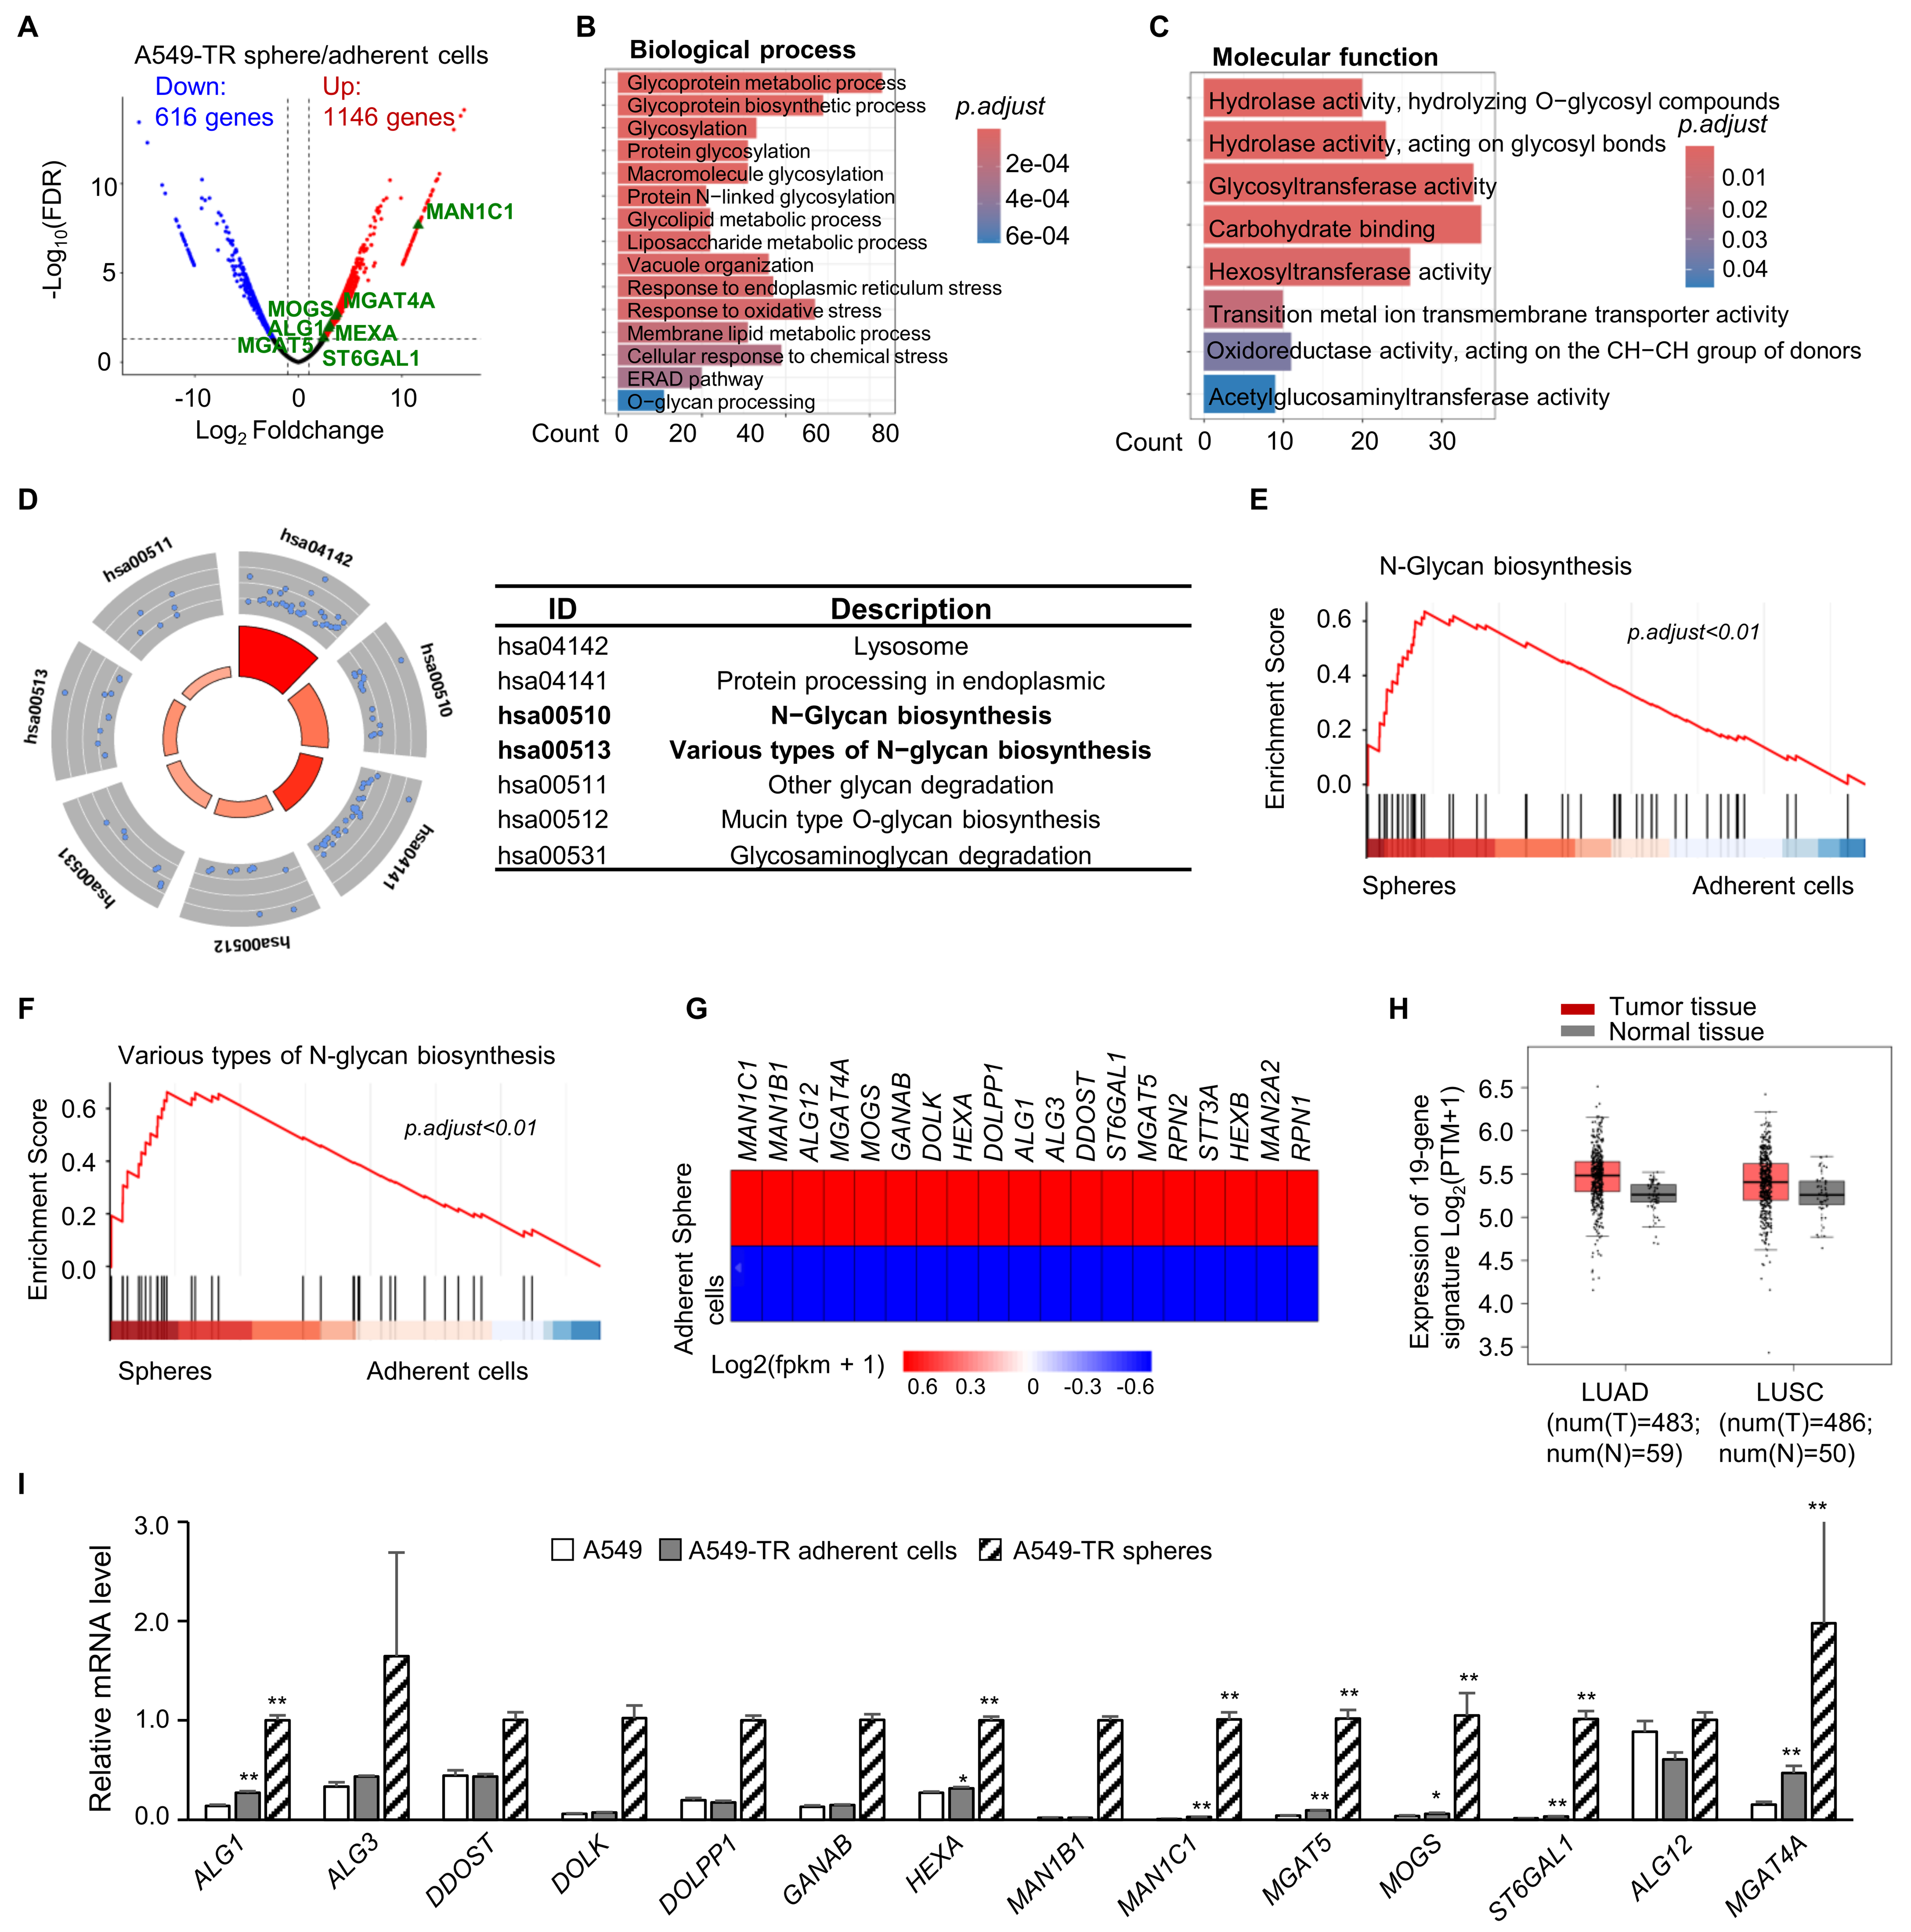
Figure 2. N-glycosylation was upregulated in the paclitaxel-resistant spheres. (A) Volcano plot showing differentially expressed genes in A549-TR spheres vs. adherent cells. Genes with a |log2-fold change| > 1 and FDR < 0.05 were considered significant. The blue and red dots represent down- and upregulated genes, respectively. The selected genes are labeled in green; (B and C) GO enrichment analysis of upregulated genes showing enriched terms in two categories: biological process (B) and molecular function (C). The color intensity represents the statistical significance of each term; (D) Circular plot for KEGG enrichment of the upregulated genes; (E and F) GSEA of N-glycan biosynthesis (E) and various types of N-glycan biosynthesis (F) in spheres vs. adherent cells. Adjusted P < 0.01; (G) Heatmap of FPKM values for 19 differentially expressed genes involved in N-glycan biosynthesis and various types of N-glycan biosynthesis; (H) Expression of a 19-gene upregulated N-glycosylation signature in tumor and normal tissues from the TCGA-LUAD and TCGA-LUSC cohorts; (I) RT-qPCR validation of the top 14 upregulated N-glycosylation-related genes in A549-TR adherent cells and spheres compared with parental cells, n = 4. *P < 0.05; **P < 0.01. FDR: False discovery rate; GO: Gene Ontology; KEGG: Kyoto Encyclopedia of Genes and Genomes; GSEA: gene set enrichment analysis; FPKM: fragments per kilobase of transcript per million mapped reads; TCGA: The Cancer Genome Atlas; LUAD: lung adenocarcinoma; LUSC: lung squamous cell carcinoma; RT-qPCR: reverse transcription quantitative polymerase chain reaction.





