

fig1
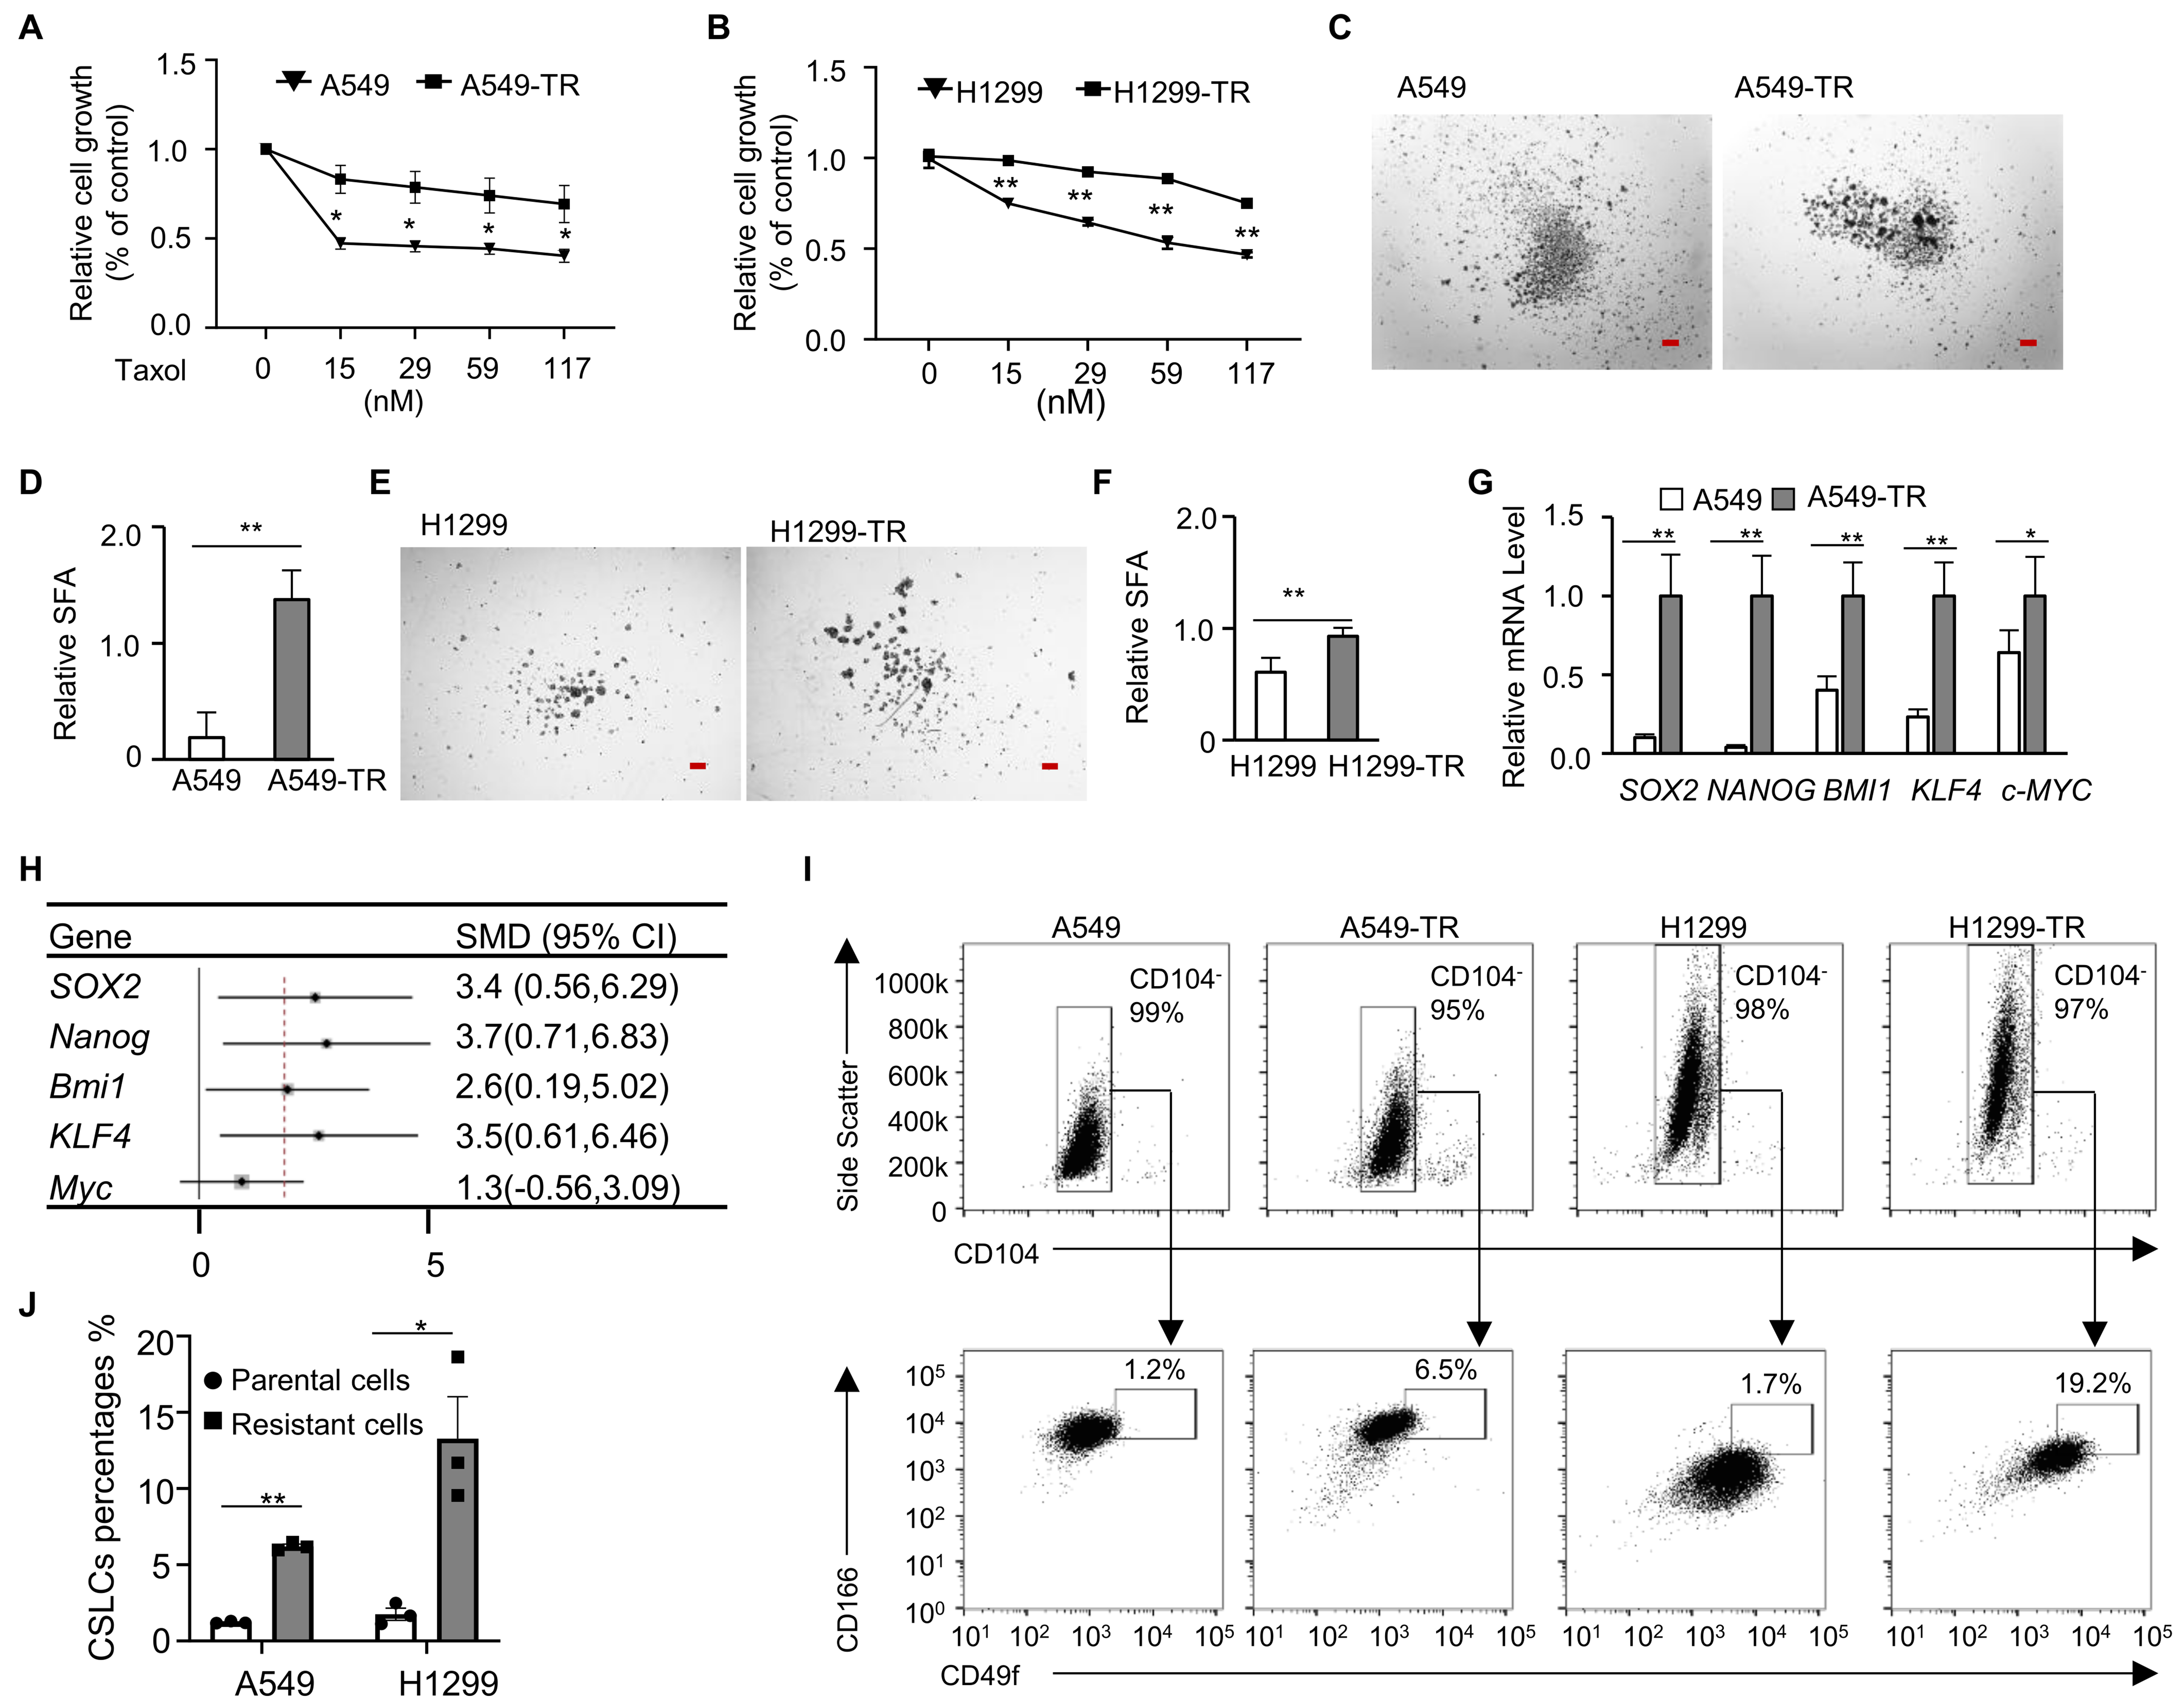
Figure 1. Acquired paclitaxel-resistant cells showed enrichment of CSLC populations. (A and B) Relative cell growth of A549-TR (A) and H1299-TR (B) cells treated with increasing concentrations of paclitaxel (0-117 nM) for 48 h; parental cells were the controls; n = 3; (C-F) Representative images (C and E) and quantification (D and F) of the relative SFA of parental and resistant cells following 117 nM paclitaxel treatment. Scale bar, 100 μm; n = 4; (G) RT-qPCR analysis of stemness-associated gene expression in A549-TR spheres vs. A549 spheres. n = 3; (H) Forest plot showing the gene-specific SMDs of stemness gene expression levels in resistant spheres vs. parental spheres; (I and J) Representative gating plots (I) and quantification (J) of CD104-CD166+CD49fhi CSLC subpopulations in parental cells and resistant cells; n = 3. *P < 0.05; **P < 0.01. CSLC: Cancer stem-like cell; SFA: sphere-forming ability; RT-qPCR: reverse transcription quantitative polymerase chain reaction; SMDs: standardized mean differences; CI: confidence interval.





