

fig2
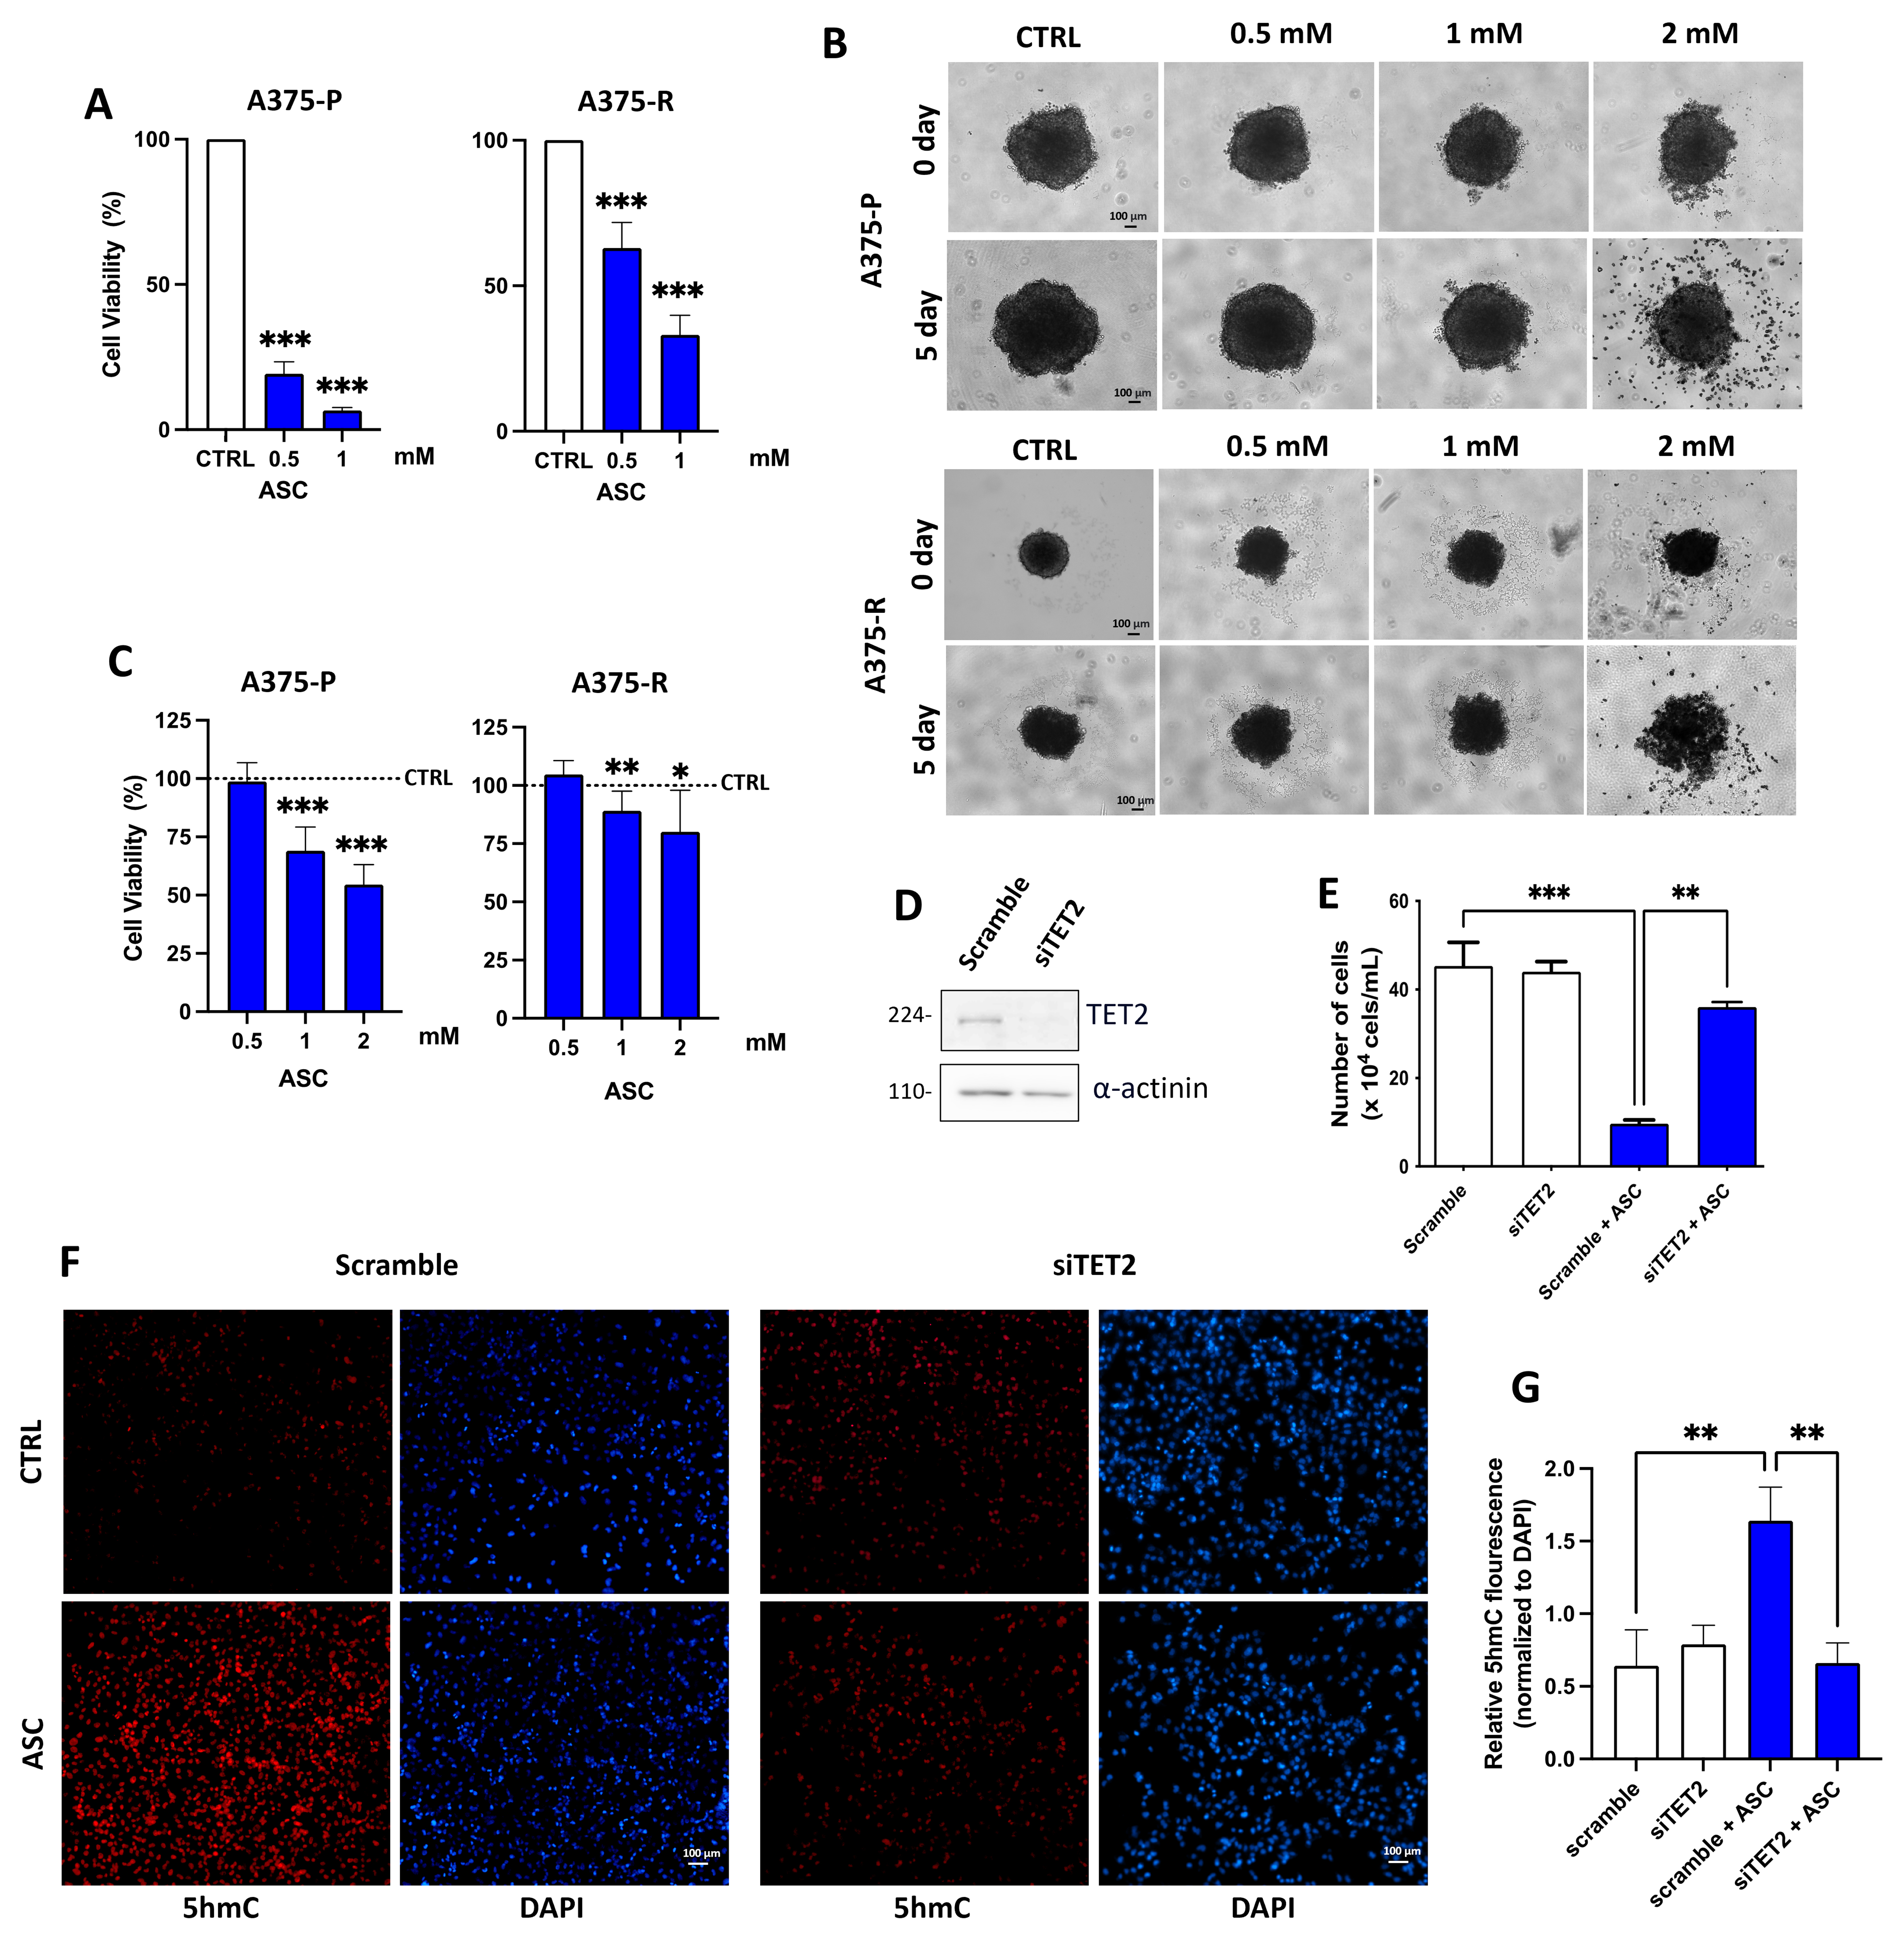
Figure 2. Effect of ASC treatment on cell viability and 5hmC levels in A375 cells. (A) MTT assay of A375-P and A375-R treated with 0.5 and 1 mM ASC; (B) Representative images and (C) MTT assay of 3D cultures of A375-P and A375-R treated with 0.5, 1, and 2 mM ASC. Scale bar = 100 µm. The dashed line represents the untreated CTRL baseline (100%); (D) Western blot showing TET2 silencing in A375-R cells; images are representative of three independent western blots; (E) Direct cell counting of A375-R cells silenced for TET2 with/without 0.5 mM ASC; (F) Fluorescence quantification and (G) representative images of 5hmC levels in A375-R cells silenced for TET2 with/without 0.5 mM ASC. Scale bar = 100 µm. Where indicated, CTRL refers to PBS used as the vehicle control for ASC. Statistical analysis in all bar graphs was performed by one-way ANOVA. *P < 0.05; **P < 0.01; ***P < 0.001. All experiments were performed in n = 3 independent biological replicates. ASC: L-ascorbic acid; 5hmC: 5-hydroxymethylcytosine; MTT: 3-[4,5-dimethylthiazol-2-yl]-2,5 diphenyl tetrazolium bromide; 3D: three-dimensional; TET: Ten-Eleven Translocation; PBS: phosphate-buffered saline; ANOVA: analysis of variance; DAPI: 4′,6-diamidino-2-phenylindole.





