

fig7
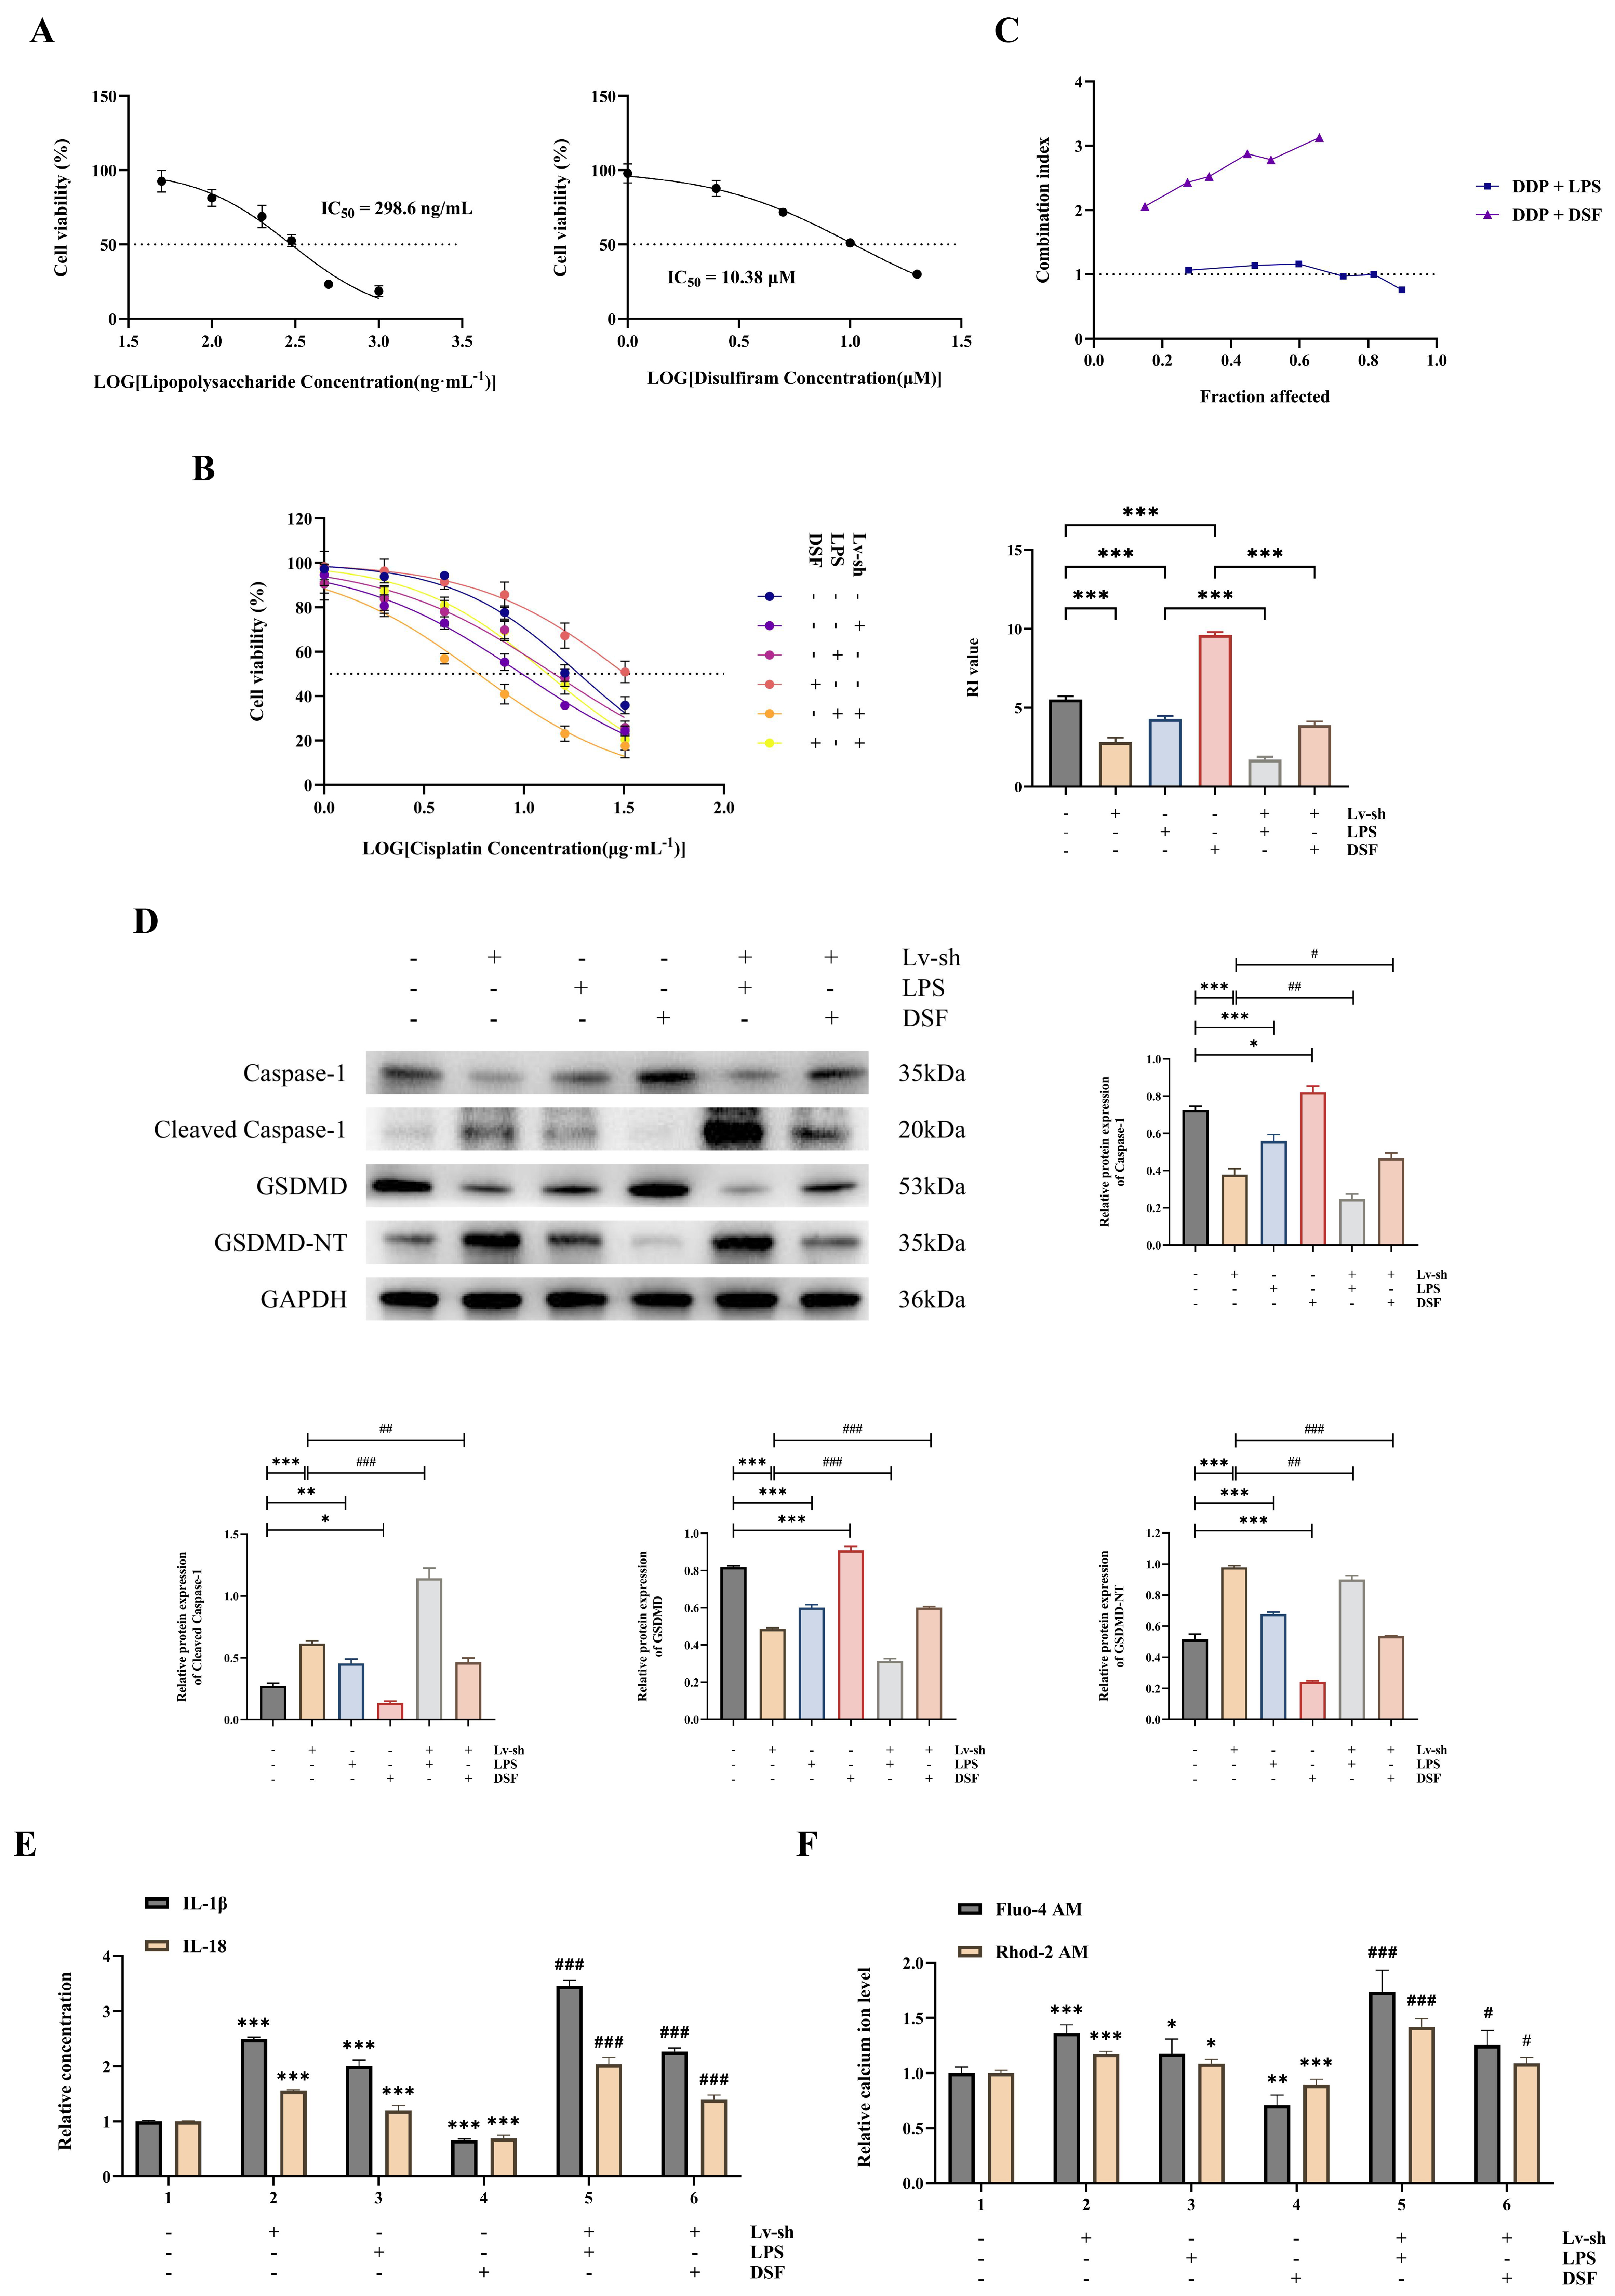
Figure 7. LINC01133 regulates cisplatin resistance, pyroptosis, and calcium homeostasis through GSDMD. (A) A549/DDP cell viability after treatment with varying doses of LPS (50, 100, 200, 300, 500, and 1,000 ng/mL) and DSF (1, 2.5, 5, 10, and 20 μM) was measured through a CCK-8 assay to determine the optimal working concentrations; (B) Changes in the cisplatin RI of A549/DDP cells after silencing LINC01133 and modulating GSDMD expression, as measured by a CCK-8 assay; (C) The combination effects of DDP with LPS or DSF were quantitatively analyzed using the Chou-Talalay model, and CI-Fa curves were generated. Fa represents the effect level; CI < 1 indicates synergism, CI = 1 indicates an additive effect, and CI > 1 indicates antagonism; (D) Changes in the protein expression of key pyroptosis markers detected by Western blotting. Densitometric values of the target proteins were normalized to GAPDH and are presented as relative protein expression levels. Data were obtained from three independent biological replicates and are presented as the mean ± SD (n = 3); (E) The levels of the inflammatory factors IL-1β and IL-18 in the cell supernatants were analyzed by ELISA; (F) Changes in cytoplasmic and mitochondrial calcium ion levels were detected using Fluo-4 AM and Rhod-2 AM fluorescent probes, respectively. Comparisons among multiple group means were conducted using two-way ANOVA. *P < 0.05, **P < 0.01, and ***P < 0.001 indicate statistical significance vs. the A549/DDP-NC group; #P < 0.05, ##P < 0.01, and ###P < 0.001 indicate statistical significance vs. the A549/DDP-sh-LINC01133 group. DDP: Cisplatin; LPS: lipopolysaccharide; DSF: disulfiram; CCK-8: Cell Counting Kit-8; RI: resistance index; SD: standard deviation; ELISA: enzyme-linked immunosorbent assay; ANOVA: analysis of variance; IC50: half-maximal inhibitory concentration.





