

fig8
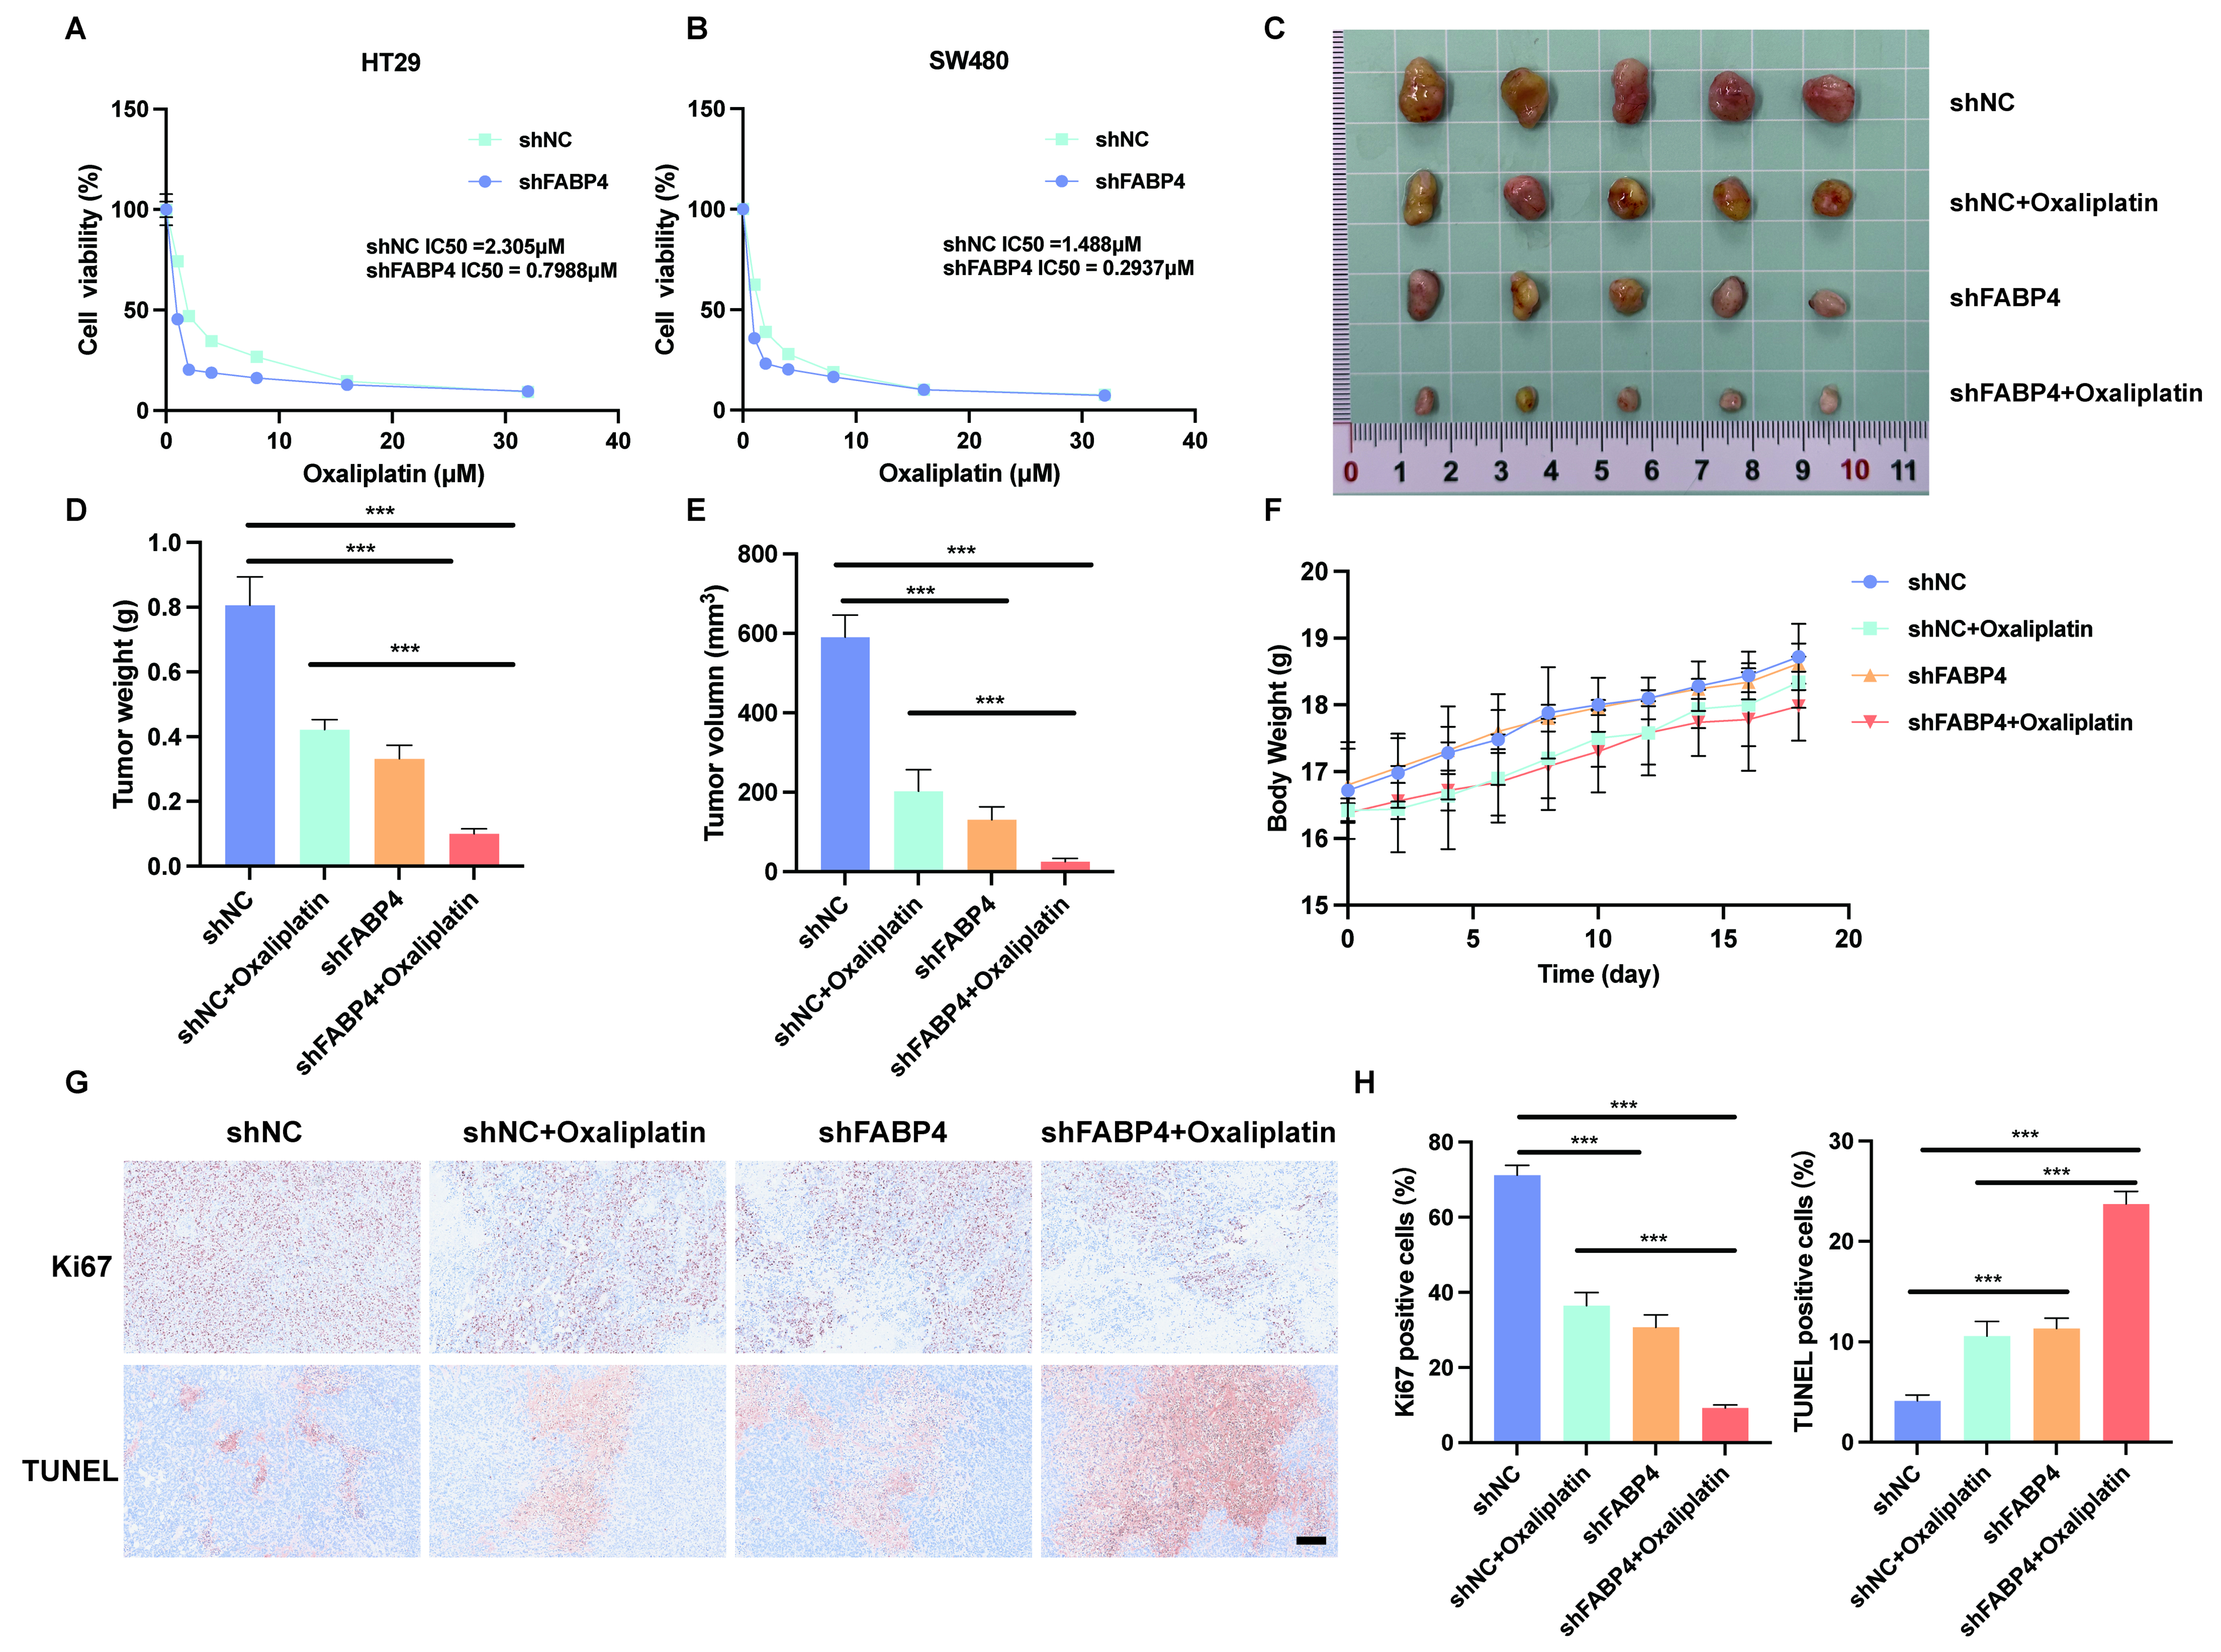
Figure 8. FABP4 promoted resistance to oxaliplatin in CRC. (A and B) Enhanced oxaliplatin susceptibility was observed in CRC cells after FABP4 knockdown (n = 3 biological replicates); (C) Representative images of tumors from four groups (shNC, shNC + oxaliplatin, shFABP4, shFABP4 + oxaliplatin) (n = 5 per group); (D) The weight of tumors from four groups; (E) The volume of tumors from four groups measured at the end of the experiment; (F) Body weight measurements of mice across the experimental period; (G) Ki67 and TUNEL staining images of tumors after different treatments (Scale bar = 0.2 mm; n = 3 per group); (H) The quantitative analysis of Ki67 and TUNEL staining. Data are presented as mean ± SD. Statistical significance was determined by one-way ANOVA followed by Tukey’s post-hoc test for multiple comparisons. *** indicates P < 0.001. CRC: Colorectal cancer; SD: standard deviation; ANOVA: analysis of variance.





