

fig3
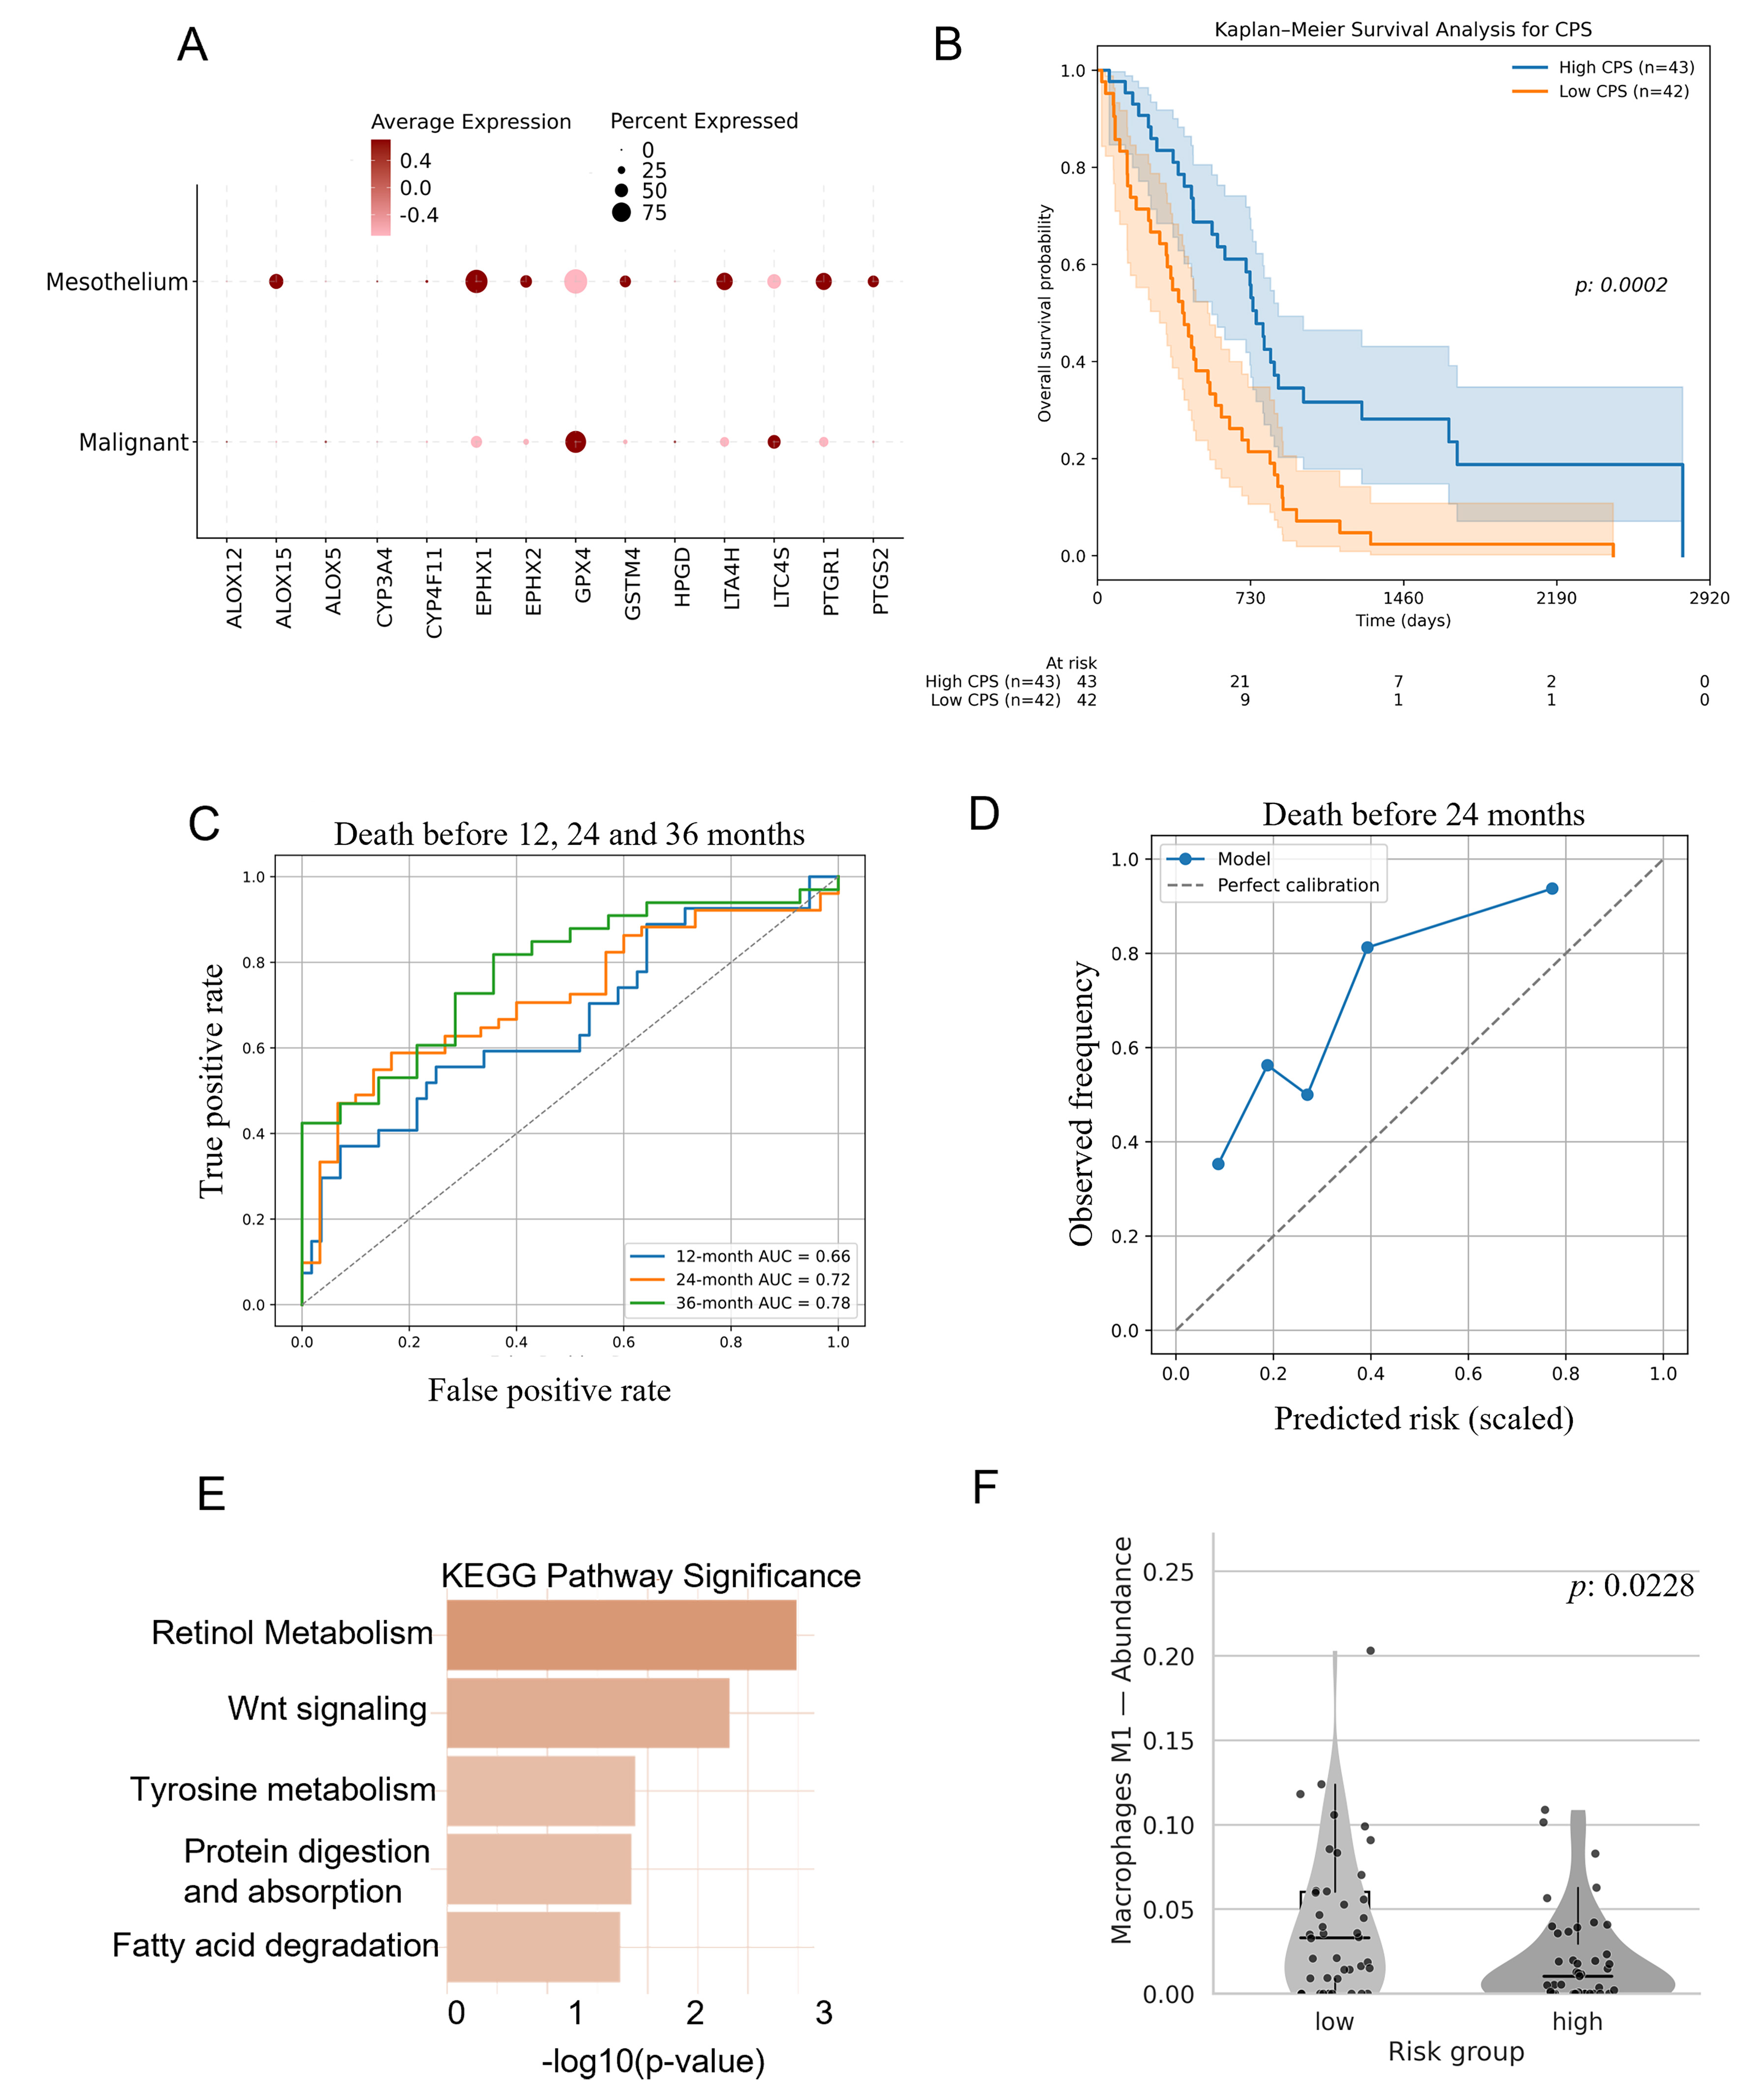
Figure 3. SPM-producing enzymes are downregulated in malignant mesothelial cells and predict prognosis. (A) Expression of SPM-producing enzymes in mesothelioma and intra-tumoral diploid mesothelial cells from an scRNA-seq dataset (GSE190597). Dot size indicates the percentage of cells expressing each gene, whereas color intensity indicates average normalized expression; (B) Survival probability over time of MPM patients based on the CPS. The CPS was derived by LASSO regression with bootstrap resampling and survival was compared by Kaplan-Meier analysis with the log-rank test; (C) Time-dependent ROC analysis evaluating the predictive performance of CPS risk scores for death before 12, 24, and 36 months. AUC values were 0.66 at 12 months, 0.72 at 24 months, and 0.78 at 36 months, with corresponding 95% confidence intervals of 0.53-0.79, 0.61-0.83, and 0.64-0.90, respectively, estimated by non-parametric bootstrap resampling; (D) Calibration curve of MPM patients at 24 months based on the CPS. The optimal threshold was defined using Youden’s index; (E) KEGG pathway enrichment analysis of differentially expressed genes between the high- and low-CPS groups. Differentially expressed genes were identified using limma, with P-values adjusted using the Benjamini-Hochberg false discovery rate correction. The more intense color of the first bar indicates higher significance; (F) Violin plots showing the distribution of M1 macrophages between the high- and low-CPS expressing groups, based on RNA-seq deconvolution results using CIBERSORTx (P < 0.05). Immune-cell proportions were estimated by CIBERSORTx and compared between groups by the two-sided Mann-Whitney U test. CPS: Composite prognostic score; SPM: specialized pro-resolving mediator; MPM: malignant pleural mesothelioma; AUC: area under the curve.





