

fig2
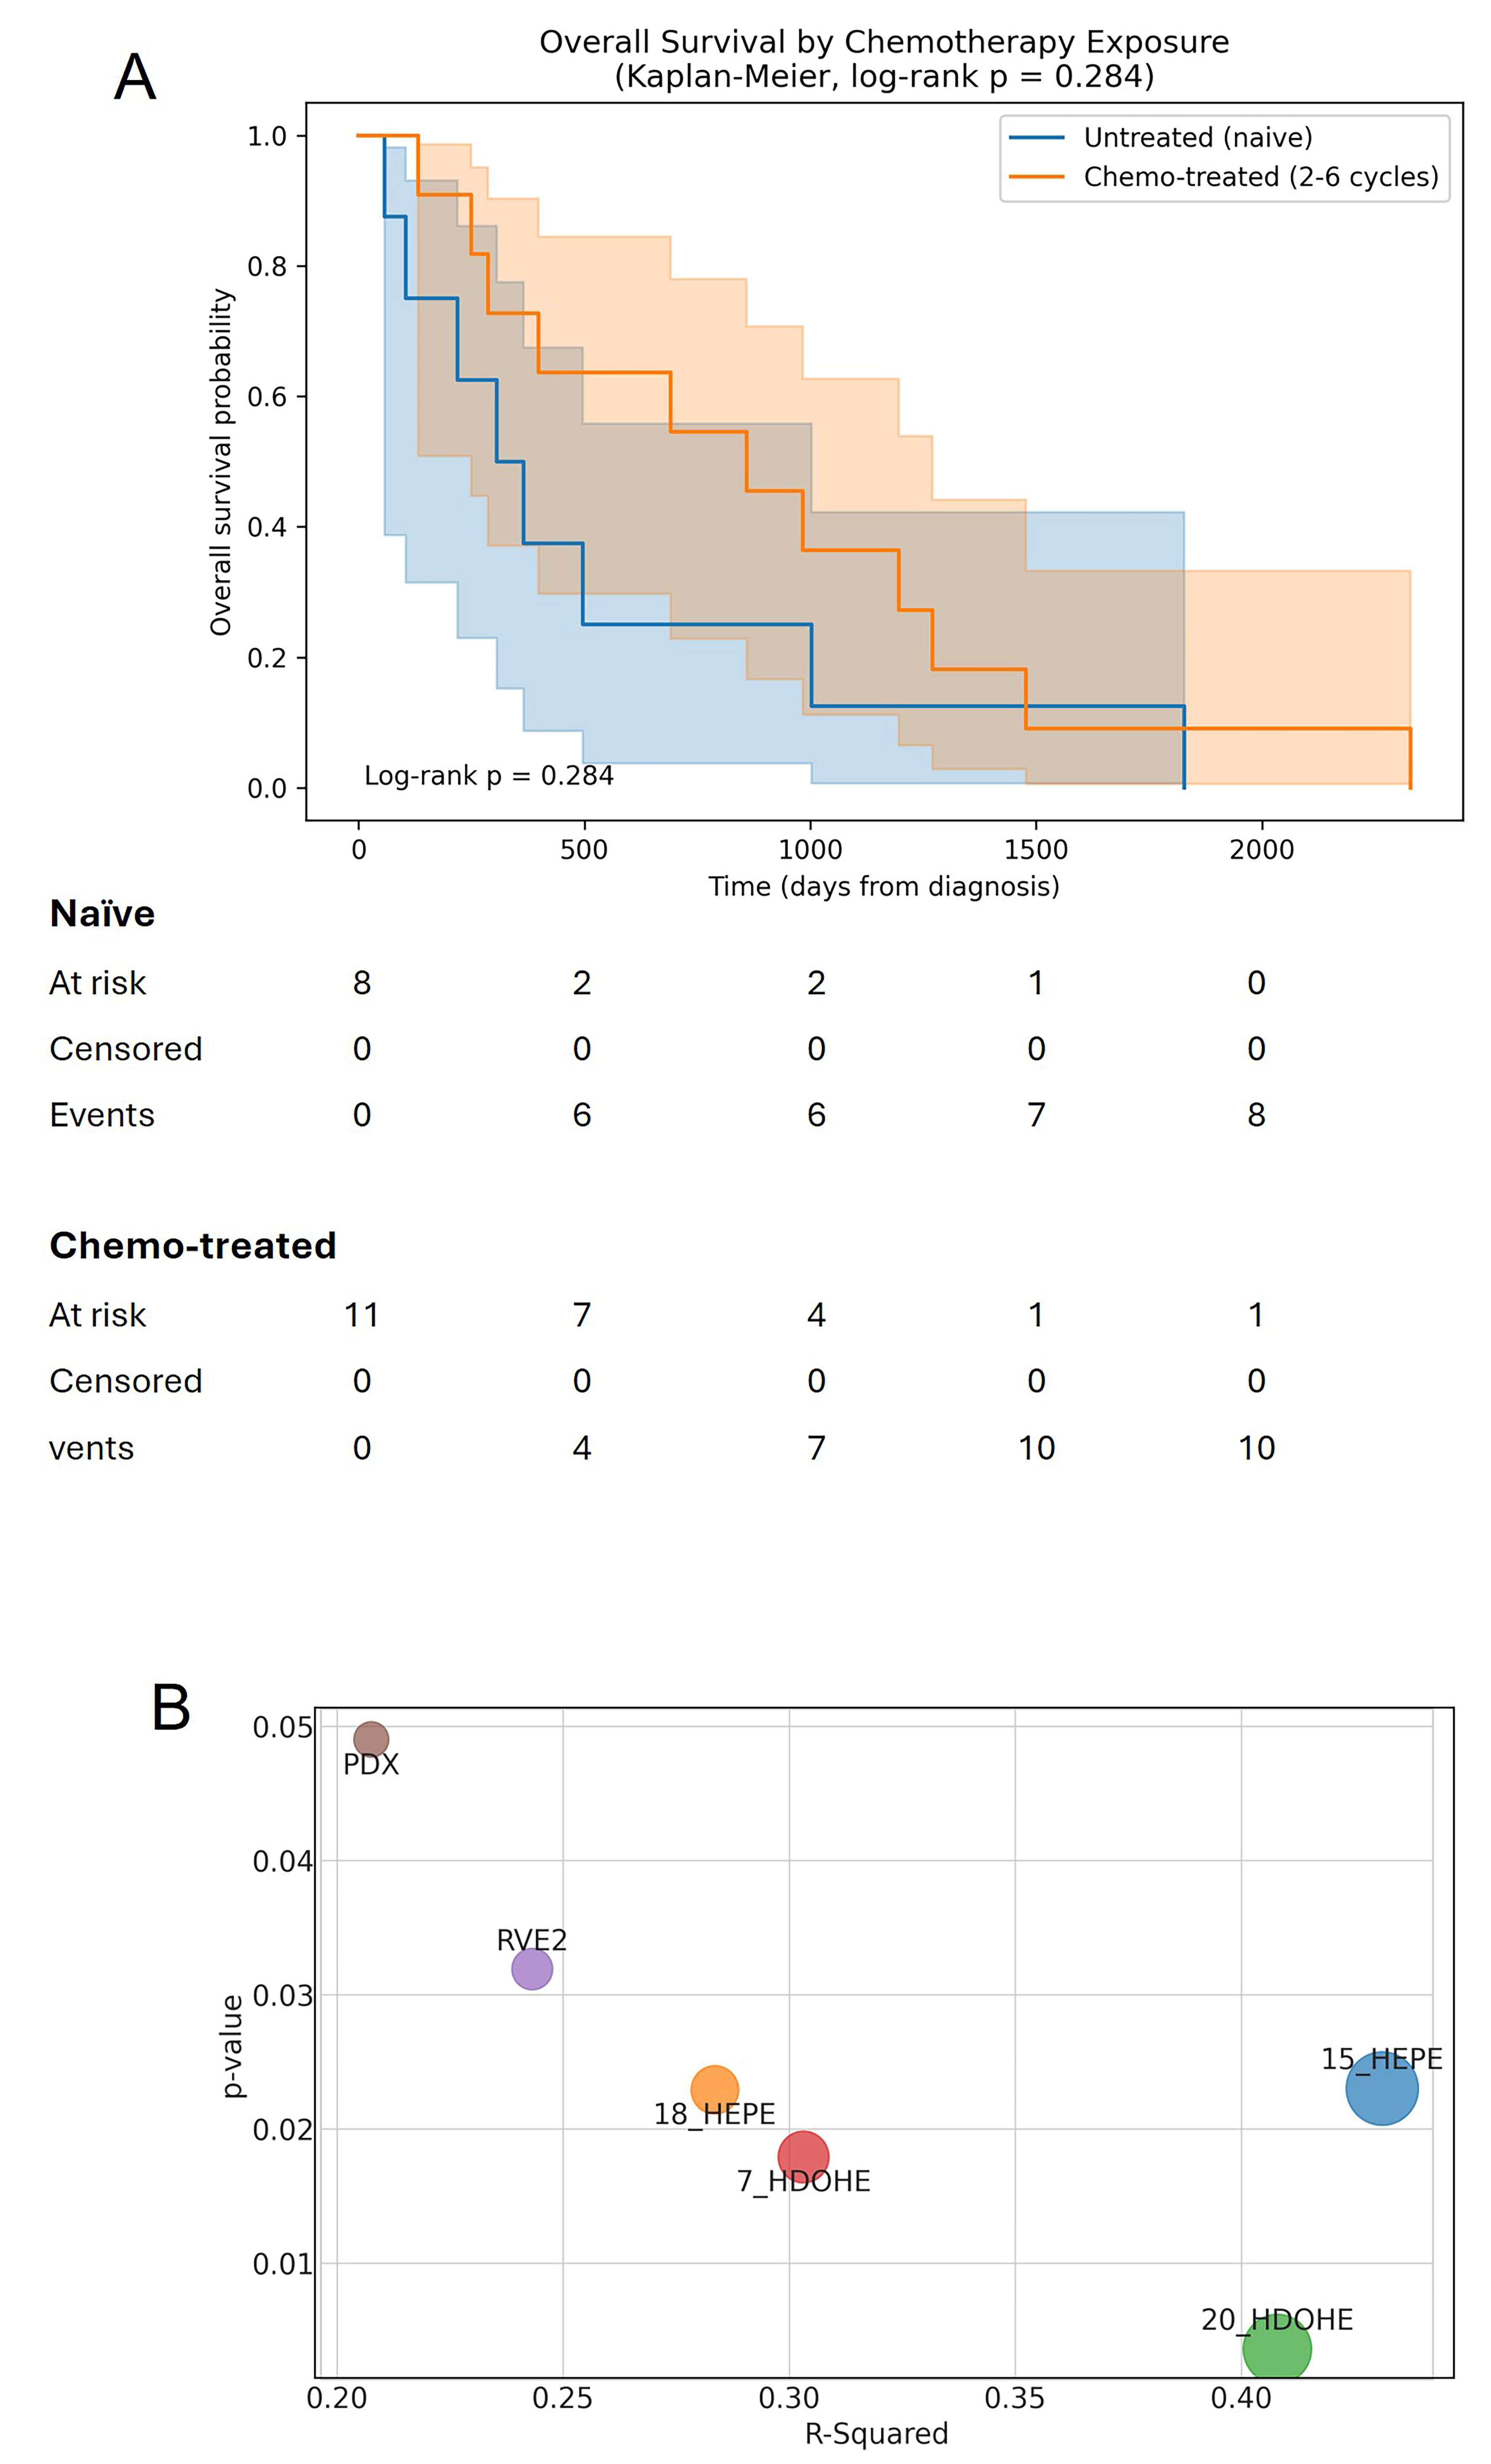
Figure 2. Defective SPM release in chemotherapy-treated patients does not confer a survival advantage. (A) OS of patients in this study by treatment. Graphs reporting the OS of the patients whose pleural effusions underwent lipidomic analysis. Kaplan-Meier survival curves were compared using the log-rank test (P = 0.284; ns: not significant); (B) Multiple correlation analysis identified the levels of the indicated oxylipins as significantly correlated with the OS of the patients. Bubble plot: X-axis: R-Squared; Y-axis: P-value; Bubble size: proportional to R-Squared. For the analysis, the free StatCalculator was used (https://www.statscalculators.com/).





